Part 1 Candle Stick Patterns How Call Options Work
Call Buyer
A call buyer expects the price of the underlying to rise.
For example, if a stock is at ₹100, and you buy a Call Option at ₹105 for a premium of ₹5:
If stock goes to ₹120 → Profit
If stock stays below ₹105 → Loss limited to ₹5 premium
Unlimited upside, limited downside.
Call Seller
A call seller (also called a writer) expects price to stay below the strike.
Seller earns the premium but risks unlimited losses if price rises sharply.
Trend Line Break
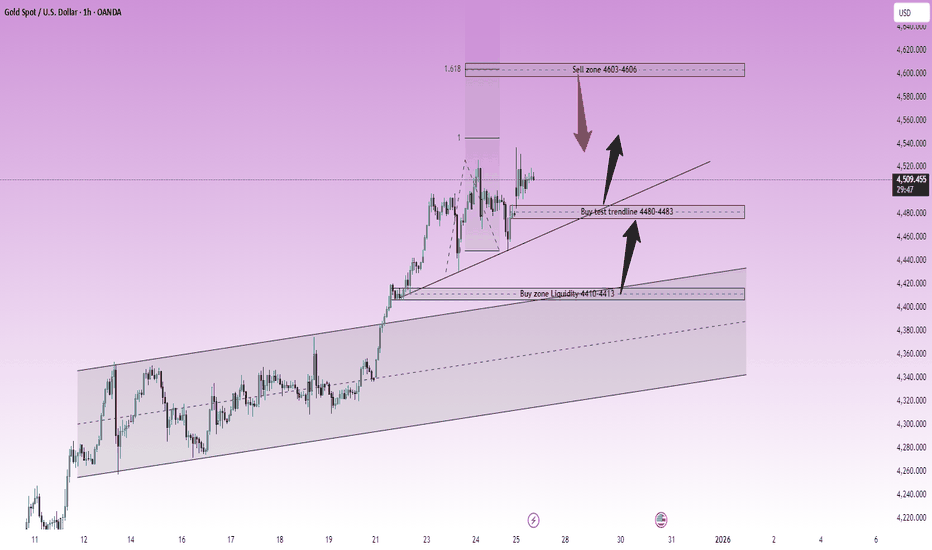
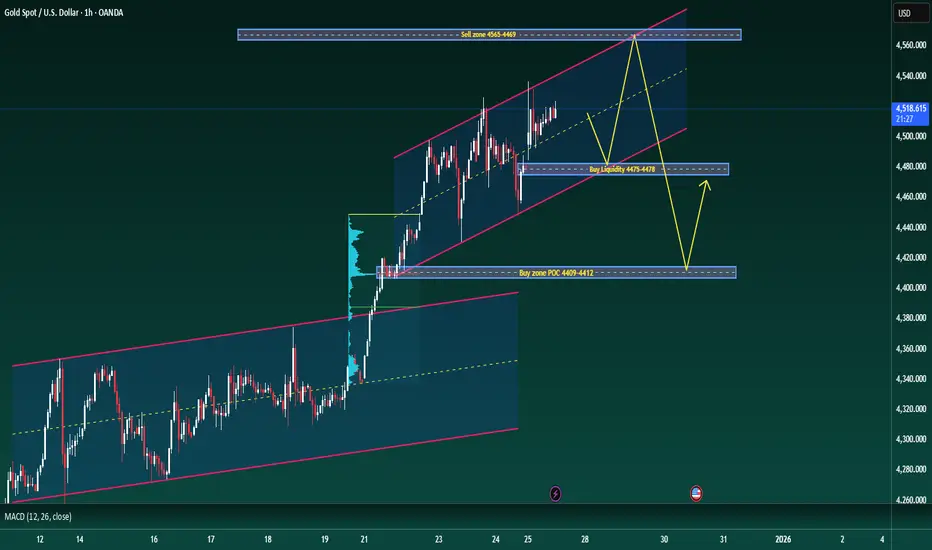
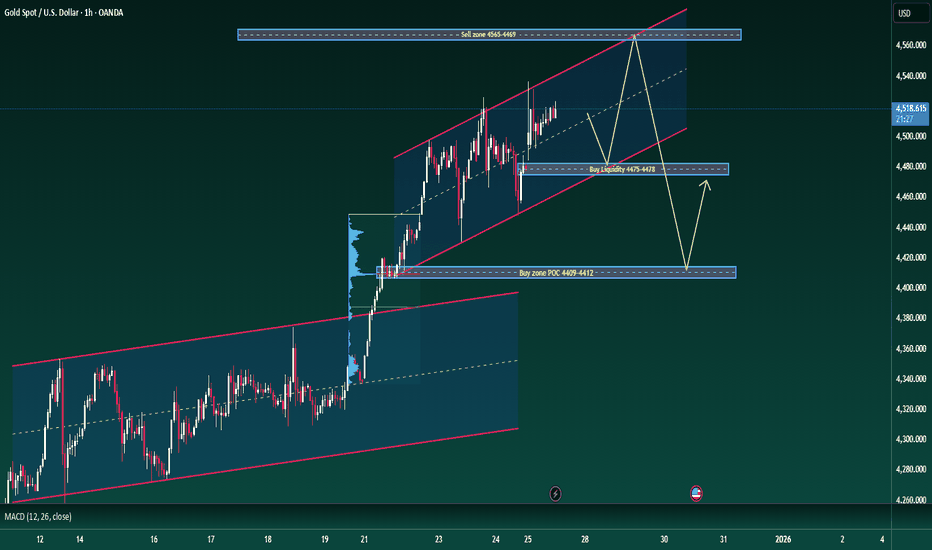
XAUUSD H1 – Trading Liquidity During the Year-End SessionXAUUSD H1 – Trading Liquidity During the Year-End Session
Gold remains in a bullish structure, but this is a holiday market with weaker liquidity as many banks are closed. The best approach here is to trade around liquidity and value areas, rather than chasing price during extended moves.
TECHNICAL OVERVIEW
On H1, price continues to respect an ascending channel, moving through expansion and pullback phases.
After the latest strong push, the market is now consolidating and rotating, which typ
Part 1 Support and Resistance What Are Options?
Options are derivative contracts—their value is derived from an underlying asset such as a stock, index, commodity, or currency.
Each option gives the buyer a right, but not an obligation, to buy or sell the underlying asset at a specific price (called the strike price) on or before a specific date (called the expiry date).
There are two types of options:
Call Options – Gives the right to buy the asset.
Put Options – Gives the right to sell the asset.
You pay a fee to pur
XAUUSD (H1) – Trading BUY Liquidity Stay bullish with the rising channel, buy the pullback into liquidity
Quick view
Gold is still moving inside a rising channel. After the strong impulsive push, price is now consolidating / compressing. For today, I’m prioritising BUY setups at liquidity + trendline retests, while keeping a reaction SELL plan at the premium Fibonacci zone above.
Macro context (why volatility can stay elevated)
Trump signing a record number of executive orders and the growing shift of power towards the executi
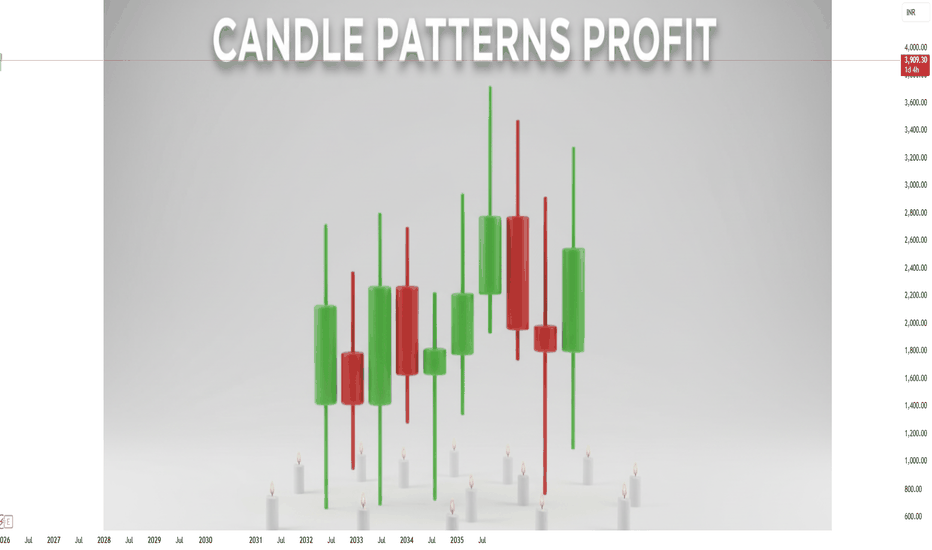
Candle Patterns ExplainedBasics of Candlesticks
A standard candlestick contains:
Body: Difference between open and close
Wicks/Shadows: High and low
Color: Bullish (often green/white) or bearish (red/black)
The structure itself provides signals:
Long bodies → strong momentum
Small bodies → indecision
Long wicks → rejection or strong counterforce
No wick → full control by one side
Understanding this foundation helps interpret every pattern that follows.
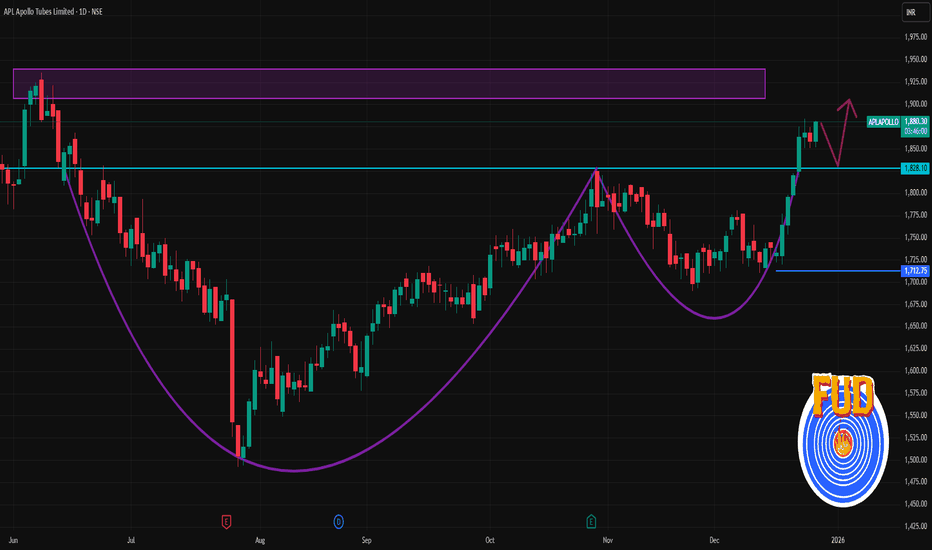
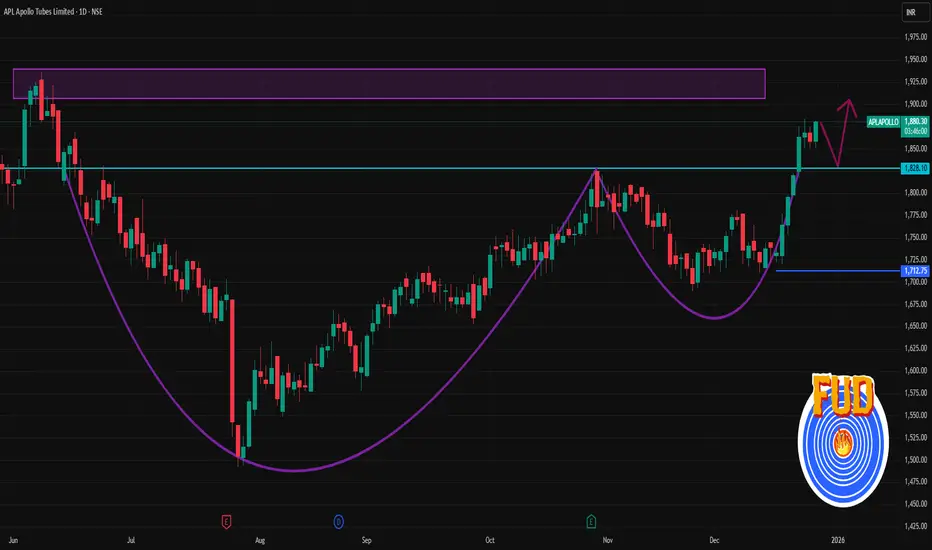
APLAPOLLO 1 Day Time Frame 🔹 Recent Price Context (Indicative)
The stock is trading around ~₹1,850‑₹1,880 levels (recent session range) with a 52‑week high near ₹1,936 and low near ₹1,273.
📊 Intraday / 1‑Day Key Levels (Support & Resistance)
📈 Resistance Levels
These can act as intraday ceilings where price may stall or reverse:
R1: ~₹1,871‑₹1,875 area
R2: ~₹1,885‑₹1,900
R3: ~₹1,895‑₹1,915
(based on pivot analysis around recent highs/multiple technical sources)
📉 Support Levels
These are levels where price might find
Chart Patterns: Deep, Easy & Practical GuideWhy Chart Patterns Matter
Every candle represents a war:
Buyers want price higher, sellers want price lower.
When multiple candles form repeated structures — triangles, flags, W-shaped patterns — it signals:
Market exhaustion
Momentum imbalance
Consolidation before expansion
Liquidity grabs
Trend reversals
Institutions often place orders at predictable zones:
Break of structure (BOS)
Lower highs / higher lows
Double tops / bottoms
Range highs and lows
Chart patterns help us read the
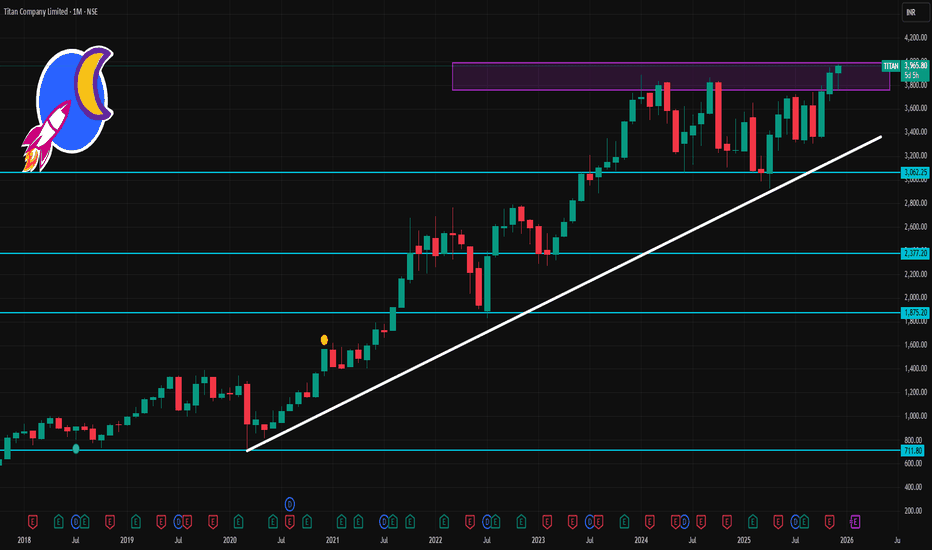
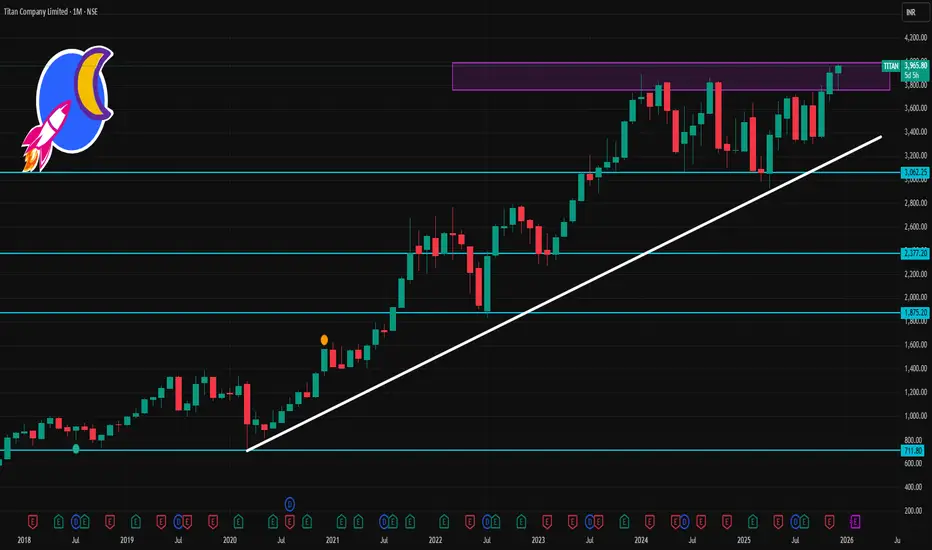
TITAN 1 Month Time Frame 📈 Current Price Context (as of latest market data)
• Titan is trading around ₹3,900‑₹3,925 and recently hit a 52‑week high of ~₹3,962.
• Over the past 1 month, the stock has shown a small positive return (~+0.9% according to Business Today data).
📊 1‑Month Time Frame Key Levels
🔥 Resistance Levels (Potential upside ceilings)
• R1: ~₹3,929–₹3,930
• R2: ~₹3,949–₹3,950
• R3/52W High: ~₹3,962–₹3,964 → a key breakout zone above which the next leg up may begin.
🔻 Support Levels (Potential downside
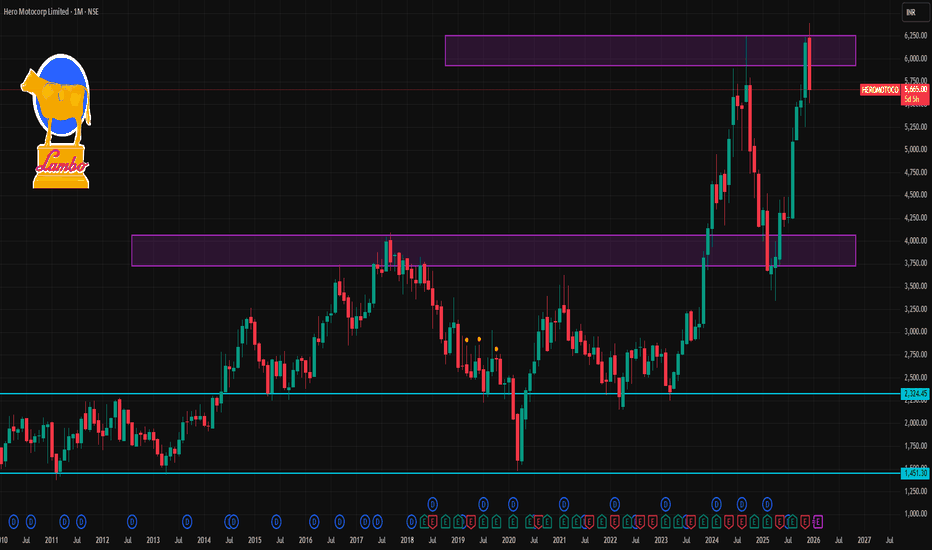
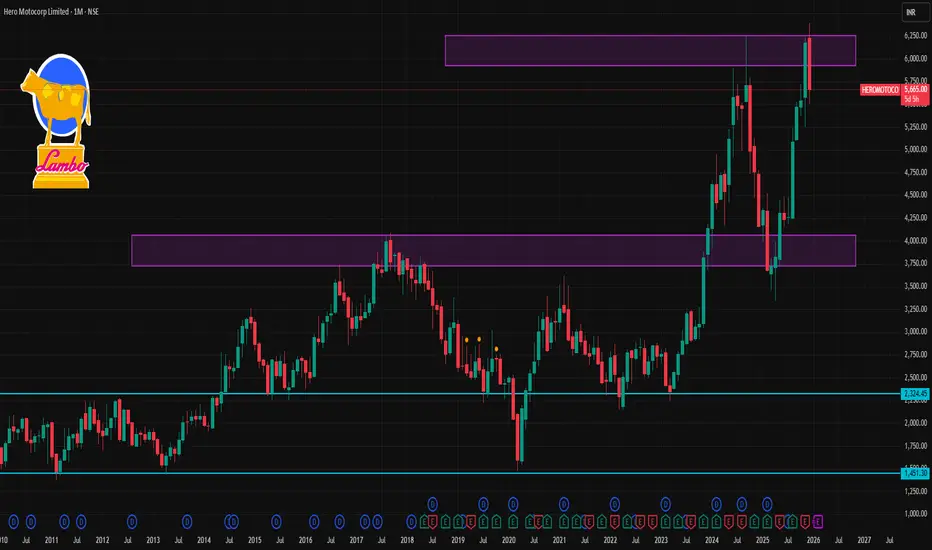
HEROMOTOCO 1 Month Time Frame 📊 Key Levels for 1‑Month Time Frame
Pivot & Resistance Levels (near current price)
✔ Pivot: ~₹5,767–₹5,775
✔ R1: ₹5,810–₹5,815
✔ R2: ₹5,840–₹5,843
✔ R3: ₹5,880–₹5,885
(Source: Pivot/S3‑R3 data)
Support Levels
✔ S1: ~₹5,738–₹5,740
✔ S2: ~₹5,695–₹5,700
✔ S3: ~₹5,665–₹5,670
(Source: Pivot/S3‑R3 data)
🔍 Interpretation (1‑Month)
Resistance zones:
📈 ₹5,810–₹5,840 — first meaningful upside hurdle; break above this may open path toward ₹5,880+.
📈 Above ~₹5,880 could signal stronger bullish momentum
Option Trading vs. Stock TradingUnderstanding Stock Trading
Stock trading involves buying and selling shares of publicly listed companies. When an investor buys a stock, they gain partial ownership in the company along with associated rights such as voting and dividends (if declared). Stock trading can be done for short-term gains (intraday, swing trading) or long-term wealth creation (investing).
The primary driver of stock prices is the company’s fundamentals—earnings, growth prospects, management quality, and industry tre
Blackbuck cmp 670.70 by Daily Chart viewBlackbuck cmp 670.70 by Daily Chart view
- Support Zone 625 to 643 Price Band
- Resistance Zone 670 to 694 Price Band
- Volumes in good sync with avg traded quantity
- Falling Resistance Trendline Breakout seem attempted
- Both of the Rising Support Trendline are well respected
- Bullish Rounding Bottoms under Resistance Zone neckline
Part 12 Trading Master ClassHow Option Premium Is Calculated
Premium = Intrinsic Value + Time Value
Intrinsic Value (IV)
Value if the option were exercised today.
Example: Nifty at 22,000.
Call 21,800 intrinsic value = 22,000 – 21,800 = ₹200
Time Value
Extra cushion based on days left and expectations.
Near expiry, time value evaporates fastest.
Part 11 Trading Master Class Best Practices for Option Traders
To trade options effectively, follow these disciplined rules:
Focus on market structure and volume profile before entering trades.
Avoid buying options during low volatility periods.
Always hedge when selling options.
Trade liquid strikes—prefer ATM or near OTM.
Avoid holding OTM options on expiry day.
Use stop loss and position sizing.
Track Greeks, especially Theta and Delta.
Avoid revenge trades; options can wipe capital fast.
BUY TODAY SELL TOMORROW for 5%DON’T HAVE TIME TO MANAGE YOUR TRADES?
- Take BTST trades at 3:25 pm every day
- Try to exit by taking 4-7% profit of each trade
- SL can also be maintained as closing below the low of the breakout candle
Now, why do I prefer BTST over swing trades? The primary reason is that I have observed that 90% of the stocks give most of the movement in just 1-2 days and the rest of the time they either consolidate or fall
Trendline Breakout in BSOFT
BUY TODAY SELL TOMORROW for 5%
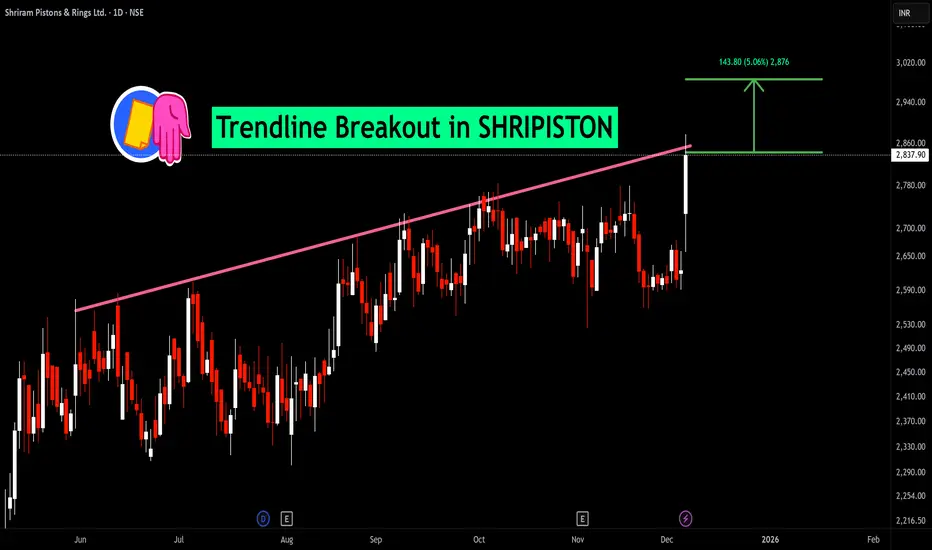
BUY TODAY SELL TOMORROW for 5%DON’T HAVE TIME TO MANAGE YOUR TRADES?
- Take BTST trades at 3:25 pm every day
- Try to exit by taking 4-7% profit of each trade
- SL can also be maintained as closing below the low of the breakout candle
Now, why do I prefer BTST over swing trades? The primary reason is that I have observed that 90% of the stocks give most of the movement in just 1-2 days and the rest of the time they either consolidate or fall
Trendline Breakout in SHRIPISTON
BUY TODAY SELL TOMORROW for 5%
Part 10 Trade Like Institutions Risks in Option Trading
Options involve advanced risks:
a) Unlimited Loss for Sellers
If market moves violently, sellers face huge loss without protection.
b) High Volatility Risk
IV crush can destroy premiums instantly after news events.
c) Liquidity Risk
Low volumes lead to large bid-ask spreads.
d) Emotional Trading
Options move very fast, causing fear and overtrading.
Part 9 Trading Master Classa) Strike Price
The predetermined price at which you can buy (call) or sell (put) the asset.
b) Premium
The cost of the option. Determined by volatility, time left, and price difference from the strike.
c) Expiry Date
Options lose value over time. Closer to expiry = faster time decay.
d) Lot Size
Options are traded in fixed quantities. You cannot buy 1 unit like stocks.
e) In-the-Money (ITM), At-the-Money (ATM), Out-of-the-Money (OTM)
These terms describe how close the underlying price
Part 8 Trading Master ClassWhat Are Options?
Options are financial contracts that give the buyer the right, but not the obligation, to buy or sell an underlying asset (like stocks, indices, commodities) at a specific price within a specific time period.
There are two basic types:
Call Option – Gives the right to buy an asset at a fixed price.
Put Option – Gives the right to sell an asset at a fixed price.
Options always involve a buyer and a seller (writer).
Buyers pay a premium to purchase the option.
Sellers rece
CANDLESTICK PATTERNS Candlestick charts originated in Japan in the 1700s. They capture four pieces of information for each time unit (1 min, 5 min, 1 hour, 1 day):
Open, High, Low, Close (OHLC).
Each candle tells a story of buying and selling pressure. Repeating stories form patterns.
We will cover:
1. Single-Candle Patterns
2. Double-Candle Patterns
3. Triple-Candle Patterns
How Candlestick Patterns Work with Market Psychology
Candlestick patterns reflect sentiment:
Long wicks → rejection
Full body → momentum
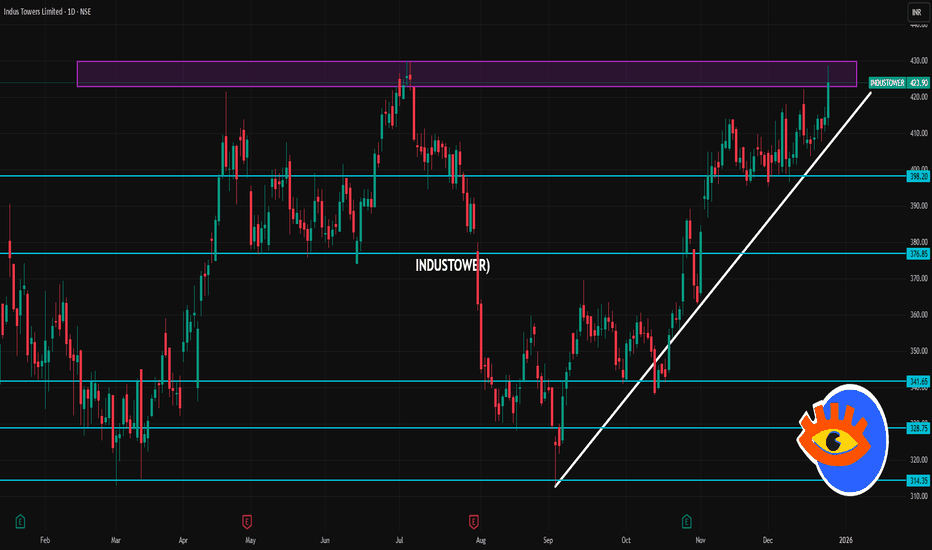
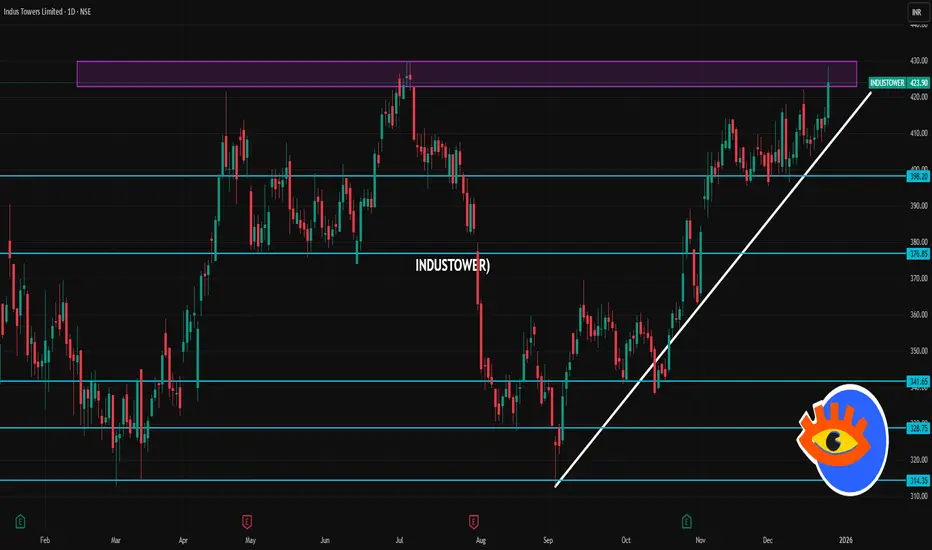
INDUSTOWER 1 Day Time Frame 📌 Current Price (NSE): ~₹423.9 – ₹424 area intraday.
📊 Today’s Price Range:
High: ~₹428.50
Low: ~₹412.00
📈 Key Daily Levels (Support & Resistance)
🔹 Intraday & Pivot Levels
Central Pivot (CPR): ~₹421.5 – ₹422.7 (important sentiment zone)
🟢 Resistance Levels
R1: ~₹430 – immediate resistance near recent high.
R2: ~₹437 – next supply zone on daily pivots.
R3: ~₹447 + (higher extension / breakout target).
🔴 Support Levels
S1: ~₹415 – first immediate support.
S2: ~₹411 – below recent intraday
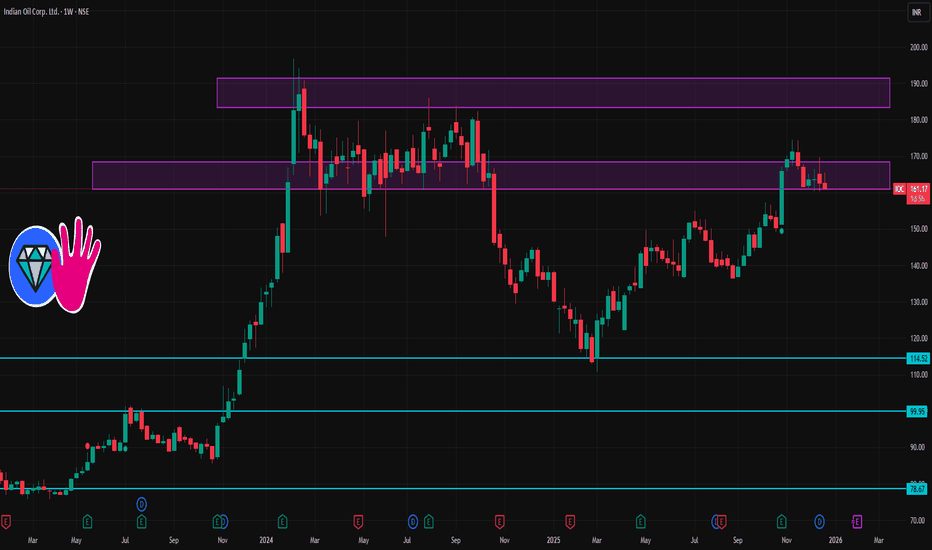
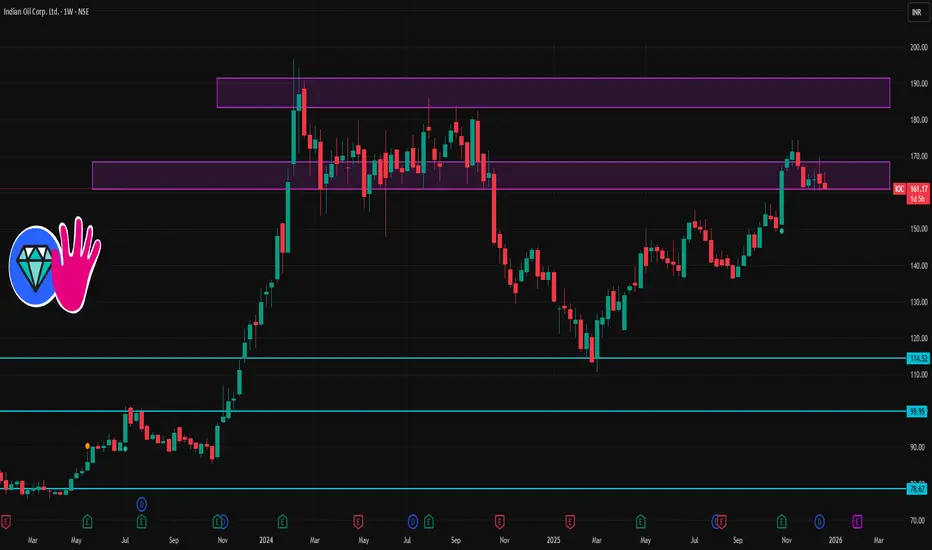
IOC 1 Week Time Frame 📊 Current Price (approx):
IOC trading around ₹161–₹163 on NSE/BSE recently.
📈 Weekly Resistance Levels
These are key upside levels where selling pressure may emerge this week:
1. Major Weekly Resistance Zones
R1: ~₹164–₹165
R2: ~₹167–₹168
R3: ~₹172–₹173
Why these matter:
• Above ₹164–₹165, bulls may gain control and momentum could push toward ₹168+.
• Levels above ₹170 would be significant weekly breakout territory.
📉 Weekly Support Levels
Key downside levels where buyers might step in:
1.
Essential Infrastructure Investments: Foundation for SustainableIntroduction
Essential infrastructure investments form the backbone of economic development, social well-being, and long-term national competitiveness. Infrastructure is not limited to roads and bridges; it includes power systems, water supply, digital networks, transport corridors, healthcare facilities, and urban services that enable societies and economies to function efficiently. In an era of rapid urbanization, climate change, technological disruption, and rising population demands—especia
Production Linked Incentive (PLI) Scheme WinnersHow India’s Production Linked Incentive Is Creating Global Champions
India’s Production Linked Incentive (PLI) Scheme is one of the most ambitious industrial policy initiatives undertaken by the country in recent decades. Launched with the objective of boosting domestic manufacturing, reducing import dependence, and positioning India as a global production hub, the PLI scheme rewards companies with financial incentives tied directly to incremental production and sales. Since its rollout across
Part 7 Trading Master Class1. Start with Buying Options
Risk is limited → good for beginners.
2. Learn Greeks
Greeks are the foundation of professional trading.
3. Use Spreads
Spreads reduce cost and risk.
4. Avoid Trading Near Expiry Initially
Premium decay is extremely fast.
5. Always Keep Stop-Loss
Especially for sellers.
6. Track IV (Implied Volatility)
Decide if an option is overpriced or underpriced.
7. Focus on Liquid Indices
NIFTY, BANKNIFTY, FINNIFTY have tight spreads.
UEducation