Candle Pattern What Are Candlestick Patterns?
Candlestick patterns originate from Japanese rice traders and represent the open, high, low, and close of price. They are especially useful for identifying short-term reversals, continuations, and market indecision.
Common Mistakes Traders Make
Trading patterns without confirmation
Ignoring higher timeframes
Overtrading every pattern
Forgetting risk management
Ignoring market context and trend
Patterns work best when aligned with:
Trend direction
Support
Trend Line Break
Small Account ChallengesNavigating the Market with Limited Capital
Trading or investing with a small account is one of the most demanding yet most common starting points for market participants. Whether in stocks, forex, commodities, or crypto, a small account magnifies every decision, emotion, and mistake. While the markets offer equal access to everyone, the reality is that account size significantly influences strategy, psychology, risk management, and growth potential. Understanding the challenges of a small accou
Mid-Cap TradingUnlocking Multi-Bagger Moves Through Strategy, Patience, and Discipline
Mid-cap trading has long been regarded as the sweet spot for investors and traders seeking multi-bagger returns—stocks that can grow two, three, five, or even ten times over a period of time. Positioned between large, stable blue-chip companies and highly volatile small-cap stocks, mid-cap companies offer a unique balance of growth potential and relative stability. When approached with the right framework, mid-cap trading c
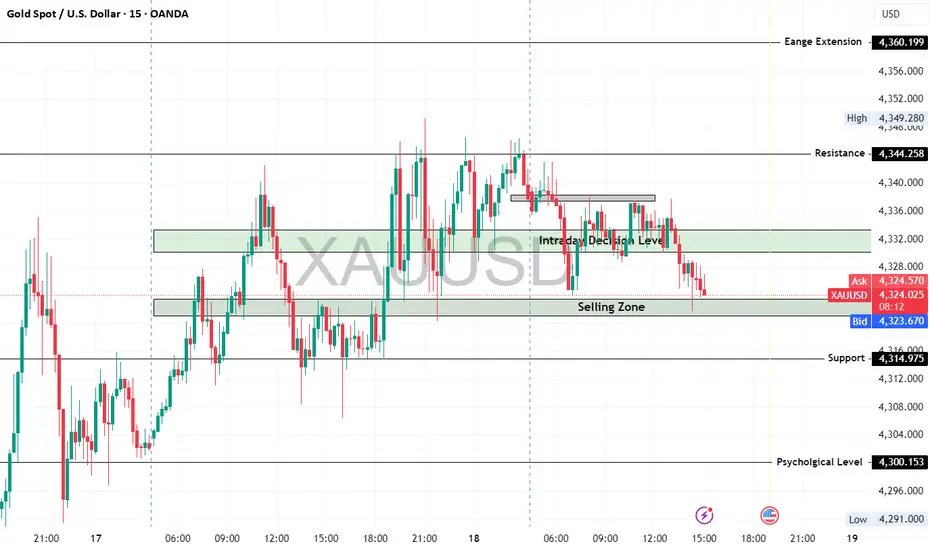
XAUUSD (Gold) Technical Outlook - 18/12/2025📊 XAU/USD Quick Outlook
Gold is trading near 4,326, showing short-term weakness, but the overall trend is still bullish on higher timeframes.
🔑 Key Levels
• Support: 4,320 – 4,300
• Resistance: 4,335 – 4,345
🟢 Bullish: Above 4,320 → targets 4,345 → 4,370+
🔴 Bearish: Below 4,320 → targets 4,300 → 4,260
📌 Intraday Tip:
Sell near resistance, buy near support only after confirmation.
⚠️ Expect volatility during USD news.
⚠️ Disclaimer: This analysis is for educational purposes only. Markets ar
Part 1 Support and Resistance How Option Trading Profits Work
There are two major types of option contracts:
Call Options: Profit when asset prices rise.
Put Options: Profit when asset prices fall.
When you buy an option, you pay a premium. This premium is the cost of entering the trade. When the market moves in your favor, the value of the option increases, enabling you to sell it for more than you paid, or exercise it at a favorable price.
The core idea:
If the market moves toward your expectation, you profit.
If th
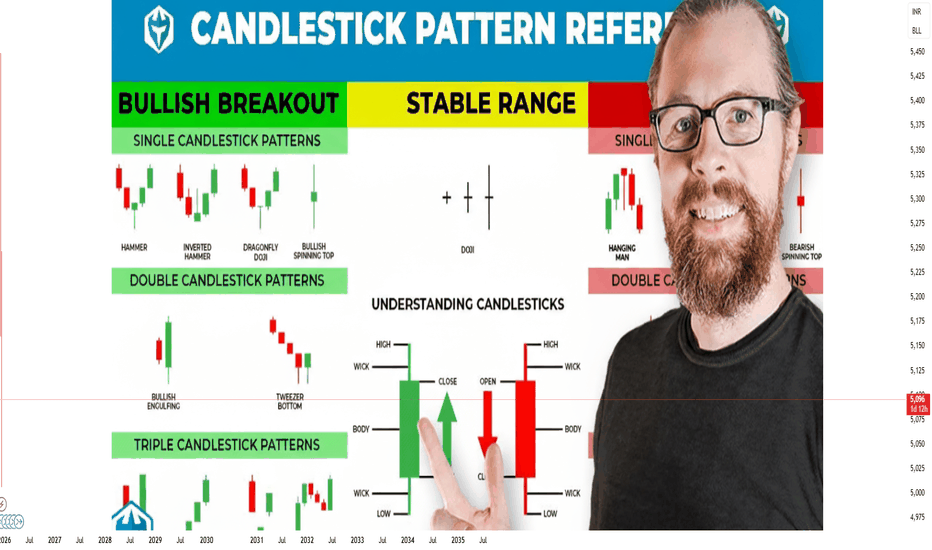
Best Knowledge of Candle Patterns CANDLESTICK PATTERNS
Candlestick patterns show price action for a specific time period using:
open
high
low
close
They reveal emotions on a smaller scale than chart patterns—short-term sentiment, reversals, or continuation signals.
Candles combine psychology with real-time supply-demand shifts.
Part 8 Trading Master Class Option Pricing and the Role of Greeks
Option prices are influenced by multiple factors, not just price direction. These influences are measured by Option Greeks:
Delta – Measures how much the option price changes for a 1-point move in the underlying
Gamma – Measures the rate of change of delta
Theta – Measures time decay; options lose value as expiry approaches
Vega – Measures sensitivity to changes in volatility
Rho – Measures impact of interest rate changes
Understanding Greeks helps tr
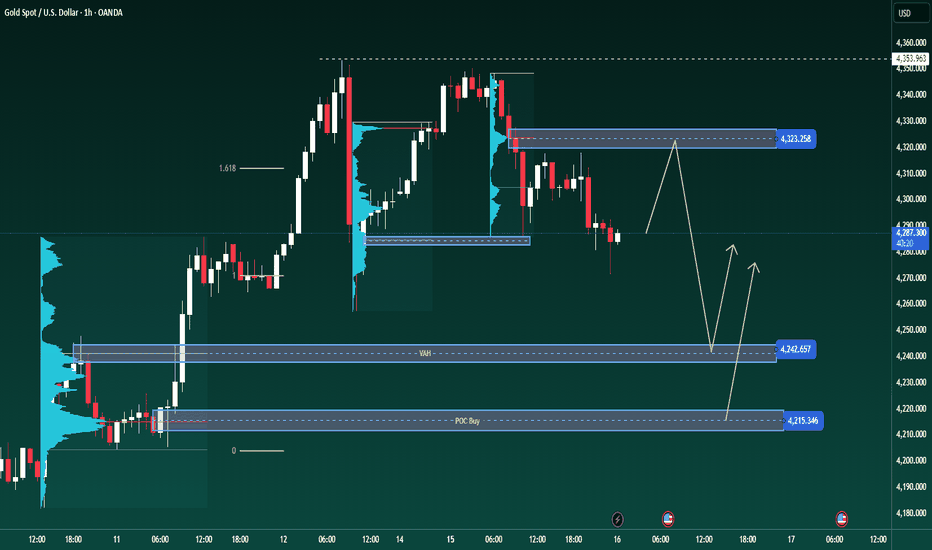
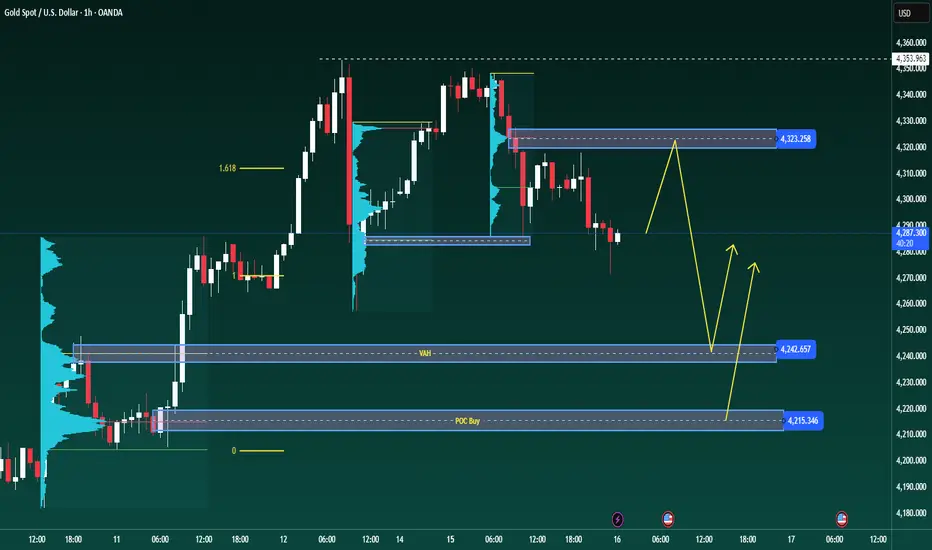
XAUUSD H1 Analysis Before Key NewsXAUUSD H1 Analysis Before Key News
During the Asian-European session, gold is likely to move sideways awaiting news as the market enters a sensitive phase with data and political factors, amidst a clearly formed short-term downtrend structure.
PRIORITY SCENARIO
Trading strategy according to the current structure, prioritizing short-term sell and buy at lower liquidity zones.
Main sell zone: around 4323, coinciding with the POC of the Volume Profile.
Technical context: price is moving below
Part 4 Learn Institutional Trading What Is Option Trading?
An option is a financial derivative whose value is derived from an underlying asset such as a stock, index, commodity, or currency. Option trading involves buying or selling contracts that give the holder the right, but not the obligation, to buy or sell the underlying asset at a predetermined price within a specified time period.
Each option contract has key elements:
Underlying asset – Stock, index (NIFTY, BANKNIFTY), commodity, etc.
Strike price – The price at whic
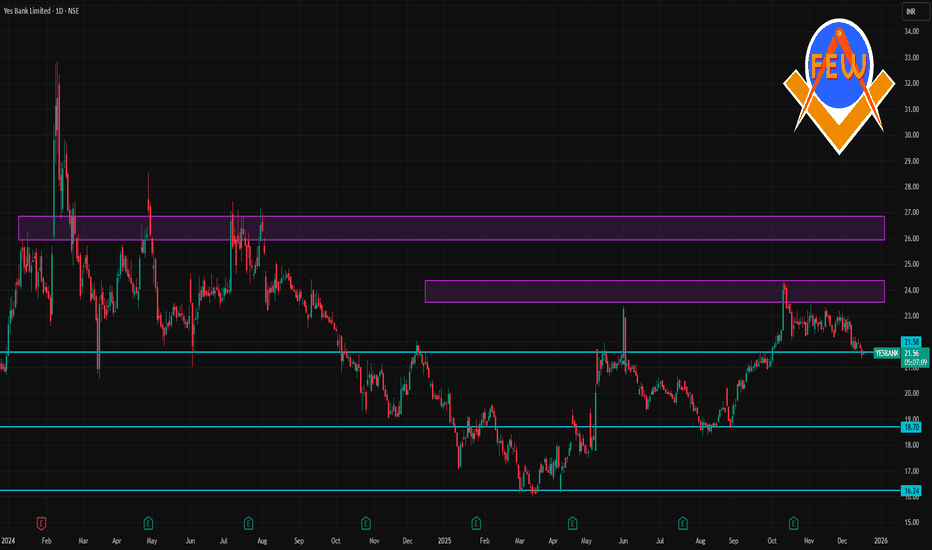
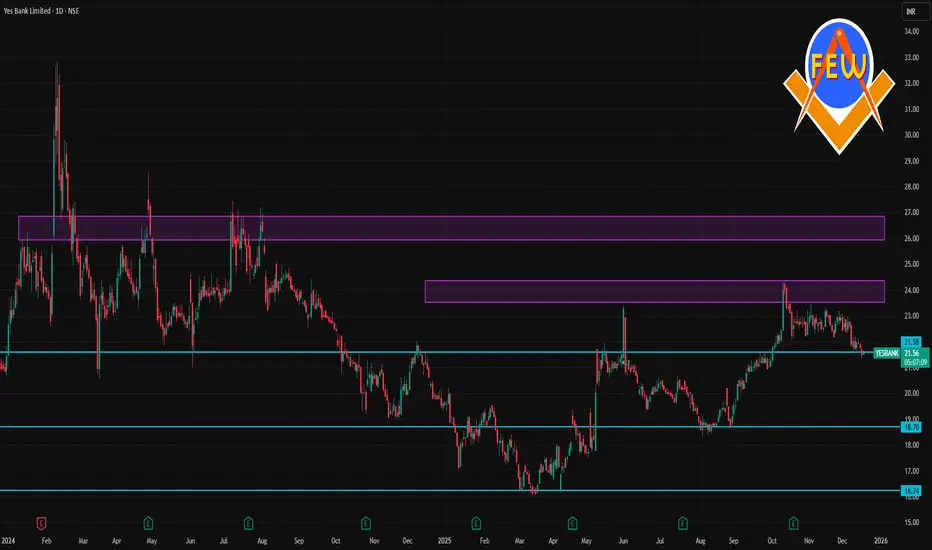
YESBANK 1 Day Time Frame 📊 Daily Time Frame Levels (1 D)
Current approximate price: ~₹21.7–₹22.7 (varies by source)
🔹 Pivot & Daily Reference Level
Daily pivot (Classic): ~ ₹22.58–₹22.60
🧱 Resistance Levels
Immediate resistance: ~ ₹24.00–₹24.03 (1st major upside barrier)
Above that, psychologically significant levels are near recent 52-week highs around ₹24.30
📉 Support Levels
Short-term support: ~ ₹22.22
Medium/stronger support: ~ ₹20.97
Lower support zones (broader view): ~ ₹19.17–₹18.50 (from broader multi-per
Trade Crypto Like a ProA Complete Guide to Mastering Cryptocurrency Markets
Trading cryptocurrency like a professional is not about luck, hype, or chasing the next trending coin. It is a disciplined process that combines market knowledge, technical skills, risk management, psychology, and continuous learning. The crypto market operates 24/7, is highly volatile, and reacts instantly to global news, making it both an opportunity-rich and risk-heavy environment. Professional crypto traders approach this market with stru
Part 3 Learn Institutional Trading Spread Strategies (Risk-Defined Trades)
Spread strategies reduce risk by combining buy and sell options.
Bull Call Spread
Concept: Buy lower strike call + Sell higher strike call.
Profit: Limited
Risk: Limited
Best Market Condition: Moderate uptrend
Benefit:
Lower cost than buying a naked call.
Part 2 Intraday Trading Master ClassNon-Directional (Range-Bound) Strategies
These strategies profit when the market does not move much.
Short Straddle Strategy
Concept: Sell Call + Sell Put at same strike.
Profit: Premium received
Risk: Unlimited
Best Market Condition: Low volatility, sideways market
Use Case:
When expecting very low movement, typically before event expiry.
Warning:
High-risk strategy, requires strict risk management.
Positional Trading vs. Swing Trading in the Indian MarketUnderstanding Positional Trading
Positional trading is a medium- to long-term trading style where traders hold positions for several weeks to a few months. The goal is to benefit from a larger directional move driven by strong trends, fundamental changes, or long-term technical breakouts.
In the Indian market, positional traders often focus on:
Strong sectoral themes (banking, IT, pharma, PSU, metals)
Macroeconomic trends (interest rates, inflation, GDP growth)
Company fundamentals (earning
Option Trading Strategies Directional Option Trading Strategies
Directional strategies are used when the trader has a clear bullish or bearish view on the underlying asset.
Long Call Strategy (Bullish)
Concept: Buy a call option expecting the price to rise.
Maximum Loss: Premium paid
Maximum Profit: Unlimited
Best Market Condition: Strong uptrend
Use Case:
When you expect sharp upside movement with high momentum.
Risk:
If price does not move fast enough, time decay erodes option value.
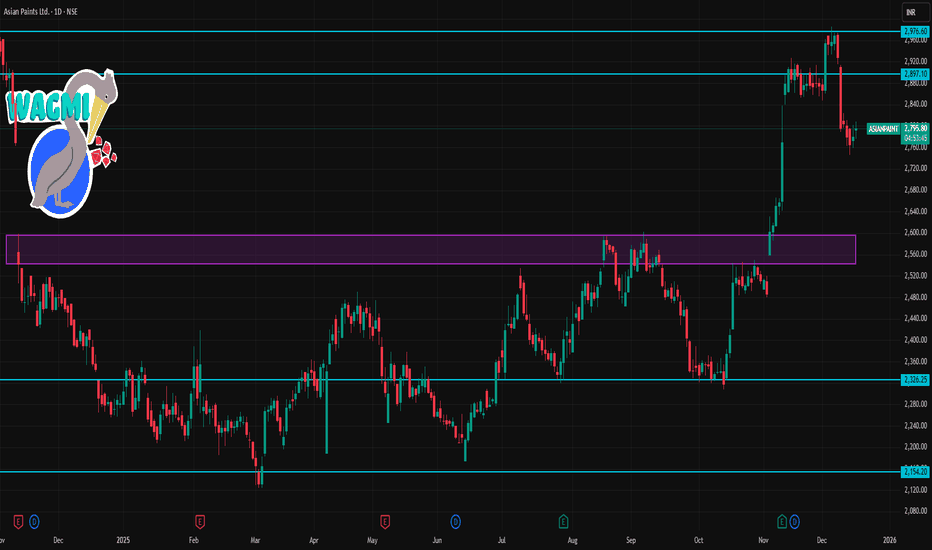
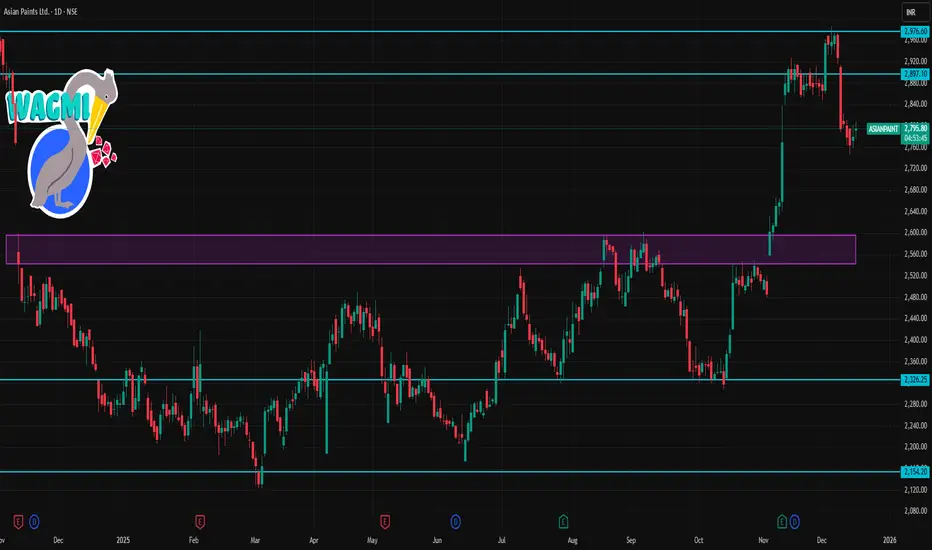
ASIANPAINT 1 Day Time Frame 📊 Current Trading Context (latest session data)
The stock today has traded between ₹2,746 and ₹2,797.
Latest price around ₹2,780–₹2,788 (price fluctuating intraday).
📈 Intraday Technical Levels (Daily Pivot-Style)
Resistance Levels (Upside):
R1: ₹2,792 – ₹2,793
R2: ₹2,820 – ₹2,821
R3: ₹2,844 – ₹2,846
(These are key zones where upside can stall)
Support Levels (Downside):
S1: ₹2,741 – ₹2,742
S2: ₹2,718 – ₹2,720
S3: ₹2,690 – ₹2,692
(These are key zones where price might find a floor)
📌
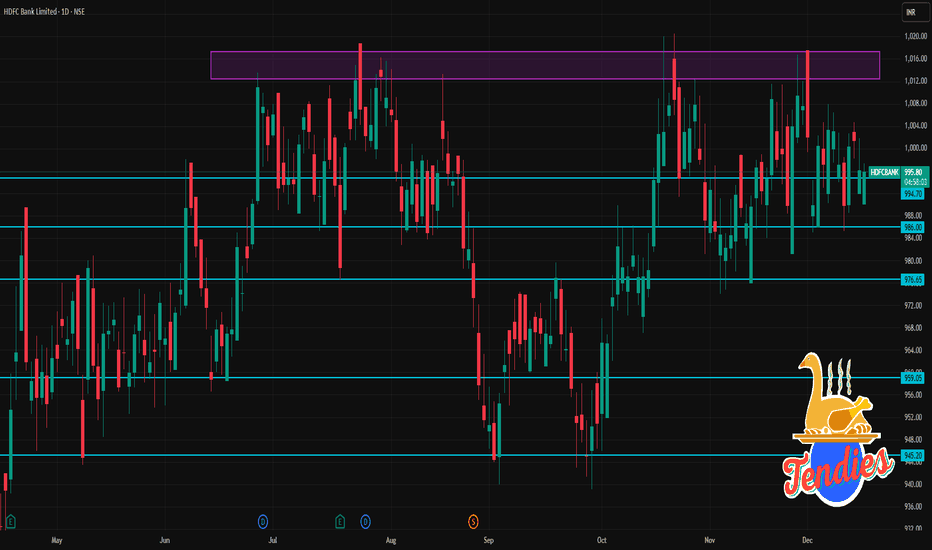
HDFCBANK 1 Day Time Frame 📌 Current Price Snapshot (recent data)
Approx. current price: ~₹995–₹1,002 on NSE intraday trading.
Day range seen recently: ~₹992–₹1,004.
📊 Daily Pivot / Support & Resistance Levels
🧮 Daily Pivot:
Pivot Point (PP): ~₹997-₹1,001
📈 Resistance Levels
R1: ~₹1,004-₹1,006
R2: ~₹1,007-₹1,011
R3: ~₹1,011-₹1,020 (stronger resistance near 1,020)
📉 Support Levels
S1: ~₹998-₹992
S2: ~₹994-₹986
S3: ~₹982-₹977
🧠 What This Means Now
The stock is currently trading ne
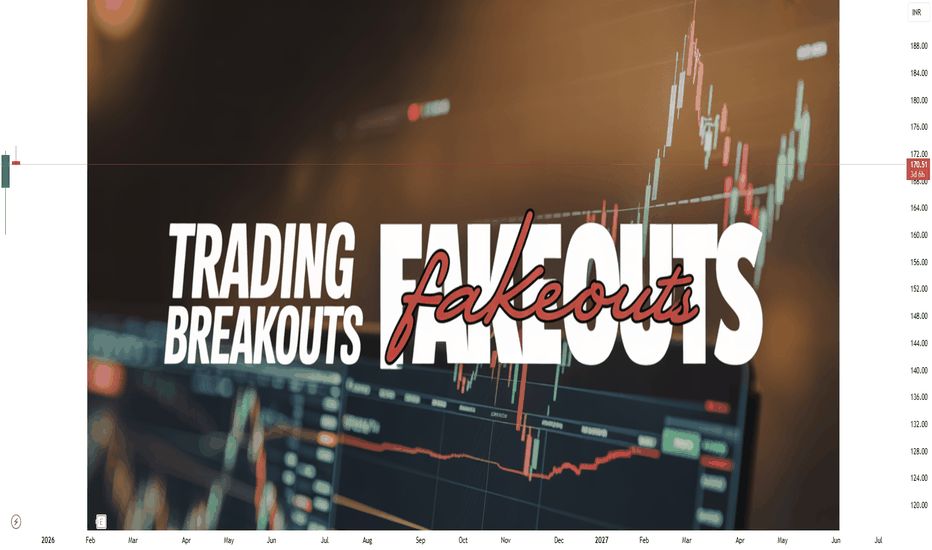
Trading Breakouts and Fakeouts How to Identify Real Opportunities and Avoid Traps
Trading breakouts and fakeouts is one of the most popular yet challenging approaches in the financial markets. Traders across equities, commodities, forex, and derivatives closely watch key price levels where the market is expected to make a decisive move. While breakouts can lead to strong, profitable trends, fakeouts often result in losses and emotional frustration. Understanding the difference between the two, and learning how to trade them
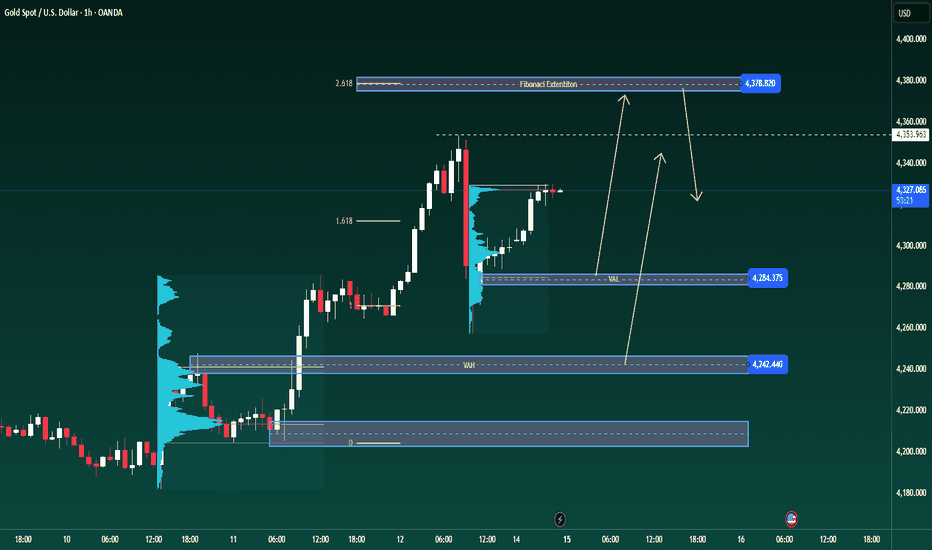
XAUUSD H1 Analysis Based on Volume ProfileXAUUSD H1 Analysis Based on Volume Profile
Gold is moving sideways and consolidating around the 4,300 USD/oz area. The short-term direction remains unconfirmed and requires clear reactions at key liquidity zones.
PRIORITY SCENARIO – MAIN SCENARIO
Medium-term trend-following buy strategy at price areas with Volume Profile advantage
Primary buy zone: around 4284 based on VAL
Technical context: this is the lower value area where buying interest is likely to appear as the market continues to co
Part 2 Support and Resistance Option Premium
The option premium is the price paid by the buyer to the seller (writer) of the option.
Premium consists of:
Intrinsic Value – Real value if exercised now
Time Value – Value based on time remaining until expiry
As expiry approaches, time value decreases, a phenomenon known as time decay (Theta).
Part 1 Support and Resistance Put Option Explained
A Put Option gives the buyer the right to sell the underlying asset at a fixed price before or on expiry.
Example:
If NIFTY is trading at 22,000 and you buy a 21,800 Put Option, you expect the market to move down.
If NIFTY falls to 21,500 → You profit
If NIFTY stays above 21,800 → Option may expire worthless
Maximum loss = Premium paid
Profit potential = High but limited
Put options are used when traders are bearish or want to protect their portfolio from downside ri
Part 7 Trading Master ClassIntermediate Strategies
1. Bull Call Spread
Buying a call at a lower strike and selling another at a higher strike. This reduces cost but limits maximum profit.
2. Bear Put Spread
Buying a higher strike put and selling a lower strike put. It profits from moderate downside movement with controlled risk.
3. Straddle
Buying a call and a put at the same strike and expiry. This strategy profits from high volatility regardless of direction.
4. Strangle
Similar to a straddle but uses different stri