Brian – Gold Money Flow Map for the US Session TodayBrian – Gold Money Flow Map for the US Session Today
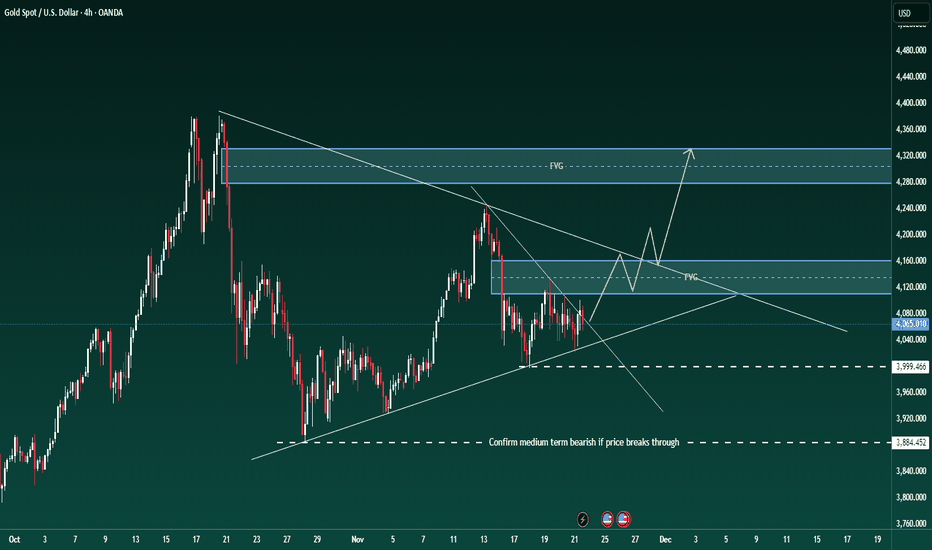
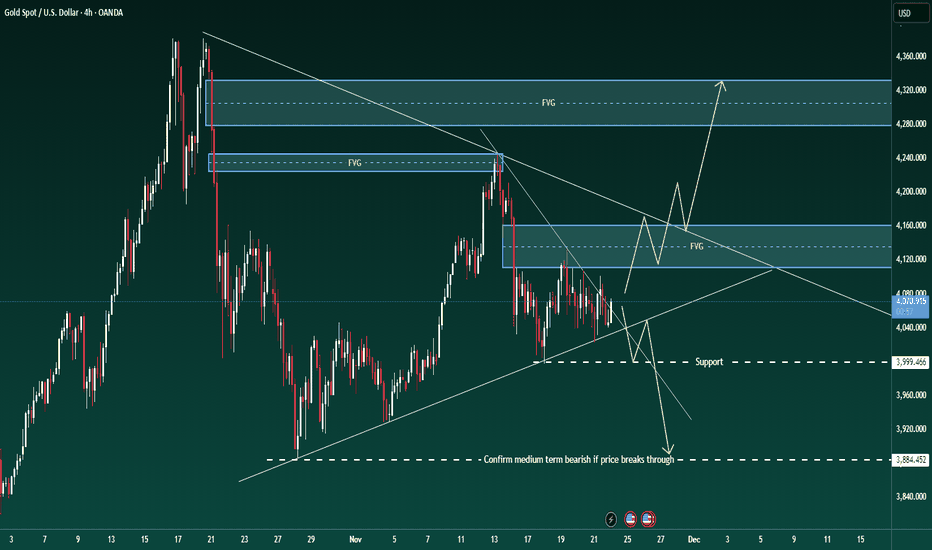
Technical analysis – trendline, FVG, and two clear scenarios
On H4, gold is still maintaining a medium-term uptrend line drawn from the end of October. The decline in the Asian session this morning was not strong enough to break the structure; the price touched the trendline and then bounced up, indicating that the sellers have not yet "crushed" this support area.
Current structure: The price is accumulating around the 4,050–4,080 area in a
Trend Line Break
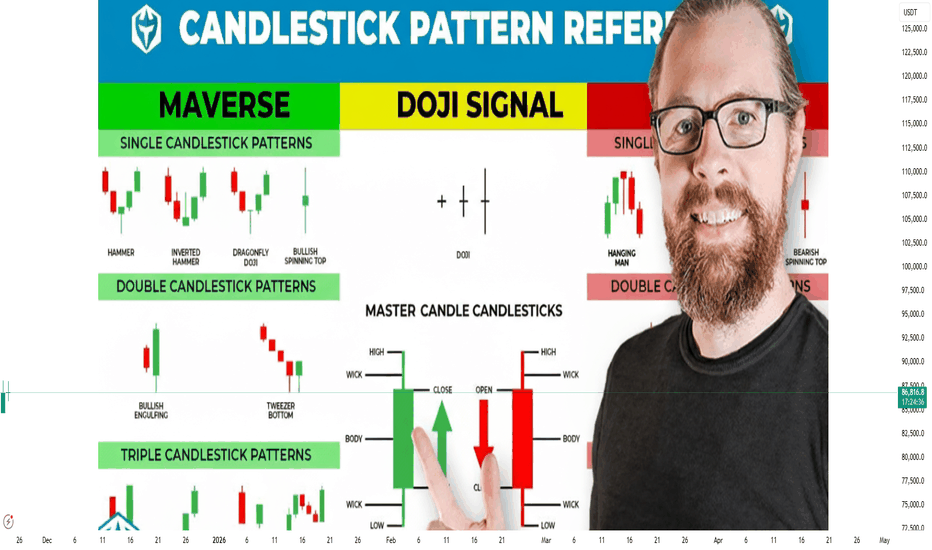
Part 1 Introduction to Candlestick PatternsThe Greeks: Heart of Option Trading
The Greeks measure how options change with market conditions.
1. Delta
Measures how much the premium moves compared to the underlying.
Call delta = +ve
Put delta = –ve
2. Theta
Measures time decay.
Always negative for buyers
Positive for sellers
3. Vega
Measures sensitivity to volatility.
High volatility = expensive options.
4. Gamma
Shows how Delta changes.
High Gamma = fast premium movement.
Part 12 Trading Master ClassOption Premium and Its Components
The premium is the price you pay to buy an option. Premium has two parts:
A. Intrinsic Value
The real value of the option.
Example:
If Nifty is at 22,000 and you have a Call option of 21,800
Intrinsic value = 22,000 – 21,800 = 200 points
B. Time Value
The extra value due to remaining time to expiry.
As expiry nears, time value decays, and premium falls. This is called Theta Decay.
Part 11 Trading Master Class Why Options Are Popular
Option trading has exploded in popularity due to several advantages:
✔ Lower Capital
You can control a large position with a small premium.
✔ Limited Risk (For Buyers)
You can’t lose more than the premium you paid.
✔ High Reward Potential
Options magnify gains during strong market moves.
✔ Flexibility
You can create strategies for:
bullish markets
bearish markets
range-bound markets
highly volatile markets
extremely calm markets
Part 9 Trading Master Class With Experts What Are Options?
Options are derivative contracts, meaning their value is derived from an underlying asset—most commonly stocks, indices (like Nifty or Bank Nifty), commodities, or currencies.
Every option has two key components:
Strike Price – The agreed price at which the trader can buy or sell the underlying asset.
Expiry Date – The date on which the option contract ends.
Options are of two types:
• Call Option (CE)
A call option gives the buyer the right, but not the obligation, to b
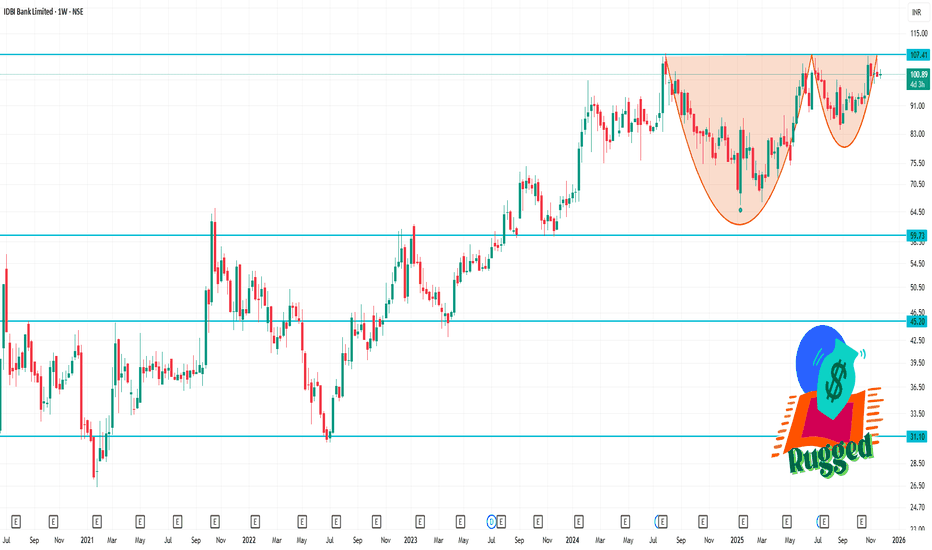
IDBI 1 Week TIme Frame ✅ Key Levels
Support zone: ~ ₹99.30 and ~ ₹98.35.
Pivot / neutral price: ~ ₹100.94.
Resistance zone: ~ ₹101.89 and then ~ ₹103.53-₹104.48.
🎯 Watch-for This Week
A break above ~₹101.90 could unlock upside toward ~₹103.50/₹104.50.
A break below ~₹98.35 would signal increased weakness and could target support further down (~₹97 or lower) as per some longer-term charts.
Until one of these pivot points is decisively broken, expect the price to oscillate between ~₹99 and ~₹102.
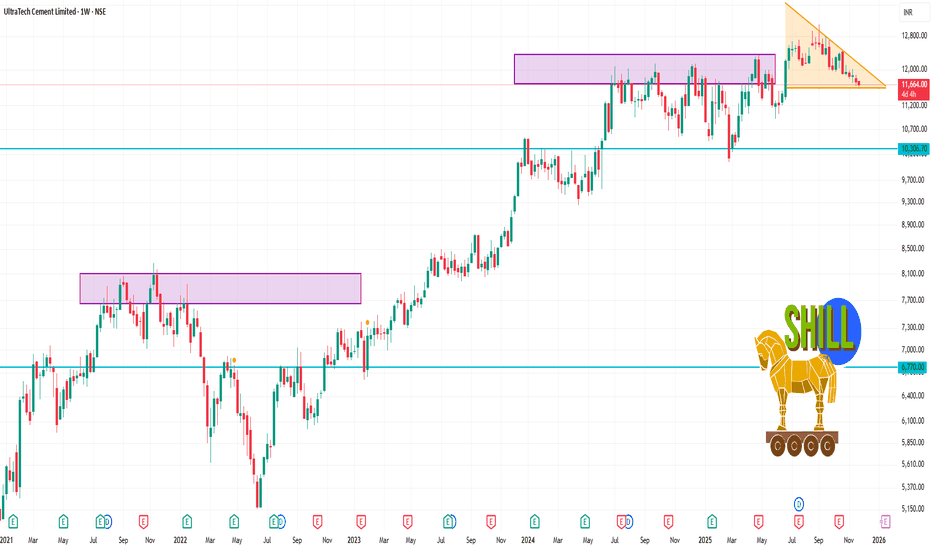
ULTRACEMCO 1 Week Time Frame ✅ Current picture
1. The stock is trading around ₹11,650-11,700 in the NSE market.
2. Weekly indicators show caution: moving averages (20, 50, 100) are above the current price, signalling short‐term weakness.
3. According to weekly pivot‐levels from Moneycontrol:
Resistance around ₹11,865 – ₹12,115 (Classic)
Support around ₹11,501 – ₹11,365
4. Another source gives near-term support ~ ₹11,684 / ₹11,639 / ₹11,587, pivot ~ ₹11,736, resistance ~ ₹11,781 / ₹11,833.
5. Technically the senti
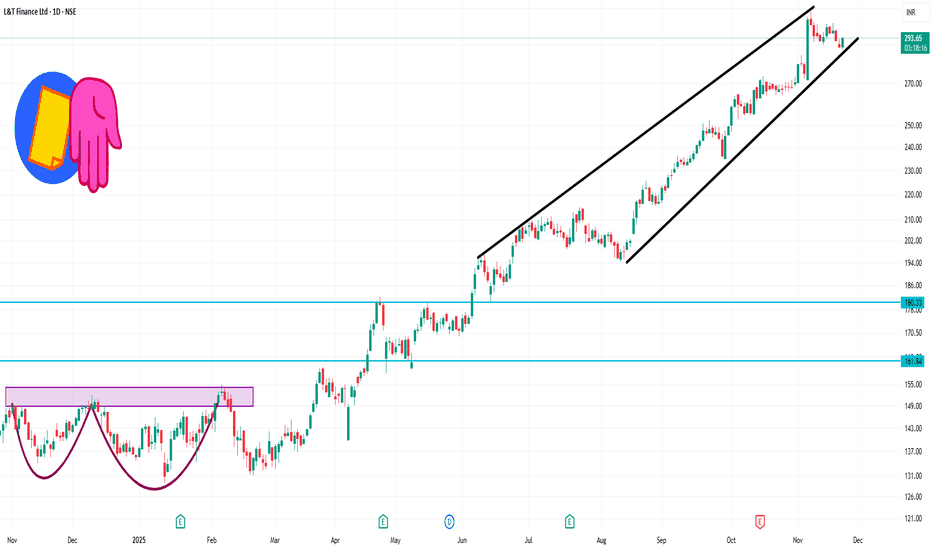
LTF 1 Day Time Frame 📊 Key Price Levels
Current price: ~ ₹ 289–294 per share.
Daily support zone: around ₹ 286–288.
Daily resistance zone: around ₹ 290–295+.
Pivot / central region: ~ ₹ 289.9 (~₹ 290).
✅ What to Watch
If price firmly rises above ~₹ 295, watch for the next resistance near ~₹ 300+ zone.
If price drops below ~₹ 286, support at ~₹ 280 & ~₹ 275 may come into play.
Volume and momentum—if breakout happens with strong volume, the move may have follow-through.
⚠️ Important Caveats
These levels a
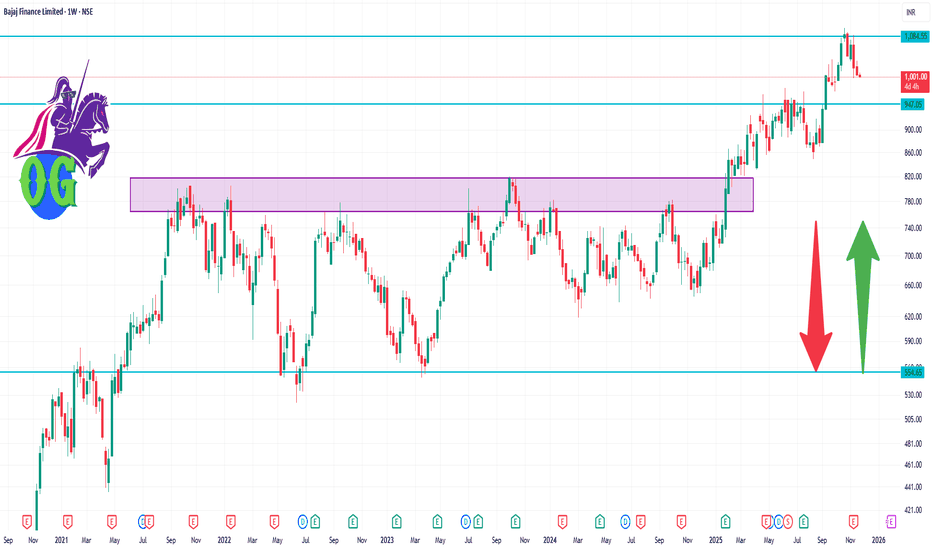
BAJFINANCE 1 Week Time Frame📊 Key Technical Levels
- Current price: ~ ₹1,004 (per Moneycontrol quote)
- Support zone:
~ ₹960-₹970 appears a meaningful near-term support (recent consolidation area)
If breakdown happens, a deeper support around ₹920-₹930 could become relevant
- Resistance zone:
~ ₹1,050-₹1,060 is the first hurdle (recent highs + psychological round number)
A stronger resistance around ₹1,100 (near the 52-week high ~₹1,102.50)
- Range estimate for week:
If neutral: ₹960-₹1,050
If bullish breakout: towa
Why Candlestick Patterns Matter in Trading🔸 Types of Candlestick Patterns
Candlestick patterns can be broadly classified into:
A. Single-Candle Patterns
Hammer
Hanging Man
Inverted Hammer
Shooting Star
Doji
Spinning Top
Marubozu
B. Double-Candle Patterns
Bullish Engulfing
Bearish Engulfing
Piercing Pattern
Dark Cloud Cover
Tweezer Top
Tweezer Bottom
Harami
Harami Cross
C. Triple-Candle Patterns
Morning Star
Evening Star
Three White Soldiers
Three Black Crows
Three Inside Up
Three Inside Down
Advanced-level Chart PatternWhy Chart Patterns Matter
Chart patterns help traders:
Identify trend reversal zones
Recognize trend continuation signals
Determine breakout points
Set entry, stop-loss, and target levels
Understand market behavior and crowd psychology
Most importantly, chart patterns simplify complex market data into visual structures, making decision-making easier.
Unlock India’s Derivatives Power1. The Rise of Derivatives in India
Derivatives—such as futures, options, and swaps—derive their value from underlying assets like stocks, indices, commodities, currencies, and interest rates. India’s derivatives journey began in the early 2000s when SEBI introduced index derivatives to modernize capital markets and reduce speculation in cash segments. Over time, the market matured, attracting domestic retail traders, institutional investors like mutual funds, FPIs, and corporate hedgers.
Toda
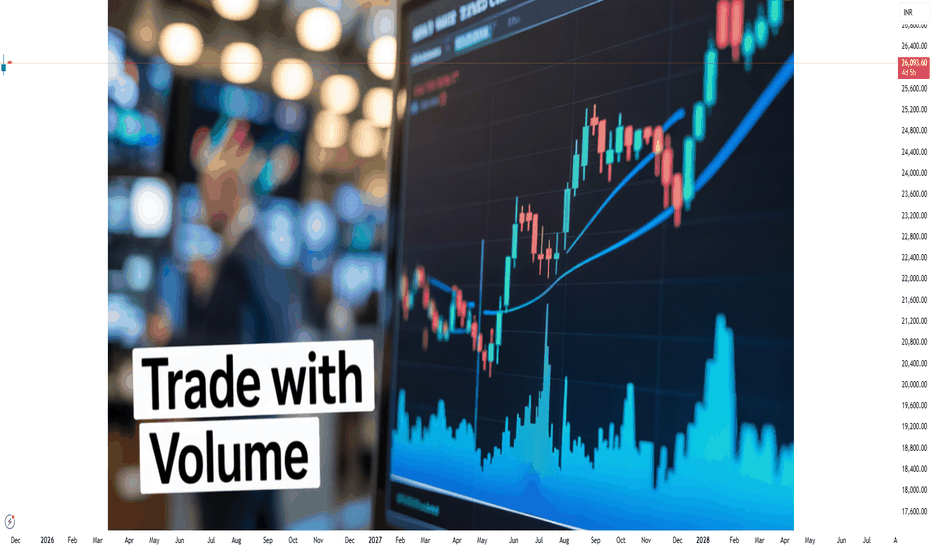
Trading with Volume1. What is Volume in Trading?
Volume is the total number of shares, contracts, or lots traded in a market during a particular period. Every time a buyer and seller make a transaction, it adds to the volume count.
For example:
If 10,00,000 shares of a stock are bought and sold during a day, that stock’s daily volume is 10 lakh.
If Bitcoin has 50,000 transactions in a 1-hour timeframe, that is its hourly volume.
Volume acts as the pulse of the market. When market participants are active, volu
Trading With AI Is Easy1. AI Simplifies Market Analysis
One of the biggest challenges in trading is understanding the market. Human traders spend hours studying charts, indicators, and historical data. AI solves this challenge by processing vast amounts of information within seconds. Machine learning algorithms can analyze:
Price trends
Volume patterns
Global news
Social media sentiment
Economic indicators
Historical correlations
This allows AI systems to provide a deeper and more accurate view of market condi
M&M Fin (W): Bullish, Breakout with Short-Term Rejection(Timeframe: Weekly | Scale: Logarithmic)
The stock has confirmed a major multi-year breakout, moving into "Blue Sky" territory. However, the daily price action suggests a temporary pullback (re-test) is imminent before the uptrend resumes.
📈 1. The Breakout Structure (The "Big Picture")
- The Setup: The stock has been trapped in a consolidation phase since its July 2023 peak. The ₹330–₹335 zone acted as a rigid "ceiling" for over two years.
- The Breakout: The week of Nov 17 was deci
BUY TODAY SELL TOMORROW for 5%DON’T HAVE TIME TO MANAGE YOUR TRADES?
- Take BTST trades at 3:25 pm every day
- Try to exit by taking 4-7% profit of each trade
- SL can also be maintained as closing below the low of the breakout candle
Now, why do I prefer BTST over swing trades? The primary reason is that I have observed that 90% of the stocks give most of the movement in just 1-2 days and the rest of the time they either consolidate or fall
Trendline Breakout in CHENNPETRO
BUY TODAY SELL TOMORROW for 5%
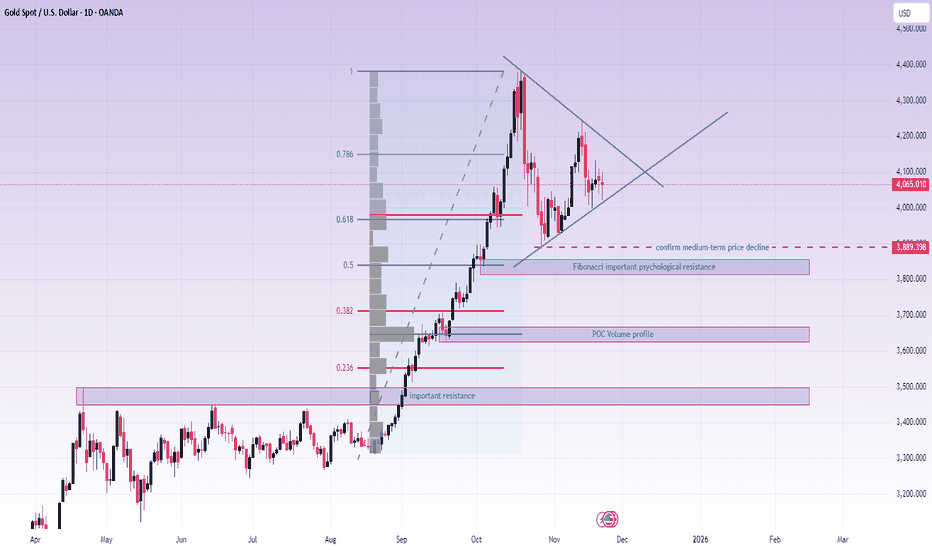
XAUUSD – ACCUMULATION TRIANGLE ON D1💛 XAUUSD – ACCUMULATION TRIANGLE ON D1, AWAITING A NEW BREAKOUT THIS WEEK 🎯
🌤 Overview of the New Week
Hello everyone, Lana here 💬
Gold, after a very strong rise from the 3,500 region to above 4,400, is entering a "resting" phase on the D1 frame: the price continuously tests the upward trendline but has not yet broken it to confirm a downtrend.
The market is clearly waiting for a real breakout before forming a new medium-term wave.
Next week, we have CPI and PPI – important inflation data that
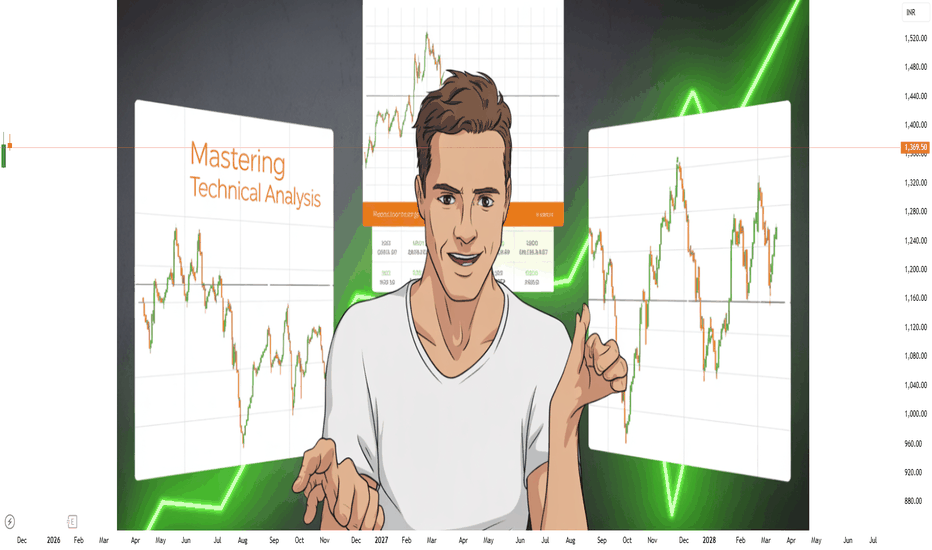
Mastering Technical Analysis1. What Is Technical Analysis?
Technical analysis is a method of forecasting market movement by studying price charts, trading volume, indicators, and patterns. Unlike fundamental analysis—which focuses on earnings, economic data, and intrinsic value—TA assumes that all information is already reflected in the price.
At its core, technical analysis is built on three key assumptions:
1. Market action discounts everything
Every factor—economic data, news, global events—gets absorbed into price.
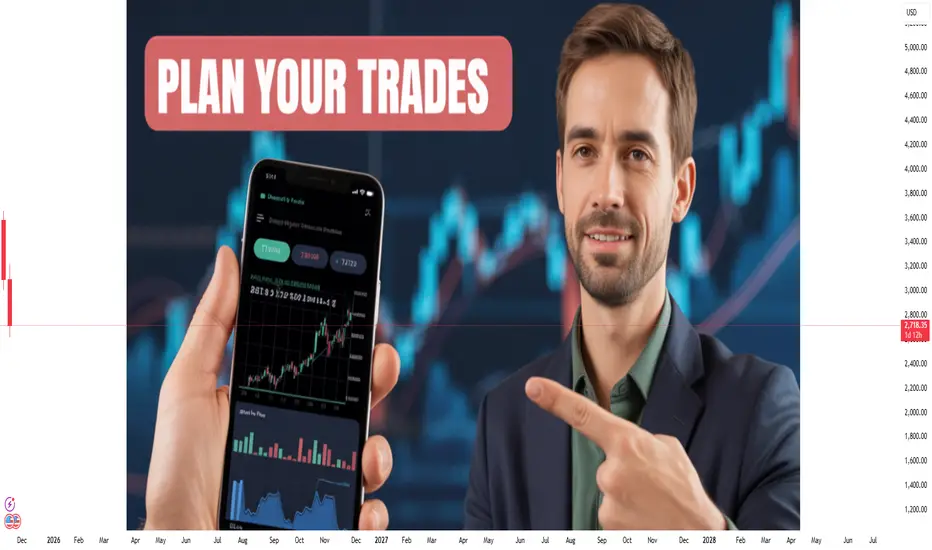
Plan your trades and trade your plan1. Why Planning Matters in Trading
Trading without a plan is like entering a battlefield without a strategy. Markets are unpredictable, influenced by global events, economic data, institutional activity, and trader psychology. Without a plan, emotions such as fear, greed, and impatience take over, resulting in poor decisions.
A well-crafted trading plan helps you:
Reduce emotional decision-making
Identify high-probability setups
Manage risks professionally
Improve consistency
Evaluate and
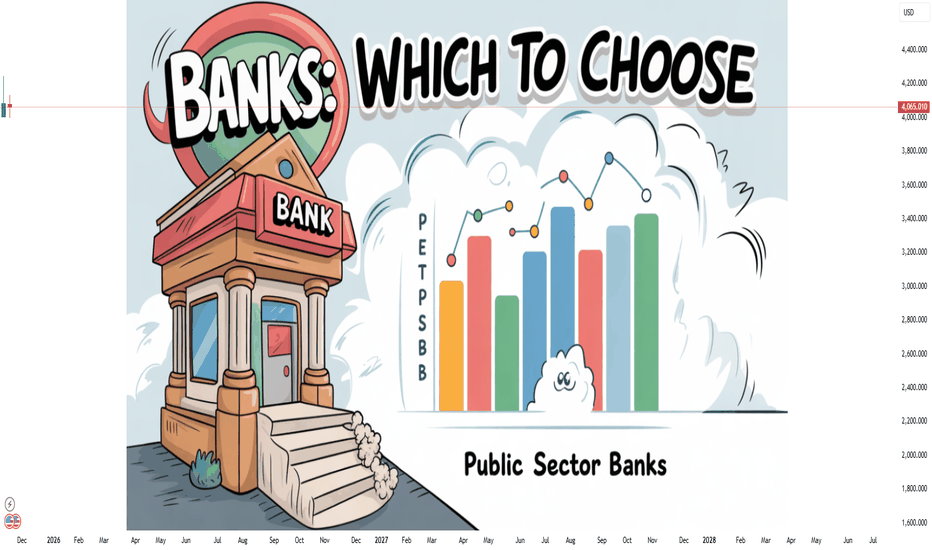
Public Sector Banks in the Trading Market1. What Are Public Sector Banks?
Public Sector Banks are commercial banks where the Government of India holds majority ownership, usually above 51%. These banks operate under government oversight and play a vital role in:
Mobilizing public savings
Lending to priority sectors
Executing government welfare schemes
Providing financial inclusion
Supporting economic stability
Some major PSBs include:
State Bank of India (SBI) – India’s largest bank
Bank of Baroda (BoB)
Punjab National Bank (
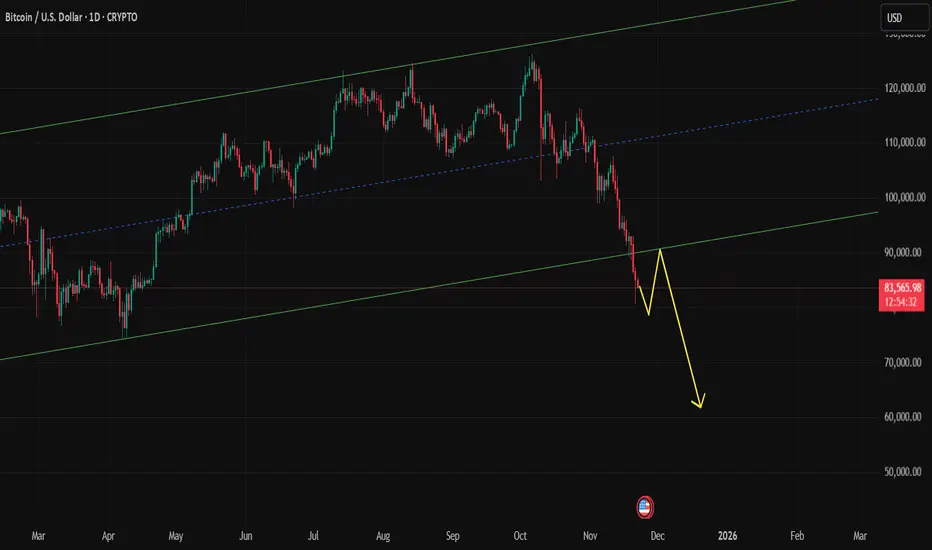
BITCOIN NEED BREATHE CRYPTO:BTCUSD
BTC need take relief of selling because selling is continuously happened so one little bounce is possible and that bounce works as retest of channel breakdown.
Reverse Scenario:
Formation of any bottom pattern
V shape recovery
Long consolidation after with volume brake out.
All chances is possible but there are low possibility
🧠 Always DYOR (Do Your Own Research)
⚖️ This is not financial advice or suggestion
👉 “Risk Is Real 💸 Stay Practical🚀”
💬 Please feel free to ask any
Gold is compressed; next week’s US data will pick a side.Gold is being compressed, the upcoming US data week will determine which side is squeezed.
Good evening everyone, Brian here with a view on XAUUSD on the H2 and H4 frames for the upcoming week.
Fundamental Analysis – a "tailor-made" week for the USD
Next week is packed with US data, meaning gold will react more to numbers than narratives:
Core PPI, PPI, and Retail Sales
Initial Unemployment Claims
Prelim GDP q/q
Core PCE Price Index m/m – the Fed's preferred inflation measure
If inflatio
Part 8 Trading Master Class With ExpertsOptions Trading Styles in Markets
1. Intraday Option Trading
Fast movements
High leverage
Requires quick decision-making
2. Positional Options Trading
Holding for days or weeks
Less stressful than intraday
3. Weekly Expiry Trading (India-specific)
NIFTY & BANK NIFTY weekly options
Very popular among retail traders
Weekly options bring rapid time decay, which benefits option sellers but hurts buyers.
Part 7 Trading Master Class With Experts Non-Directional Strategies
Used when markets are expected to be sideways or volatile.
1. Straddle (Buy Call + Buy Put)
Profit from high volatility in any direction.
2. Strangle
Cheaper version of straddle, using OTM options.
3. Iron Condor
Sell OTM call and put spreads.
Used for stable markets to earn premium.
4. Butterfly Spread
Low-cost strategy for low volatility expectations.
These strategies help traders benefit from volatility, time decay, and neutral price movements.