ADANIENT: Massive Trendline Break and Explosive Macro Breakout 1. The Macro Perspective: The Squeeze and The Floor
I am taking a LONG bias on Adani Enterprises Limited (ADANIENT) on the daily (1D) timeframe.
When analyzing pure market structure, the most violent reversals happen when a major descending trend is broken. Look at the structural development on the left half of this chart. The stock suffered a deep, agonizing markdown phase, with every attempted rally being aggressively swatted down by that massive descending black trendline. This brutal correction successfully washed out weak hands, eventually establishing a rock-solid floor around the 1,800 zone.
2. The Educational Setup: Conquering the Confluence
To understand the sheer strength of this current breakout, look at how the price systematically transitioned from a downtrend back into a markup phase:
The Trendline Break: The first major signal of institutional accumulation was the aggressive push through the descending trendline. The stock didn't just break it; it blasted through and used the 2,286.45 horizontal line as a mid-level stepping stone to build a higher launchpad.
The High-Level Squeeze: After conquering the trendline, the stock marched directly up to the ultimate macro ceiling at the solid black 2,556.10 line. Instead of suffering a massive double-top rejection, buyers aggressively defended the structure, absorbing supply and forming a tight consolidation flag right beneath the resistance. This high-level absorption acts like a pressure cooker, transferring millions of shares to strong-handed buyers.
3. Current Price Action: The Lid Blows Off
Look at the most recent daily candles on the far right. The pressure cooker has absolutely exploded. Buyers have effortlessly shattered the 2,556.10 macro ceiling with a violent, near-vertical momentum thrust, pushing the price above 2,700. Furthermore, look at the RSI indicator on the bottom panel. It is trading strongly in the bullish zone (mid-70s), confirming that the momentum expansion is completely validated by buying pressure. The prolonged markdown phase is officially dead; a brand-new macro markup phase has begun.
4. The Trade Plan: Entries, Targets, and Risk Management
Entry Strategy: Momentum is exceptionally strong right now near 2,712.90. Chasing a massive daily expansion candle always carries a higher risk of an immediate intraday drawdown as the stock naturally breathes. The highest-probability, lowest-risk entry involves stepping down to an hourly timeframe and placing limit orders to catch a potential minor structural pullback to perfectly retest the 2,550.00 to 2,600.00 breakout zone. Letting that massive historical resistance prove itself as a new, indestructible support floor offers a phenomenal risk-to-reward ratio.
Take Profit (Targets): We use measured structural targets based on the depth of the macro base. By taking the depth of the massive recovery (roughly 750 points from the ~1,800 floor to the 2,556.10 ceiling) and projecting it upward from the breakout line, our primary structural macro target sits comfortably in the 3,250.00 to 3,300.00 zone. The massive 3,000.00 century mark will act as the immediate psychological magnet.
Invalidation (Stop Loss): A trade thesis is only valid if the new market structure holds. A hard stop loss should be placed safely below the high-level flag and recent swing lows, around the 2,350.00 to 2,400.00 level. A definitive daily close completely back below the 2,286.45 mid-level pivot would act as a massive warning sign of a failed structural breakout and a severe bull trap.
5. Time Horizon:
Because this technical setup is built on a 1-Day chart capturing a massive trendline reversal and macro ceiling breakout, this is a short-to-medium-term swing trade designed to capture the explosive markup phase. Let the new trend run!
Trend Line Break
XAUUSD — EMA Consolidation Before Bearish Continuation
Fundamental Analysis
Gold remains under short-term pressure as traders continue to watch USD momentum, Treasury yields, and upcoming U.S. macro data.
For now, the recovery has not confirmed a bullish reversal. Price is still reacting around the EMA area, so the current move may be only a short-term consolidation before sellers attempt another push lower.
Technical Analysis
On the 2H chart, XAUUSD is trading around 4,304 after a strong rejection from the upper value range. Price is now consolidating near the EMA 34 and EMA 89 area, showing that the market is pausing before choosing the next direction.
The key zone to watch is 4,301 - 4,320. This area aligns with the Fibonacci retracement zone, volume reaction, and short-term EMA structure. If price fails to hold above this area, sellers may regain control.
The stronger resistance remains around 4,359 - 4,382. As long as gold stays below this value range, the bearish view remains preferred.
If price breaks below the current EMA consolidation zone, the next downside levels are 4,257 and 4,219. A deeper bearish continuation may target the larger convergence support zone around 4,118 - 4,125.
Important Key Levels
Current price area: 4,304
EMA consolidation zone: 4,301 - 4,320
Fibonacci retracement + volume zone: 4,301 - 4,320
Upper value range resistance: 4,359 - 4,382
First downside target: 4,257
Second downside target: 4,219
Major convergence support zone: 4,118 - 4,125
Invalidation area: above 4,382
Trading Scenario
Main Sell Scenario
Entry: 4,301 - 4,320
Stop Loss: 4,382
Take Profit 1: 4,257
Take Profit 2: 4,219
Take Profit 3: 4,118 - 4,125
Sell Condition
The preferred setup is to wait for gold to react around the 4,301 - 4,320 EMA and Fibonacci value zone.
A sell setup becomes more valid if price forms bearish rejection from this zone, such as a long upper wick, bearish engulfing candle, failed breakout, or a lower high below the upper value range.
If price breaks below 4,257 with clear bearish momentum, the next downside focus will be 4,219. Below that, the larger target zone is 4,118 - 4,125.
Entry Conditions
Wait for rejection around 4,301 - 4,320.
Do not sell if price breaks strongly above the value zone.
A move below 4,257 confirms stronger bearish pressure.
If price breaks and holds above 4,382, the sell setup is invalid.
Overall, the main view remains bearish while XAUUSD stays below the upper value range and fails to reclaim stronger resistance. Price may continue to consolidate around the EMA zone in the short term, but if sellers defend 4,301 - 4,320, gold may continue lower toward 4,257, 4,219, and 4,118 - 4,125.
Do you share the same bearish view on gold, or are you waiting for a clearer breakdown below the EMA consolidation zone?
GBPUSD — Sell From EMA Value Zone & Fibonacci Levels
Fundamental Analysis
GBPUSD remains under short-term pressure as traders continue to watch USD strength, U.K. data, and upcoming macro events.
For now, the recovery has not confirmed a bullish reversal. Price is still trading below the key EMA resistance area, so pullbacks into value may continue to offer sell opportunities.
Technical Analysis
On the 2H chart, GBPUSD is trading around 1.3323 after a sharp bearish move from the upper range. Price is currently reacting near the strong support area, but the broader structure still favours sellers while the EMA 34, EMA 89, and EMA 200 remain above price.
The key zone to watch is the EMA value zone around 1.3380 - 1.3395. This area also aligns with the Fibonacci 0.382 retracement and previous broken support. If price pulls back into this zone and rejects, sellers may regain control.
There is also a short-term Fibonacci reaction level around 1.3355 - 1.3363, which can create a scalping sell reaction if price fails to recover strongly.
As long as GBPUSD remains below the EMA value zone, the main bias stays bearish. A rejection from the Fibonacci retracement levels may send price back toward 1.3320, then deeper to 1.3260.
Important Key Levels
Current price area: 1.3323
Strong support area: 1.3315 - 1.3330
Sell scalping zone: 1.3355 - 1.3363
Main EMA value sell zone: 1.3380 - 1.3395
Fibonacci 0.382 value zone: 1.3380 - 1.3395
Upper invalidation area: above 1.3415
First downside target: 1.3315
Main downside target: 1.3260
Trading Scenario
Main Sell Scenario
Entry: 1.3380 - 1.3395
Stop Loss: 1.3415
Take Profit 1: 1.3330
Take Profit 2: 1.3315
Take Profit 3: 1.3260
Sell Condition
The preferred setup is to wait for GBPUSD to pull back into the 1.3380 - 1.3395 EMA value zone. This area is important because it combines EMA resistance, Fibonacci retracement, and previous broken structure.
A sell setup becomes more valid if price forms bearish rejection from this zone, such as a long upper wick, bearish engulfing candle, failed breakout, or lower high formation below the EMA structure.
If price rejects from the value zone and breaks back below 1.3330, bearish pressure may continue toward 1.3315 and 1.3260.
Entry Conditions
Wait for price to retest 1.3380 - 1.3395.
Look for bearish rejection before entering sell.
Do not sell directly at strong support without a pullback.
If price breaks and holds above 1.3415, the sell setup is invalid.
Overall, the main view remains bearish while GBPUSD trades below the EMA value zone. The preferred plan is to wait for a corrective pullback into 1.3380 - 1.3395, then look for sell confirmation toward 1.3330, 1.3315, and 1.3260.
Do you share the same bearish view on GBPUSD, or are you waiting for a cleaner rejection from the EMA value zone?
EURUSD — EMA Bearish Trend, Sell From Value Zone
Fundamental Analysis
EURUSD remains under pressure as the market continues to watch USD momentum, Fed expectations, and upcoming U.S. macro data. If the dollar stays supported, recovery attempts on EURUSD may remain limited.
For next week, the main focus is whether price can retest the value zone above before continuing lower in line with the EMA trend.
Technical Analysis
On the 4H chart, EURUSD is still trading inside a descending channel. EMA 34, EMA 89, and EMA 200 remain above price, showing that the main structure is still bearish.
Price is currently around 1.1565 after reacting from the lower support area. However, this recovery is moving toward the Fibonacci value zone and EMA resistance area near 1.1615.
The main sell zone is around 1.1612 - 1.1627. This area aligns with the 0.382 - 0.5 Fibonacci retracement, EMA resistance, previous broken structure, and liquidity above price.
The key bearish confirmation level is around 1.1500 - 1.1510. If price rejects from the value zone and breaks back below this support, the bearish continuation scenario becomes stronger.
The weekly downside target is the Fibonacci 1.618 extension around 1.1387.
Important Key Levels
Current price area: 1.1565
Main sell zone: 1.1612 - 1.1627
Value zone / Fibonacci area: 1.1612 - 1.1627
Liquidity above: 1.1644 - 1.1646
EMA resistance area: 1.1592 - 1.1646
Key support zone: 1.1500 - 1.1510
Weekly Fibonacci target: 1.1387
Invalidation area: above 1.1646
Trading Scenario
Main Sell Scenario
Entry: 1.1612 - 1.1627
Stop Loss: 1.1646
Take Profit 1: 1.1510
Take Profit 2: 1.1450
Take Profit 3: 1.1387
Sell Condition
The preferred setup is to wait for EURUSD to pull back into the 1.1612 - 1.1627 sell zone. This area is the main value zone on the chart and also aligns with EMA resistance, Fibonacci retracement, and previous broken structure.
A sell setup becomes more valid if price forms bearish rejection from this zone, such as a long upper wick, bearish engulfing candle, failed breakout, or lower high below the EMA structure.
If price rejects from the sell zone and breaks below 1.1500 - 1.1510, the bearish continuation view becomes stronger. The next downside focus would be 1.1450, followed by the weekly Fibonacci target around 1.1387.
Entry Conditions
Wait for price to retest 1.1612 - 1.1627.
Look for bearish rejection before entering sell.
A break below 1.1500 - 1.1510 confirms stronger downside pressure.
If price breaks and holds above 1.1646, the sell setup is invalid.
Overall, the main view for next week remains bearish while EURUSD trades below the EMA structure and inside the descending channel. The preferred plan is to wait for a pullback into the Fibonacci value zone, then look for sell confirmation toward 1.1510, 1.1450, and the weekly Fibonacci target at 1.1387.
Do you share the same bearish view on EURUSD, or are you waiting for a cleaner rejection from the 1.1615 value zone first?
XAUUSD — Sell From Fibonacci & EMA Value Zone
Fundamental Analysis
Gold remains sensitive as traders continue to watch USD strength, Treasury yields, and upcoming U.S. macro data. While the recent recovery is visible, the broader structure still stays under EMA resistance.
For now, any upside move should be treated as a corrective pullback unless gold can break and hold above the main EMA value zone.
Technical Analysis
On the 1H chart, XAUUSD is recovering from the lower liquidity area around 4,077, but the main trend is still under bearish EMA pressure.
EMA 34, EMA 89, and EMA 200 are still positioned above or near price, showing that the market has not fully shifted bullish. The recent move looks more like a retracement into value rather than a confirmed trend reversal.
The key sell zone is around 4,375 - 4,423. This area aligns with the Fibonacci retracement zone, EMA resistance, previous structure, and the upper side of the corrective channel.
If price reaches this zone and shows bearish rejection, sellers may regain control. The first downside reaction area is the VL zone around 4,230 - 4,247. Below that, the deeper liquidity target remains around 4,077.
Important Key Levels
Current price area: 4,323
Fibonacci & EMA value sell zone: 4,375 - 4,423
Short-term support / VL zone: 4,230 - 4,247
Liquidity target: 4,077
EMA reaction area: 4,375 - 4,423
Invalidation area: above 4,423
Trading Scenario
Main Sell Scenario
Entry: 4,375 - 4,423
Stop Loss: 4,440
Take Profit 1: 4,247
Take Profit 2: 4,230
Take Profit 3: 4,077
Sell Condition
The preferred setup is to wait for gold to pull back into the 4,375 - 4,423 value zone. This area combines Fibonacci retracement, EMA resistance, and previous price reaction.
A sell setup becomes more valid if price forms bearish rejection from this zone, such as a long upper wick, bearish engulfing candle, failed breakout, or lower high formation below the EMA structure.
If price rejects from the sell zone and breaks back below 4,291 - 4,300, bearish pressure may return toward 4,247 and 4,230. A deeper breakdown may then target the liquidity zone around 4,077.
Entry Conditions
Wait for price to reach 4,375 - 4,423.
Look for bearish rejection before entering sell.
Do not sell directly while price is still in the middle of the range.
If price breaks and holds above 4,423 - 4,440, the sell setup is invalid.
Overall, the main view remains bearish while XAUUSD trades below the key EMA value zone. The preferred plan is to wait for a corrective pullback into 4,375 - 4,423, then look for sell confirmation toward 4,247, 4,230, and 4,077.
Do you share the same bearish view on gold, or are you waiting for a cleaner rejection from the Fibonacci and EMA value zone?
XAUUSD -Strong Bullish Reaction After FOMC Strong Bullish Reaction After FOMC, Buy Retest Remains Priority
Gold is trading around $4,320 after a strong bullish reaction following the FOMC move. Price swept the weekly low near $4,219, then recovered sharply and reclaimed short-term structure.
From an SMC perspective, the market has already shown CHoCH and strong bullish displacement. The current pullback into $4,311–$4,320 is important because this area aligns with the FVG and retest liquidity zone. As long as gold holds above this zone, the bullish continuation scenario remains active.
The next upside liquidity sits around the week high at $4,383, followed by the trendline area near $4,421. If buyers continue to defend the retest zone, gold can extend toward the main OB sell zone at $4,466–$4,471.
Buy setup 1
Condition:
Gold holds the $4,311–$4,320 retest liquidity zone and prints bullish rejection with lower-timeframe MSS / CHOCH.
Entry: $4,311–$4,320
SL: below $4,290
TP1: $4,383
TP2: $4,421
TP3: $4,466–$4,471
Buy setup 2
Condition:
If gold breaks and holds above the week high at $4,383, wait for a retest before looking for continuation.
Entry: $4,380–$4,390 after breakout retest
SL: below $4,350
TP1: $4,421
TP2: $4,450
TP3: $4,466–$4,471
Sell setup
Condition:
Selling is not the priority right now. A sell setup is only valid if gold reaches the $4,466–$4,471 OB sell zone and shows clear rejection with bearish MSS / CHOCH.
Entry: $4,466–$4,471 after rejection
SL: above $4,490
TP1: $4,421
TP2: $4,383
TP3: $4,320
Key levels
Current price area: $4,320
Buy retest liquidity: $4,311–$4,320
Week low: $4,219
Week high: $4,383
Trendline target: $4,421
Main OB sell zone: $4,466–$4,471
Bullish invalidation: clean 1H close below $4,290
My current view is bullish after the FOMC reaction while gold holds above the $4,311–$4,320 retest zone. The best Prime Gold plan is to wait for price to confirm support at liquidity, then follow the next upside move toward the upper OB zone.
No confirmation, no trade.
XAUUSD — Recovery Into FVG, Then Bearish Reaction Expected
Gold is trading around $4,327 after holding above the short-term support near $4,306. Price is showing a recovery move, but the larger structure is still not fully bullish.
From an SMC perspective, gold is likely moving toward the upper FVG zone around $4,420–$4,430. This area is important because it was previous strong support, and now it can act as a reaction zone if price retests it from below.
My main view is that gold can continue higher first to fill the FVG and test the old support zone. After that, if price shows rejection, the next move may turn bearish again toward the lower liquidity zones.
Buy setup
Condition:
Gold must hold above $4,306 and confirm bullish continuation on lower timeframe.
Entry: $4,310–$4,330
SL: below $4,285
TP1: $4,360
TP2: $4,400
TP3: $4,420–$4,430
This buy setup is only for the recovery move into the FVG zone, not a full bullish reversal.
Sell setup
Condition:
Gold reaches the $4,420–$4,430 FVG zone and shows rejection with bearish MSS / CHOCH confirmation.
Entry: $4,420–$4,430
SL: above $4,455
TP1: $4,306
TP2: $4,205
TP3: $4,104
Continuation sell setup
Condition:
If gold breaks below $4,306 and retests it as resistance, bearish continuation becomes valid.
Entry: below $4,306 after retest
SL: above $4,335
TP1: $4,205
TP2: $4,160
TP3: $4,104
Key levels
Current price area: $4,327
Strong support: $4,306
FVG / old support reaction zone: $4,420–$4,430
Buy zone OB: $4,205
Lower liquidity target: $4,104
Bullish invalidation: clean 4H close below $4,285
Bearish invalidation: clean 4H close above $4,455
My current view is gold may rise first to test the FVG and old support zone, but this area is where I will watch for a bearish reaction. The best Prime Gold plan is to avoid chasing the middle range and wait for price to reach a major liquidity zone before entering.
No confirmation, no trade.
EURUSD - EMA Value Zone Supports Bullish Continuation
Fundamental Analysis
EURUSD is trading in a constructive recovery structure as traders continue to watch USD momentum, Fed expectations, and upcoming macro data.
For now, the technical structure is improving as price holds above the EMA value zone. If USD momentum weakens, EURUSD may continue its recovery toward the next resistance and Fibonacci target zones.
Technical Analysis
On the 1H chart, EURUSD has shifted into a stronger recovery phase after forming higher lows from the lower structure. EMA 34, EMA 89, and EMA 200 have started to turn upward, showing that the short-term trend is improving.
Price is currently trading around 1.1603 and holding near the EMA value zone around 1.1598 - 1.1604. This area is important because it aligns with the upward trendline, EMA support, and the current bullish structure.
The key support to protect the bullish setup is around 1.1575 - 1.1586. If price holds above this area, buyers may continue to defend the trend.
The first upside target is strong resistance 1 around 1.1644. If price breaks above this level, EURUSD may extend toward strong resistance 2 around 1.1685, followed by the Fibonacci resistance target around 1.1696.
Important Key Levels
Current price area: 1.1603
EMA value buy zone: 1.1598 - 1.1604
Upward trendline support: 1.1586 - 1.1600
Invalidation area: below 1.1575
Strong resistance 1: 1.1644
Strong resistance 2: 1.1685
Fibonacci resistance target: 1.1696
Trading Scenario
Main Buy Scenario
Entry: 1.1598 - 1.1604
Stop Loss: 1.1575
Take Profit 1: 1.1644
Take Profit 2: 1.1685
Take Profit 3: 1.1696
Buy Condition
The preferred setup is to wait for EURUSD to hold the 1.1598 - 1.1604 EMA value zone. This area is important because it aligns with EMA support and the upward trendline structure.
A buy setup becomes more valid if price forms bullish rejection from this zone, such as a long lower wick, bullish engulfing candle, higher low formation, or a clean reclaim above 1.1604.
If price holds above the EMA zone and breaks 1.1644, the bullish continuation view becomes stronger. The next upside targets are 1.1685 and the Fibonacci resistance zone around 1.1696.
Alternative Sell Scenario
Entry: 1.1685 - 1.1696
Stop Loss: 1.1710
Take Profit 1: 1.1644
Take Profit 2: 1.1604
Take Profit 3: 1.1586
Sell Condition
This is not the main view. A sell setup should only be considered if EURUSD reaches the upper resistance zone and shows clear bearish rejection.
If price fails to break above 1.1685 - 1.1696, sellers may create a short-term pullback back toward the EMA value zone.
Entry Conditions
Wait for price to hold 1.1598 - 1.1604.
Look for bullish confirmation from the EMA value zone.
A break above 1.1644 confirms stronger upside momentum.
If price breaks below 1.1575, the buy setup is invalid.
Overall, the main view is bullish while EURUSD holds above the EMA value zone and upward trendline. The preferred plan is to wait for a clean reaction from 1.1598 - 1.1604, then look for continuation toward 1.1644, 1.1685, and the Fibonacci resistance target at 1.1696.
Do you share the same bullish view on EURUSD, or are you waiting for confirmation above 1.1644 first?
XAUUSD - Inverse Head & Shoulders Supports Bullish Continuation
Fundamental Analysis
Gold is trading in a constructive recovery structure as traders continue to watch USD movement, Treasury yields, and upcoming U.S. macro data. If USD momentum weakens or risk sentiment supports safe-haven demand, XAUUSD may continue to recover toward higher liquidity zones.
For now, the technical structure is improving as price holds above the EMA range and buyers continue to defend short-term support.
Technical Analysis
On the 1H chart, XAUUSD is trading above EMA 34, EMA 89, and EMA 200. The EMA structure has started to slope upward, showing that the medium-term trend is shifting in favour of buyers.
Price is currently consolidating around 4,327 after forming a clear recovery from the previous low near 4,050. The most important structure on the chart is the inverse head and shoulders pattern.
The left shoulder formed around the 4,250 area, the head was created near 4,050, and the right shoulder formed around 4,285 - 4,300. This pattern suggests that sellers are losing momentum, while buyers are building a stronger base above the EMA range.
The key buy zone is around 4,297 - 4,326. This area aligns with the EMA support range and the right-shoulder structure. If price holds this zone, the bullish continuation scenario remains valid.
The main confirmation level is 4,371. A break and hold above this resistance would confirm stronger buying pressure and may open the way toward the Fibonacci extension targets at 4,391 and 4,484.
Important Key Levels
Current price area: 4,327
EMA buy zone: 4,297 - 4,326
Right shoulder support: 4,285 - 4,307
Bullish confirmation level: 4,371
Fibonacci target 1: 4,391
Major liquidity target: 4,484
Invalidation area: below 4,285
Trading Scenario
Main Buy Scenario
Entry: 4,297 - 4,326
Stop Loss: 4,285
Take Profit 1: 4,371
Take Profit 2: 4,391
Take Profit 3: 4,484
Buy Condition
The preferred setup is to wait for gold to hold the 4,297 - 4,326 EMA buy zone. This area is important because it aligns with the right shoulder of the inverse head and shoulders pattern.
A buy setup becomes more valid if price forms bullish rejection from this zone, such as a long lower wick, bullish engulfing candle, higher low formation, or a clean reclaim above 4,326.
If price breaks and holds above 4,371, the bullish continuation view becomes stronger. The next upside targets are 4,391 and the major liquidity zone around 4,484.
Alternative Sell Scenario
Entry: 4,371 - 4,391
Stop Loss: 4,425
Take Profit 1: 4,326
Take Profit 2: 4,297
Take Profit 3: 4,285
Sell Condition
This is not the main view. A sell setup should only be considered if gold reaches the resistance zone and shows clear bearish rejection.
If price fails to break above 4,371 - 4,391, sellers may create a short-term pullback back toward the EMA buy zone before the market chooses the next direction.
Entry Conditions
Wait for price to hold 4,297 - 4,326.
Look for bullish confirmation from the EMA range.
A break above 4,371 confirms stronger upside momentum.
If price breaks below 4,285, the buy setup is invalid.
Overall, the main view is bullish while XAUUSD stays above the EMA structure and the right-shoulder support zone. The inverse head and shoulders pattern is supporting a potential continuation toward 4,371, 4,391, and possibly 4,484 if buyers maintain control.
Do you share the same bullish view on gold, or are you waiting for confirmation above 4,371 first?
XAUUSD — Early Week Plan, Waiting For Buy Zone Retest
Gold is trading around $4,218 after recovering strongly from the lower area near $4,020. The chart shows a clear CHoCH and price is now holding above the short-term rising structure.
From an SMC perspective, gold has swept sell-side liquidity first, then created a bullish reaction. However, price is still below the day high around $4,246 and has not yet reached the higher buy-side liquidity at $4,363.
For the start of the week, I prefer to wait for a pullback into the FVG buy zone around $4,110–$4,130. If buyers defend this area, gold can continue the corrective recovery toward $4,300–$4,320 and then $4,363.
Buy setup
Condition:
Gold pulls back into the $4,110–$4,130 FVG buy zone and shows bullish rejection with lower-timeframe MSS / CHOCH.
Entry: $4,110–$4,130
SL: below $4,080
TP1: $4,180
TP2: $4,246
TP3: $4,300–$4,320
Continuation buy setup
Condition:
If gold breaks and holds above the day high at $4,246, wait for a retest before looking for continuation.
Entry: $4,240–$4,250 after breakout retest
SL: below $4,210
TP1: $4,300
TP2: $4,320
TP3: $4,363
Sell setup
Condition:
A sell setup is only valid if gold rejects strongly from the $4,300–$4,320 FVG zone or fails to hold above $4,246 after a false breakout.
Entry: $4,300–$4,320 after rejection
SL: above $4,345
TP1: $4,246
TP2: $4,180
TP3: $4,130
Key levels
Current price area: $4,218
Day high: $4,246
Main FVG buy zone: $4,110–$4,130
Upper FVG target: $4,300–$4,320
Buy-side liquidity: $4,363
Bullish invalidation: clean 1H close below $4,080
My early week view is bullish correction while gold holds above the lower FVG buy zone. The best Prime Gold setup is to wait for price to return into liquidity, confirm rejection, then follow the next upside move.
No confirmation, no trade.
XAUUSD — EMA Bearish Trend, Sell From Fibonacci Value Zone
Fundamental Analysis
Gold remains under bearish pressure as the market focuses on key USD events this week, including the Federal Funds Rate, FOMC Economic Projections, FOMC Statement, and the FOMC Press Conference.
These events may create strong volatility for XAUUSD. If the Fed tone supports USD strength or keeps rate expectations tight, gold may continue to face selling pressure on recovery attempts.
Technical Analysis
On the 4H chart, XAUUSD is still moving inside a descending channel. EMA 34, EMA 89, and EMA 200 remain above price, confirming that the main trend is still bearish.
Price is currently trading around 4,218 after a short-term recovery from the lower area. However, this bounce is moving toward the Fibonacci value zone and EMA resistance area around 4,240 - 4,280.
This zone is important because it aligns with the 0.236 - 0.382 Fibonacci retracement, the EMA range, previous broken structure, and channel pressure. If price rejects from this area, sellers may regain control.
The key bearish confirmation level is 4,170. A clean break below this level would strengthen the downside continuation toward 4,026. If bearish momentum expands further, the weekly goal remains the Fibonacci Extension 1.618 zone around 3,813 - 3,815.
Important Key Levels
Current price area: 4,218
Fibonacci value sell zone: 4,240 - 4,280
EMA sell range: 4,240 - 4,280
Short-term resistance: 4,239 - 4,281
Key bearish confirmation level: 4,170
Reaction support: 4,026
Weekly Fibonacci Extension target: 3,813 - 3,815
Invalidation area: above 4,370
Trading Scenario
Main Sell Scenario
Entry: 4,240 - 4,280
Stop Loss: 4,370
Take Profit 1: 4,170
Take Profit 2: 4,026
Take Profit 3: 3,813 - 3,815
Sell Condition
The preferred setup is to wait for gold to pull back into the 4,240 - 4,280 Fibonacci value zone. This area aligns with the EMA sell range, descending channel pressure, and previous broken structure.
A sell setup becomes more valid if price forms bearish rejection from this zone, such as a long upper wick, bearish engulfing candle, failed breakout, or lower high below the EMA structure.
If price rejects from the sell zone and breaks below 4,170, the bearish continuation view becomes stronger. The next reaction level is 4,026, followed by the weekly Fibonacci Extension target around 3,813 - 3,815.
Entry Conditions
Wait for price to retest 4,240 - 4,280.
Look for bearish rejection before entering sell.
A break below 4,170 confirms stronger bearish pressure.
Be careful with FOMC volatility this week.
If price breaks and holds above 4,370, the sell setup is invalid.
Overall, the main view remains bearish while XAUUSD trades below the EMA structure and inside the descending channel. The preferred plan is to wait for a pullback into the Fibonacci value zone, then look for sell confirmation toward 4,170, 4,026, and the weekly Fibonacci Extension zone around 3,813 - 3,815.
Do you share the same bearish view on gold, or are you waiting for FOMC confirmation before taking a position?
Trendline Explained: The Simplest Tool Traders Ignore!📈 Trendline Explained: The Simplest Tool Traders Ignore!
Have you ever noticed how price seems to respect an invisible line before moving again?
That line is called a Trendline — one of the easiest yet most powerful tools in trading.
But most beginners draw it wrong. ❌
Let’s understand it step by step 👇
__________________________________________________________________________________
🔹 What is a Trendline?
A trendline is a diagonal line used to identify the direction of price movement.
It helps traders spot:
__________________________________________________________________________________
✅ Market trend
✅ Support & Resistance
✅ Entry opportunities
✅ Potential reversals
Think of it as the market’s roadmap 🗺️
__________________________________________________________________________________
📈 1. Uptrend Trendline (Bullish)
When price keeps making:
Higher Highs + Higher Lows
You connect the higher lows.
Result? → A rising trendline.
__________________________________________________________________________________
📌 Meaning:
Buyers are in control and price is respecting support.
Question for you:
Have you noticed price bouncing from the same diagonal level repeatedly?
That’s trendline support.
__________________________________________________________________________________
📉 2. Downtrend Trendline (Bearish)
When price keeps making:
Lower Highs + Lower Lows
You connect the lower highs.
📌 Meaning:
Sellers are controlling the market.
Price often gets rejected from this line.
Pro Tip:
Treat it like a dynamic resistance.
__________________________________________________________________________________
⚠️ The Biggest Beginner Mistake
Most traders do this:
❌ Force the trendline to fit price.
Instead:
✅ Let price naturally guide your line.
If you have to adjust too much, it’s probably wrong.
__________________________________________________________________________________
🎯 Trendline Golden Rule
2 touches = Possible trendline
3 touches = Stronger confirmation
More touches = More reliable
The market respects tested levels more.
__________________________________________________________________________________
🔥 How Traders Use Trendlines
1️⃣ Bounce Trade
Price touches trendline → reacts → continuation move.
Example:
Price touches support trendline + bullish candle = possible long setup.
2️⃣ Breakout Trade
Price breaks trendline strongly.
But wait…
Not every breakout is real.
Look for:
✔️ Strong candle close
✔️ Volume confirmation
✔️ Retest
Fake breakouts trap impatient traders.
__________________________________________________________________________________
🧠 Secret Most Traders Miss
Trendlines work best when combined with:
Support & Resistance
Volume
RSI
MACD
Moving Averages
A single confirmation = weak signal
Multiple confirmations = stronger probability.
__________________________________________________________________________________
🚨 Important Rule
Never trade trendlines blindly.
Trendlines show probability, not certainty.
Always use:
Risk Management > Prediction
__________________________________________________________________________________
📌 Final Takeaway
A trendline is not just a line.
It shows:
Where buyers defend 📈
Where sellers attack 📉
Master this one tool and you’ll start seeing market structure differently.
__________________________________________________________________________________
Do you trade using trendlines, or do you rely more on support/resistance zones?
👇 Share your answer — let’s learn together.
XAUUSD — Medium-Term Corrective Rally From Weekly Liquidity
Gold is trading around $4,218 after reacting strongly from the weekly low near $4,024. The larger structure is still inside a descending channel, but the recent rejection from the low shows that sellers have not confirmed full continuation yet.
From an SMC perspective, price swept sell-side liquidity first, then created a strong reaction from the lower demand area. This opens the door for a medium-term corrective rally, especially if gold continues to hold above the $4,120–$4,160 FVG buy zone.
The first important resistance is the liquidity area around $4,246. If price breaks above this level, the next draw on liquidity is the OB sell scalping zone around $4,300–$4,330, followed by buy-side liquidity near $4,363. Above that, the larger OB zone around $4,440–$4,470 becomes the main medium-term target.
Buy setup
Condition:
Gold must pull back into the $4,120–$4,160 FVG buy zone and show bullish rejection with lower-timeframe MSS / CHOCH confirmation.
Entry: $4,120–$4,160
SL: below $4,080
TP1: $4,246
TP2: $4,300–$4,330
TP3: $4,363
Continuation buy setup
Condition:
If gold breaks and holds above $4,246, wait for a retest before looking for continuation.
Entry: $4,240–$4,250 after breakout retest
SL: below $4,200
TP1: $4,300
TP2: $4,363
TP3: $4,440–$4,470
Sell setup
Condition:
A sell setup is only valid if gold rejects strongly from $4,300–$4,330 or $4,440–$4,470 and prints bearish MSS / CHOCH.
Entry 1: $4,300–$4,330 after rejection
SL: above $4,365
TP1: $4,246
TP2: $4,180
TP3: $4,120
Entry 2: $4,440–$4,470 after rejection
SL: above $4,500
TP1: $4,363
TP2: $4,300
TP3: $4,246
Key levels
Weekly low: $4,024
Main FVG buy zone: $4,120–$4,160
Current price area: $4,218
Liquidity resistance: $4,246
OB sell scalping zone: $4,300–$4,330
Buy-side liquidity: $4,363
Medium-term OB target: $4,440–$4,470
Bullish invalidation: clean 12H close below $4,080
My current view is that gold may build a medium-term corrective rally after sweeping the weekly low. The main trend has not fully reversed yet, but the reaction from liquidity is strong enough to watch for buy setups on pullbacks.
The best Prime Gold plan is to wait for price to return into the FVG buy zone or confirm a breakout above liquidity before entering.
No confirmation, no trade.
XAUUSD – Weekly OutlookGold Remains Bearish Below Major Trendline
Gold is still trading under clear weekly pressure after losing the rising support structure and failing to reclaim the higher liquidity area. The daily chart shows that sellers remain in control while price is moving below the SMA 200 and below the long-term descending trendline.
FUNDAMENTAL ANALYSIS
Gold remains sensitive to the U.S. dollar, Treasury yields and upcoming U.S. economic data. If the dollar stays firm and rate-cut expectations remain weak, gold may continue to face selling pressure next week.
For now, the technical structure is still more important. As long as gold cannot reclaim the broken support and liquidity zone above, bearish continuation remains the main view.
TECHNICAL ANALYSIS – SMC + FIBONACCI
From an SMC perspective, gold has broken below an important support structure and confirmed weakness after failing to hold the previous trendline base. The recent move shows bearish displacement, and price is now testing the broken trendline area from below.
The zone around 4,218 – 4,300 is important because it may act as a sell-test area. If price fails to reclaim this zone, sellers may continue to defend the structure.
Above price, the liquidity zone around 4,400 – 4,446 is a stronger resistance area, also close to the SMA 200. A deeper recovery into this zone would still be considered a bearish retest unless gold breaks and holds above it clearly.
The main downside focus is the weekly low near 4,022. If this level breaks, gold may continue toward the strong support around 3,888, followed by the Fibonacci extension targets near 3,730 and 3,380.
KEY PRICE ZONES TO WATCH
Current price area: 4,218
Sell test trendline area: 4,218 – 4,300
Liquidity zone / SMA 200 resistance: 4,400 – 4,446
Strong resistance: 4,595
Lowest support this week: 4,022
Strong support: 3,888
Fibonacci Target 1: 3,730 – 3,700
Fibonacci Target 2: 3,400 – 3,360
Invalidation area for sell view: Above 4,446 – 4,595
TRADING SCENARIOS
Sell Scenario – Priority Weekly View
If gold retests the 4,218 – 4,300 area and shows rejection, I will watch for a bearish continuation setup.
Sell Zone: 4,218 – 4,300
Entry Condition: Bearish rejection, failed retest, lower-timeframe CHoCH, or strong bearish displacement from the broken trendline area.
Stop Loss: Above 4,300 or above the nearest swing high.
Take Profit:
TP1: 4,022
TP2: 3,888
TP3: 3,730 – 3,700
Alternative Sell Scenario
If gold recovers deeper into the 4,400 – 4,446 liquidity zone, I will still watch for sell reaction if price fails to reclaim the SMA 200 and descending trendline.
Sell Condition: Wait for rejection from 4,400 – 4,446 with bearish confirmation on the smaller timeframe.
Target: 4,022 – 3,888
Buy Scenario – Only Corrective Recovery
A buy setup is not the main view for next week. However, if gold holds above 4,022 and creates a bullish reaction, a short-term corrective bounce may appear.
Buy Zone: 4,022 – 4,000
Entry Condition: Liquidity sweep, bullish rejection, or lower-timeframe bullish CHoCH.
Take Profit:
TP1: 4,218
TP2: 4,300
Invalidation: If price breaks and holds below 4,022, the buy idea is invalid.
MY VIEW ON GOLD
My weekly view for gold remains bearish. The chart shows that price has lost an important support structure and is now trading below the SMA 200, while the descending trendline continues to pressure the market from above.
The cleaner plan is to wait for gold to retest resistance, then observe seller reaction on the smaller timeframe. The 4,218 – 4,300 area is the first sell-test zone, while 4,400 – 4,446 is the stronger liquidity resistance if price recovers deeper.
Overall, gold remains weak unless buyers can reclaim the liquidity zone and hold above the SMA 200. If 4,022 breaks, the next weekly downside path may open toward 3,888 and the Fibonacci extension targets below.
Do you think gold will reject from the trendline retest next week, or will price recover deeper into the 4,400 liquidity zone first?
RBL Bank on the Verge: Weekly Chart Signals a Fresh Trend BreakRBL Bank has shown strong bullish momentum in its weekly chart, supported by rising price, strong moving averages, and a robust uptrend. The stock is currently trading near its 52-week high at around ₹326, indicating significant strength in the ongoing trend.
Technical Indicator Analysis
• Price and Trend: The stock has risen over 42% in the past year and over 7% in the last month, supported by strong volume and positive sentiment.
• Moving Averages: The 50-week and 200-week moving averages are sloping upwards, and the price is trading well above both, which is a bullish sign.
• Relative Strength: RSI (implied by the breakout and new highs) likely remains in bullish territory, confirming momentum.
• Support and Resistance: The stock has immediate support near ₹300 and strong resistance is seen at the recent high of ₹331.50.
Chart Pattern and Target
• Pattern Observed: A continuation breakout, possibly following a flag or rounding bottom pattern, is implied. The price action has broken past key resistances, and the trend remains strong.
• Entry Point: New entries can be considered on minor pullbacks toward ₹310-315, or on a weekly close above ₹331.50 for momentum traders.
• Target: Immediate target is the all-time range toward ₹350 . If momentum continues, longer-term targets could be in the ₹380–400 zone, using previous swing projections and extension from current levels.
• Stop Loss: Suggested stop-loss for positional trades is below ₹296 on a closing basis to protect gains and manage downside risk.
Overall, the weekly technical for RBL Bank support a bullish stance with buy-on-dip and breakout strategies, as long as the price remains above the key moving averages and stop-loss.
📌 Thanks a ton for checking out my idea! Hope it sparked some value for you.
🙏 Follow for more insights
👍 Boost if you found it helpful
✍️ Drop a comment with your thoughts below!
GBPUSD Buy Zone Retest Before Continuation Higher
Fundamental Analysis
GBPUSD is trading in a short-term recovery structure as traders continue to watch U.S. dollar momentum, U.K. data, and central bank expectations.
After the previous bearish phase, price is now showing signs of a bullish reaction from the lower structure. If buyers can defend the retest zone, GBPUSD may continue its recovery toward the next resistance levels.
Technical Analysis
On the 1H chart, GBPUSD has broken out from the short-term descending structure and is now trading above the EMA cluster. EMA 34, EMA 89, and EMA 200 are starting to act more like support instead of resistance.
The key area on the chart is the buy zone around 1.3378 - 1.3385. This zone was previously a resistance area and may now become support if price retests it successfully.
Current price is around 1.3402, slightly above the buy zone. A controlled pullback into 1.3378 - 1.3385 followed by bullish rejection would create a cleaner buy setup.
The first upside resistance is around 1.3433. If buyers break this level, the next major target is the strong resistance zone around 1.3483 - 1.3485.
Important Key Levels
Current price area: 1.3402
Buy zone retest: 1.3378 - 1.3385
Short-term invalidation: below 1.3364
Nearest resistance: 1.3433
Strong resistance: 1.3483 - 1.3485
EMA support area: 1.3385 - 1.3400
Trading Scenario
Main Buy Scenario
Entry: 1.3378 - 1.3385
Stop Loss: 1.3364
Take Profit 1: 1.3433
Take Profit 2: 1.3483
Take Profit 3: 1.3485
Buy Condition
The preferred setup is to wait for GBPUSD to retest the 1.3378 - 1.3385 buy zone. This area is important because it aligns with the breakout retest structure and the EMA support zone.
A buy setup becomes more valid if price forms bullish rejection from this zone, such as a long lower wick, bullish engulfing candle, higher low formation, or a clean reclaim back above 1.3400.
If price holds above the buy zone and breaks 1.3433, the recovery scenario may extend toward the strong resistance zone at 1.3483 - 1.3485.
Alternative Sell Scenario
Entry: 1.3433 - 1.3483
Stop Loss: 1.3500
Take Profit 1: 1.3400
Take Profit 2: 1.3385
Take Profit 3: 1.3364
Sell Condition
This is not the main view. A sell setup should only be considered if GBPUSD reaches resistance and shows strong bearish rejection.
If price fails to break above 1.3433 or rejects from 1.3483 - 1.3485, sellers may create a short-term pullback back toward the buy zone.
Entry Conditions
Wait for price to retest 1.3378 - 1.3385.
Look for bullish confirmation before entering buy.
A hold above 1.3400 strengthens the recovery view.
If price breaks below 1.3364, the buy setup is invalid.
Watch for reaction at 1.3433 and 1.3483 - 1.3485.
Overall, the main view is that GBPUSD may continue higher if the 1.3378 - 1.3385 buy zone holds. A confirmed reaction from this area may support a move toward 1.3433 first, then 1.3483 - 1.3485.
Do you share the same bullish view on GBPUSD, or are you waiting for a cleaner retest of the buy zone first?
XAUUSD — Doji Reversal From Psychological Buy Zone
Fundamental Analysis
Gold remains sensitive after a strong bearish move into lower liquidity. The market is still watching USD strength, Treasury yields, and upcoming U.S. data, which may create volatility around the current support zone.
For now, the broader pressure is still bearish, but the reaction from the psychological buying zone shows that a short-term recovery may develop if buyers confirm control.
Technical Analysis
On the 6H chart, XAUUSD is still moving inside a descending channel, with EMA 34, EMA 89, and EMA 200 above price. This means the main trend has not fully turned bullish yet.
However, price has reached the 4,090 - 4,110 psychological buying zone and formed a doji-style reversal candle. This shows seller hesitation and may support a corrective bounce.
If buyers defend this zone, gold may recover toward 4,200 first, then 4,270 - 4,320, where the accumulation zone and descending trendline are located. This area will be important for the next reaction.
Important Key Levels
Current price area: 4,107
Psychological buying zone: 4,090 - 4,110
Doji reversal area: 4,090 - 4,110
Invalidation below: 4,047
Nearest recovery level: 4,200 - 4,220
Accumulation zone: 4,270 - 4,320
Trendline reaction zone: 4,270 - 4,320
EMA reaction area: 4,323 - 4,450
Higher EMA resistance: 4,566
Trading Scenario
Main Buy Scenario
Entry: 4,090 - 4,110
Stop Loss: 4,047
Take Profit 1: 4,200
Take Profit 2: 4,270
Take Profit 3: 4,320
Buy Condition
The preferred setup is to wait for gold to hold the 4,090 - 4,110 psychological buying zone. The doji candle near this area is an early sign that bearish momentum may be slowing down.
A buy setup becomes more valid if price confirms the doji reversal with bullish follow-through, such as a strong bullish candle close, higher low formation, or a reclaim above 4,120 - 4,140.
If this confirmation appears, the recovery move may target 4,200 first, then 4,270 - 4,320.
Alternative Sell Scenario
Entry: 4,270 - 4,320
Stop Loss: 4,360
Take Profit 1: 4,200
Take Profit 2: 4,110
Take Profit 3: 4,047
Sell Condition
This is not the main immediate view, but it should be monitored. If gold recovers into the accumulation zone and fails to break above the descending trendline, sellers may react again.
A sell setup becomes more valid if price forms bearish rejection from 4,270 - 4,320, such as a long upper wick, bearish engulfing candle, failed breakout, or lower high below the EMA structure.
Entry Conditions
Wait for bullish confirmation after the doji candle.
A reclaim above 4,120 - 4,140 would strengthen the buy setup.
If price breaks below 4,047, the recovery setup is invalid.
Watch for rejection if price reaches 4,270 - 4,320.
Always manage risk because gold can sweep liquidity before reversing.
Overall, the current view is that gold may attempt a corrective recovery after forming a doji reversal candle near the psychological buying zone. If buyers defend 4,090 - 4,110, XAUUSD may recover toward 4,200 first, then 4,270 - 4,320 where the accumulation zone and trendline reaction area are located.
Do you share the same view that gold may recover from this psychological buying zone, or are you waiting for stronger confirmation above 4,140?
XAUUSD - Bullish Recovery Confirmed, Buy Setup Remains Priority
Gold is trading around $4,180 after a strong bullish displacement from the weekly low near $4,024. Price has created a clear CHoCH and reclaimed short-term structure, showing that buyers are starting to control the intraday move.
From an SMC perspective, gold swept sell-side liquidity first, then reacted strongly from the lower OB and pushed through the previous structure. The current pullback is normal after the strong move up, and the key area to watch is the FVG buy zone around $4,115–$4,135.
As long as gold holds above this FVG zone, the bullish continuation scenario remains valid. The next upside target is the IFVG area around $4,180–$4,200, followed by the higher OB zone around $4,330–$4,350.
Buy setup
Condition:
Gold must pull back into the $4,115–$4,135 FVG buy zone and show bullish rejection. Entry is only valid after lower-timeframe MSS / CHOCH confirms buyers are stepping back in.
Entry: $4,115–$4,135
SL: below $4,085
TP1: $4,180
TP2: $4,220
TP3: $4,330–$4,350
Continuation buy setup
Condition:
If gold holds above $4,180 and breaks back above $4,220 with bullish displacement, a continuation setup can be considered after retest.
Entry: $4,180–$4,200 after breakout retest
SL: below $4,155
TP1: $4,220
TP2: $4,280
TP3: $4,330–$4,350
Sell setup
Condition:
A sell setup is only valid if gold fails to hold above $4,115 and breaks below the FVG zone with bearish displacement.
Entry: below $4,110 after bearish retest
SL: above $4,140
TP1: $4,080
TP2: $4,045
TP3: $4,024
Key levels
Current price area: $4,180
Main buy FVG zone: $4,115–$4,135
Lower OB support: $4,075–$4,095
Week low: $4,024
Short-term resistance: $4,220
Main upside target: $4,330–$4,350
Bullish invalidation: clean 1H close below $4,085
My current view is bullish while gold holds above the FVG buy zone. The best Prime Gold plan is to wait for price to return into a clean liquidity area, confirm rejection, then follow the next upside move.
No confirmation, no trade.
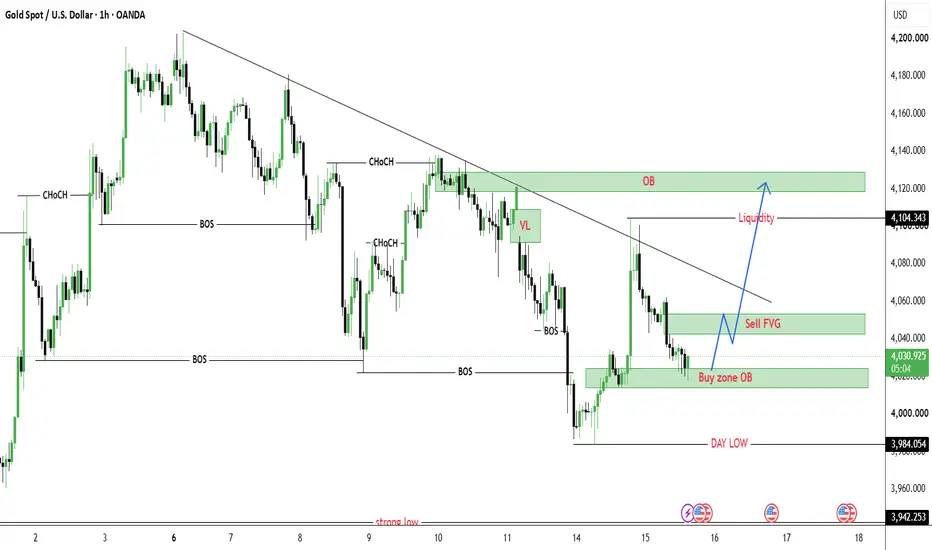
XAUUSD Bearish Structure Continues, Sell Setup Remains Priority
Gold is trading around $4,094 after a strong bearish displacement and multiple MSS confirmations to the downside. The current 2H structure remains bearish, with price still moving below the previous buy-side liquidity at $4,363.
From an SMC perspective, gold has broken below several key structures and is now consolidating inside a short-term liquidity zone. This reaction can create a small pullback, but the main direction is still bearish while price stays below the sell zone at $4,121–$4,134.
The key plan is to wait for price to retest the sell zone, confirm rejection, then follow the next downside move toward the weak low and deeper sell-side liquidity.
Sell setup
Condition:
Gold pulls back into the $4,121–$4,134 sell zone and shows bearish rejection with lower-timeframe MSS / CHOCH.
Entry: $4,121–$4,134
SL: above $4,155
TP1: $4,045
TP2: $4,024
TP3: $4,000
Continuation sell setup
Condition:
If gold breaks below $4,024 and retests this level as resistance, bearish continuation remains valid.
Entry: below $4,024 after retest
SL: above $4,050
TP1: $4,000
TP2: $3,960
TP3: $3,928
Buy setup
Condition:
A buy setup is only considered if gold sweeps the $3,928 liquidity zone and prints a clear bullish MSS / CHOCH. This is only a reaction setup, not the main trend.
Entry: $3,928–$3,950 after liquidity sweep confirmation
SL: below $3,900
TP1: $4,000
TP2: $4,045
TP3: $4,121
Key levels
Current price area: $4,094
Sell zone: $4,121–$4,134
Weak low: $4,024
Sell-side liquidity: $4,000
Main liquidity target: $3,928
Buy-side liquidity: $4,363
Bearish invalidation: clean 2H close above $4,155
My current view remains bearish. Gold is still trading under a strong downside structure, and the best Prime Gold plan is to wait for price to retest the sell zone before looking for continuation.
No confirmation, no trade.
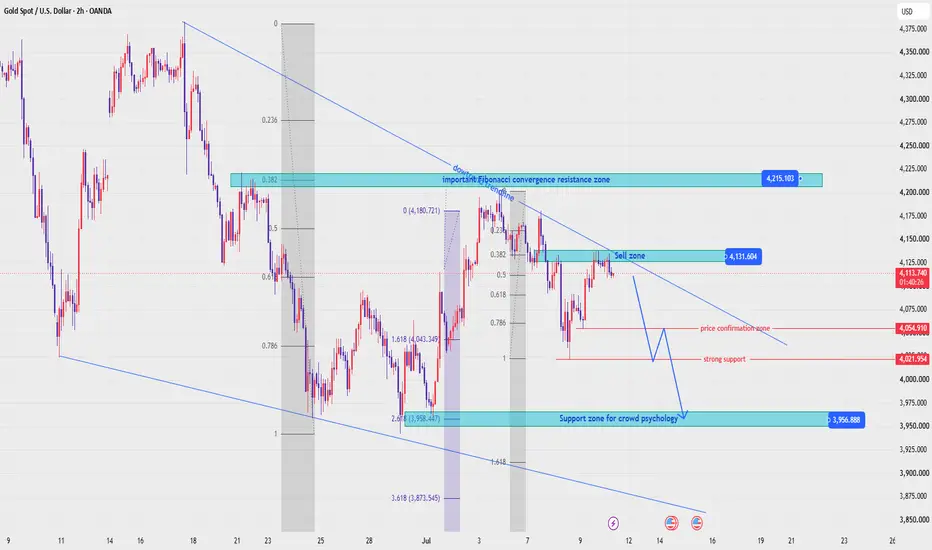
XAUUSD – Gold Remains Under Pressure After Liquidity Break
Gold is still trading inside a bearish structure after the strong breakdown from the previous consolidation area. The current H4 chart shows that sellers are maintaining control below the descending trendline, while price is reacting near the short-term liquidity area around 4,021 – 4,092.
FUNDAMENTAL ANALYSIS
Gold remains highly sensitive to the U.S. dollar, Treasury yields and upcoming U.S. inflation-related data. When the market keeps pricing in a cautious Federal Reserve outlook, gold can stay under pressure, especially after a strong bearish technical move.
At the moment, the fundamental background does not strongly support aggressive buying. Unless there is a clear shift in risk sentiment or weaker U.S. data, the upside recovery may still be limited and sellers may continue to defend the higher supply zones.
TECHNICAL ANALYSIS – SMC + FIBONACCI
From an SMC perspective, gold has already broken below several short-term structures and created bearish displacement on the H4 chart. The previous CHoCH areas have failed to support price, showing that the market has shifted into a lower-high and lower-low structure.
The descending trendline is still pressing from above, while price is trading below the SMA 200, confirming that the broader momentum remains weak. The current Doji candle near the liquidity zone shows hesitation, but not yet a strong bullish reversal.
The nearest upper reaction area is the liquidity zone around 4,161 – 4,182, which also aligns with the 0.618 Fibonacci retracement. If price pulls back into this area and fails to break higher, it may become a clean sell continuation zone.
Above that, the FVG area around 4,286 – 4,294 remains a stronger supply zone. As long as gold stays below this region, the bearish scenario remains the main view.
On the downside, the market is likely watching the day low around 4,024 and the lower liquidity zone near 4,021. If this zone breaks clearly, price may continue expanding toward the Fibonacci extension target around 3,833 – 3,817.
KEY PRICE ZONES TO WATCH
Current price area: 4,082
Nearest support / liquidity: 4,024 – 4,021
Short-term pullback zone: 4,161 – 4,182
Sell reaction zone: 4,161 – 4,182
Major FVG / supply zone: 4,286 – 4,294
Buyside liquidity: 4,363
Main bearish target: 3,833 – 3,817
Invalidation area: Above 4,294
TRADING SCENARIOS
Sell Scenario – Priority View
If gold recovers into the 4,161 – 4,182 zone and shows rejection, I will watch for a bearish continuation setup.
Sell Zone: 4,161 – 4,182
Entry Condition: Wait for bearish rejection, failed breakout, lower-timeframe CHoCH, or strong bearish displacement from the liquidity zone.
Stop Loss: Above 4,182 or above the nearest swing high.
Take Profit:
TP1: 4,024 – 4,021
TP2: 3,833
TP3: 3,817 if bearish momentum expands.
Alternative Sell Scenario
If gold breaks directly below 4,021 with strong momentum, sellers may continue to control the market.
Sell Condition: Wait for a clean H4 break below 4,021, then watch for a retest and rejection from the broken support.
Target: 3,833 – 3,817
Buy Scenario – Only Short-Term Reaction
A buy setup is not the main view today. However, if gold sweeps the 4,021 liquidity area and quickly recovers back above 4,024, a short-term corrective bounce may appear.
Buy Zone: 4,024 – 4,021
Entry Condition: Only consider buying if there is a clear liquidity sweep, bullish rejection candle, and lower-timeframe bullish CHoCH.
Take Profit: 4,161 – 4,182
Invalidation: If price breaks and holds below 4,021, the buy idea is invalid.
MY VIEW ON GOLD
My main view for gold today is still bearish. The chart shows clear selling pressure, price remains below the descending trendline, and the major FVG zones above have not been filled yet.
I prefer looking for sell setups after pullbacks rather than buying too early. The 4,161 – 4,182 zone is the key area for sellers to defend. If gold fails there, the next downside target may be the 3,833 – 3,817 Fibonacci extension zone.
Overall, gold is still weak unless buyers can reclaim the higher FVG zone around 4,286 – 4,294.
Do you think gold will retest 4,161 – 4,182 before continuing lower, or will sellers break 4,021 directly today?
XAUUSD — Bearish Trend ContinuesXAUUSD — Bearish Trend Continues, Sell Setup Remains Priority
Gold is trading around $4,214 after a strong bearish displacement and multiple MSS confirmations to the downside. Price is still moving inside a clear descending channel, so the main intraday bias remains bearish.
From an SMC perspective, gold has broken below previous structure and is now reacting around short-term liquidity near $4,190–$4,210. This reaction can create a minor pullback, but as long as price stays below the sell zone around $4,260–$4,275, the bearish structure remains valid.
The key idea for today is not to chase the low. The better Prime Gold setup is to wait for price to pull back into liquidity or the OB sell zone, then look for bearish confirmation before entering.
Sell setup 1
Condition:
Gold pulls back into the short-term liquidity zone around $4,220–$4,235 and shows rejection with lower-timeframe MSS / CHOCH.
Entry: $4,229–$4,232
SL: above $4,250
TP1: $4,190
TP2: $4,160
TP3: $4,110
Sell setup 2
Condition:
Gold makes a deeper pullback into the main OB sell zone around $4,260–$4,275 and rejects strongly.
Entry: $4,260–$4,275
SL: above $4,295
TP1: $4,220
TP2: $4,180
TP3: $4,110
Buy setup
Condition:
A buy setup is only considered if gold sweeps the lower channel liquidity around $4,100–$4,110 and prints a clear bullish MSS / CHOCH. This is only a reaction setup, not the main trend.
Entry: $4,100–$4,110 after sweep confirmation
SL: below $4,080
TP1: $4,160
TP2: $4,190
TP3: $4,220
Key levels
Current price area: $4,214
Short-term sell reaction: $4,220–$4,235
Main OB sell zone: $4,260–$4,275
FVG resistance: $4,300–$4,325
Buy-side liquidity: $4,363
Downside target: $4,160, then $4,110
Bearish invalidation: clean 1H close above $4,295
My current view is bearish intraday while gold stays below $4,260–$4,275. The priority is to sell pullbacks into liquidity or OB zones, not to chase price after a strong drop.
No confirmation, no trade.
Sequent Scientific - Is it ready for a run towards ATH now?Sequent has been in my watchlist since the breakout of 170 levels.
Stock is making a good Higher high , Higher low pattern in weekly time frame and VCP in lower time frame.
Recently stock gave breakout of a strong resistance zone of 190-200 and is currently consolidating above the same.
If the breakout of 225 happens, we might see stock making a new ATH soon.
Keep this stock in watchlist and lets learn together how the patterns unveils.
This is not a recommendation and idea shared only for educational purposes
I am a NISM Certified RA & not SEBI registered.