XAUUSD — Recovery Into FVG, Then Bearish Reaction Expected
Gold is trading around $4,327 after holding above the short-term support near $4,306. Price is showing a recovery move, but the larger structure is still not fully bullish.
From an SMC perspective, gold is likely moving toward the upper FVG zone around $4,420–$4,430. This area is important because it was previous strong support, and now it can act as a reaction zone if price retests it from below.
My main view is that gold can continue higher first to fill the FVG and test the old support zo
Trend Line Break
EURUSD - EMA Value Zone Supports Bullish Continuation
Fundamental Analysis
EURUSD is trading in a constructive recovery structure as traders continue to watch USD momentum, Fed expectations, and upcoming macro data.
For now, the technical structure is improving as price holds above the EMA value zone. If USD momentum weakens, EURUSD may continue its recovery toward the next resistance and Fibonacci target zones.
Technical Analysis
On the 1H chart, EURUSD has shifted into a stronger recovery phase after forming higher lows from the lower struc
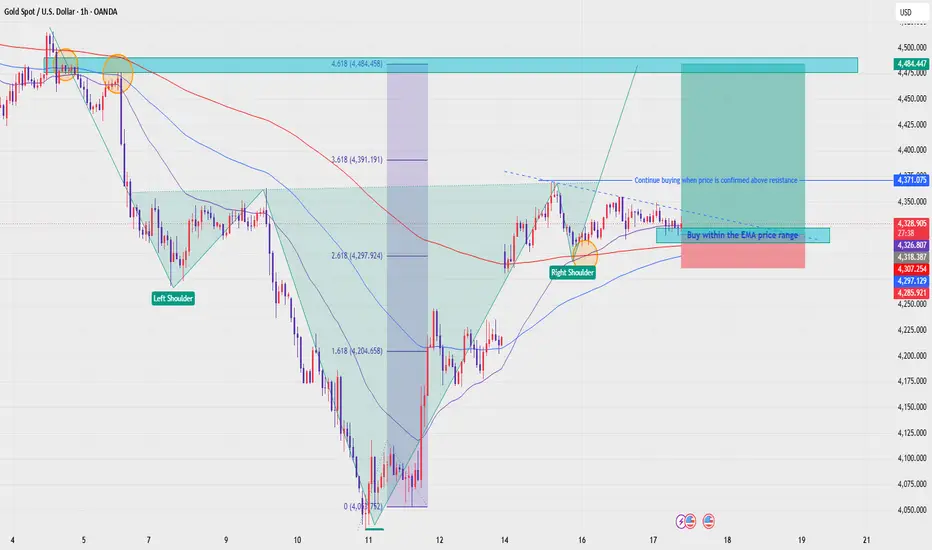
XAUUSD - Inverse Head & Shoulders Supports Bullish Continuation
Fundamental Analysis
Gold is trading in a constructive recovery structure as traders continue to watch USD movement, Treasury yields, and upcoming U.S. macro data. If USD momentum weakens or risk sentiment supports safe-haven demand, XAUUSD may continue to recover toward higher liquidity zones.
For now, the technical structure is improving as price holds above the EMA range and buyers continue to defend short-term support.
Technical Analysis
On the 1H chart, XAUUSD is trading above EMA 34,
XAUUSD — Early Week Plan, Waiting For Buy Zone Retest
Gold is trading around $4,218 after recovering strongly from the lower area near $4,020. The chart shows a clear CHoCH and price is now holding above the short-term rising structure.
From an SMC perspective, gold has swept sell-side liquidity first, then created a bullish reaction. However, price is still below the day high around $4,246 and has not yet reached the higher buy-side liquidity at $4,363.
For the start of the week, I prefer to wait for a pullback into the FVG buy zone around $4,
XAUUSD — EMA Bearish Trend, Sell From Fibonacci Value Zone
Fundamental Analysis
Gold remains under bearish pressure as the market focuses on key USD events this week, including the Federal Funds Rate, FOMC Economic Projections, FOMC Statement, and the FOMC Press Conference.
These events may create strong volatility for XAUUSD. If the Fed tone supports USD strength or keeps rate expectations tight, gold may continue to face selling pressure on recovery attempts.
Technical Analysis
On the 4H chart, XAUUSD is still moving inside a descending channel. EM
Trendline Explained: The Simplest Tool Traders Ignore!📈 Trendline Explained: The Simplest Tool Traders Ignore!
Have you ever noticed how price seems to respect an invisible line before moving again?
That line is called a Trendline — one of the easiest yet most powerful tools in trading.
But most beginners draw it wrong. ❌
Let’s understand it step by step 👇
__________________________________________________________________________________
🔹 What is a Trendline?
A trendline is a diagonal line used to identify the direction of price movement.
I
XAUUSD — Medium-Term Corrective Rally From Weekly Liquidity
Gold is trading around $4,218 after reacting strongly from the weekly low near $4,024. The larger structure is still inside a descending channel, but the recent rejection from the low shows that sellers have not confirmed full continuation yet.
From an SMC perspective, price swept sell-side liquidity first, then created a strong reaction from the lower demand area. This opens the door for a medium-term corrective rally, especially if gold continues to hold above the $4,120–$4,160 FVG buy zone
RBL Bank on the Verge: Weekly Chart Signals a Fresh Trend BreakRBL Bank has shown strong bullish momentum in its weekly chart, supported by rising price, strong moving averages, and a robust uptrend. The stock is currently trading near its 52-week high at around ₹326, indicating significant strength in the ongoing trend.
Technical Indicator Analysis
• Price and Trend: The stock has risen over 42% in the past year and over 7% in the last month, supported by strong volume and positive sentiment.
• Moving Averages: The 50-week and 200-week moving averag
GBPUSD Buy Zone Retest Before Continuation Higher
Fundamental Analysis
GBPUSD is trading in a short-term recovery structure as traders continue to watch U.S. dollar momentum, U.K. data, and central bank expectations.
After the previous bearish phase, price is now showing signs of a bullish reaction from the lower structure. If buyers can defend the retest zone, GBPUSD may continue its recovery toward the next resistance levels.
Technical Analysis
On the 1H chart, GBPUSD has broken out from the short-term descending structure and is now tra
XAUUSD — Doji Reversal From Psychological Buy Zone
Fundamental Analysis
Gold remains sensitive after a strong bearish move into lower liquidity. The market is still watching USD strength, Treasury yields, and upcoming U.S. data, which may create volatility around the current support zone.
For now, the broader pressure is still bearish, but the reaction from the psychological buying zone shows that a short-term recovery may develop if buyers confirm control.
Technical Analysis
On the 6H chart, XAUUSD is still moving inside a descending chan
XAUUSD - Bullish Recovery Confirmed, Buy Setup Remains Priority
Gold is trading around $4,180 after a strong bullish displacement from the weekly low near $4,024. Price has created a clear CHoCH and reclaimed short-term structure, showing that buyers are starting to control the intraday move.
From an SMC perspective, gold swept sell-side liquidity first, then reacted strongly from the lower OB and pushed through the previous structure. The current pullback is normal after the strong move up, and the key area to watch is the FVG buy zone around $4,115–$4,13
XAUUSD Bearish Structure Continues, Sell Setup Remains Priority
Gold is trading around $4,094 after a strong bearish displacement and multiple MSS confirmations to the downside. The current 2H structure remains bearish, with price still moving below the previous buy-side liquidity at $4,363.
From an SMC perspective, gold has broken below several key structures and is now consolidating inside a short-term liquidity zone. This reaction can create a small pullback, but the main direction is still bearish while price stays below the sell zone at $4,121–$4,134
XAUUSD — Bearish Trend ContinuesXAUUSD — Bearish Trend Continues, Sell Setup Remains Priority
Gold is trading around $4,214 after a strong bearish displacement and multiple MSS confirmations to the downside. Price is still moving inside a clear descending channel, so the main intraday bias remains bearish.
From an SMC perspective, gold has broken below previous structure and is now reacting around short-term liquidity near $4,190–$4,210. This reaction can create a minor pullback, but as long as price stays below the sell zon
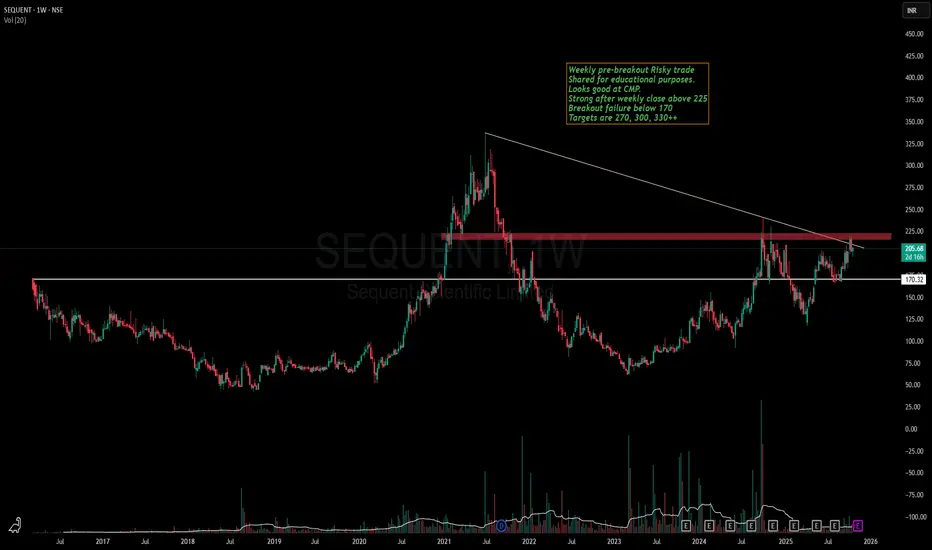
Sequent Scientific - Is it ready for a run towards ATH now?Sequent has been in my watchlist since the breakout of 170 levels.
Stock is making a good Higher high , Higher low pattern in weekly time frame and VCP in lower time frame.
Recently stock gave breakout of a strong resistance zone of 190-200 and is currently consolidating above the same.
If the breakout of 225 happens, we might see stock making a new ATH soon.
Keep this stock in watchlist and lets learn together how the patterns unveils.
This is not a recommendation and idea shared only for edu
BUY TODAY SELL TOMORROW for 5% - BTST STOCK OPTIONTechnical Analysis (Underlying Equity - 1D)
1. Pattern & Breakout Mechanism
The Structure: CGPOWER has been respecting a distinct upward-sloping resistance line and a supportive lower rising trendline. This compression built up significant energy within the channel.
The Trigger: A massive bullish expansion candle has cleanly shattered the upper resistance trendline, closing well above it at ₹934.80 (+6.33%).
Institutional Footprint: This massive breakout candle confirms strong delivery and ins
C
BUY TODAY SELL TOMORROW for 5%DON’T HAVE TIME TO MANAGE YOUR TRADES?
- Take BTST trades at 3:25 pm every day
- Try to exit by taking 4-7% profit of each trade
- SL can also be maintained as closing below the low of the breakout candle
Now, why do I prefer BTST over swing trades? The primary reason is that I have observed that 90% of the stocks give most of the movement in just 1-2 days and the rest of the time they either consolidate or fall
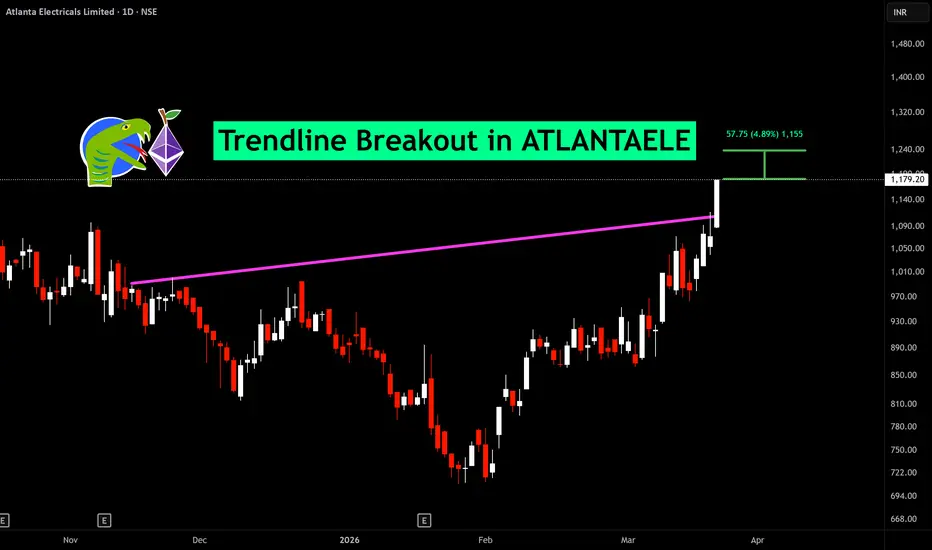
Trendline Breakout in ATLANTAELE
BUY TODAY SELL TOMORROW for 5%
BUY TODAY SELL TOMORROW for 5%DON’T HAVE TIME TO MANAGE YOUR TRADES?
- Take BTST trades at 3:25 pm every day
- Try to exit by taking 4-7% profit of each trade
- SL can also be maintained as closing below the low of the breakout candle
Now, why do I prefer BTST over swing trades? The primary reason is that I have observed that 90% of the stocks give most of the movement in just 1-2 days and the rest of the time they either consolidate or fall
Trendline Breakout in MBAPL
BUY TODAY SELL TOMORROW for 5%
ARVIND: Explosive Trendline Breakout and Volatility Expansion1. The Macro Perspective: The Symmetrical Squeeze
I am taking a LONG bias on Arvind Limited (ARVIND) on the weekly (1W) timeframe.
When analyzing market structure after a massive, prolonged uptrend, we expect the stock to eventually need a rest. For the past several months, ARVIND has been in a healthy macro consolidation phase. It established a rock-solid structural floor down at 290.60, while simultaneously forming lower highs along a descending trendline. This created a massive wedge or tria
AETHER Bullish Reversal Setup with Strong Risk-Reward PotentialAether Industries Ltd is showing signs of a potential trend reversal from a well-established support zone, supported by a descending triangle breakout pattern and improving technical indicators. This setup suggests a strong risk-reward opportunity for swing traders and positional investors.
⚡ Key Technical Points:
🔵 Descending Triangle Breakout Potential: The price is nearing a breakout from a long-term descending triangle. A breakout above the trendline (~₹778–₹790) could trigger a strong
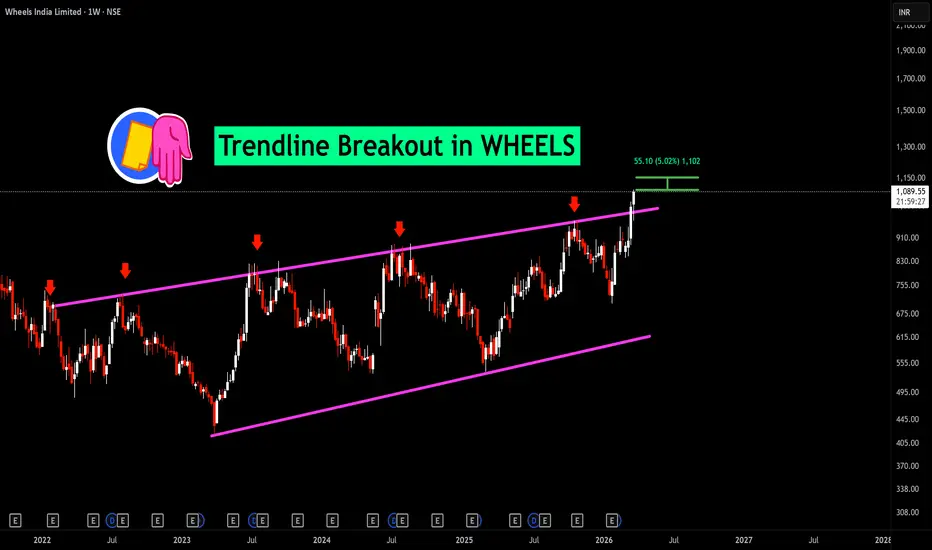
BUY TODAY SELL TOMORROW for 5%DON’T HAVE TIME TO MANAGE YOUR TRADES?
- Take BTST trades at 3:25 pm every day
- Try to exit by taking 4-7% profit of each trade
- SL can also be maintained as closing below the low of the breakout candle
Now, why do I prefer BTST over swing trades? The primary reason is that I have observed that 90% of the stocks give most of the movement in just 1-2 days and the rest of the time they either consolidate or fall
Trendline Breakout in WHEELS
BUY TODAY SELL TOMORROW for 5%
Centum Looks Ready for a Powerful BreakoutCentum Electronics is forming a strong cup and handle structure on the daily chart. After the long correction from the previous highs near 3040 , the stock gradually built a rounded base and recovered steadily from the 2044 low. Instead of seeing aggressive selling near the highs again, the price has started consolidating in a tight range just below resistance, which is usually a positive sign. The handle formation remains controlled, showing that buyers are still holding positions rather th
ASTRAL | Daily TF | Symmetrical TriangleASTRAL Limited
Sector: Capital Goods | Timeframe: Daily | Bias: Bullish
Setup Type: Symmetrical Triangle Breakout Setup
ASTRAL is consolidating inside a symmetrical triangle on the daily timeframe after a strong upmove. Price has been respecting the rising trendline support multiple times, showing buyers are still active near the demand zone around 1500.
Now the stock is approaching the apex of the pattern and a breakout above the falling trendline can trigger the next bullish leg.
Tr
Niva Bupa cmp 81.29 by Daily Chart view since listedNiva Bupa cmp 81.29 by Daily Chart view since listed
- Support Zone 72 to 77 Price Band
- Resistance Zone 82 to 87 Price Band
- Rounding Bottoms formed under Resistance Zone
- Volumes seen in close sync with average traded quantity
- Rising Support Trendline well shouldering price momentum
- Breakout well sustained above Falling Resistance Price Channel
- Support Zone gaining strength by testing retesting since mid April 2026
Read Advanced Option ChainInstitutional Option Trading (6 Key Points):
Smart Money Activity – Institutions like banks, hedge funds, and FIIs trade options with large capital, creating strong directional moves in the market.
Option Chain Analysis – They focus on OI buildup, unwinding, and PCR to identify accumulation/distribution zones.
Liquidity Zones – Institutions trade where liquidity is high (ITM/ATM strikes), ensuring easy entry and exit without slippage.
Hedging Strategies – Use advanced strategies like spreads