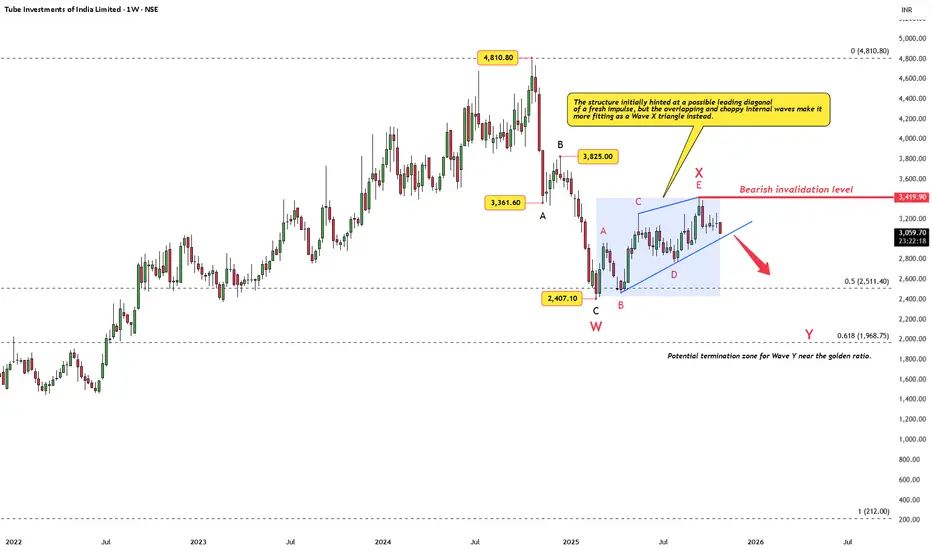
Tube Investments of India Ltd — Wave X Triangle in PlayAfter the sharp decline from ₹4,810, the recent advance initially looked like a potential leading diagonal of a new impulse. However, the internal overlaps and choppy rhythm point instead to a Wave X triangle, likely part of a larger corrective sequence (W–X–Y).
As long as price holds below ₹3,419.90, the bearish outlook remains intact, with the next leg — Wave Y — possibly aiming toward the 0.5–0.618 retracement zone (₹2,511–₹1,968). That region, close to the golden ratio, may act as a potenti
Triangle
Kalyan Jewellers – Symmetrical Triangle Breakout (1-Day)Kalyan Jewellers is currently forming a symmetrical triangle pattern on the daily chart, indicating a period of consolidation as buyers and sellers balance out. A confirmed breakout above the upper trendline could signal the start of a new upward move, while a break below support may lead to further weakness.
At the current market price (CMP) around ₹500,
The key levels to watch are:
• Support: ₹446, ₹393
• Resistance: ₹530, ₹575
Company Overview
Kalyan Jewellers is one of India’s leadi
Redington TGT-380 , sl-270can see consolidation ,
based on pattern tgt -380
resistance around 300-310
support 260-270
below 260 weak
company upate will see growth in uae, and in upcoming 3 quaters
Disclaimer- Just my view and opinion ,trade at your own risk not an investment advice ,these are only for educational purposes
UGRO Capital Ltd – Acending Triangle with Fundamental TailwindsTimeframe: Daily (1D)
Pattern: Ascending Triangle (Developing) – bullish continuation setup not yet confirmed.
Price Action Insight:
UGRO is forming an ascending triangle — a consolidation where higher lows push against a near‑horizontal resistance zone. A decisive breakout above the ₹189‑195 range on strong volume will signal trend continuation. Conversely, a break Trend line Breakout below key supports at ₹165 & ₹148 could trigger deeper correction.
Key Technical Levels:
Resistance Zon
TORNT POWER:Likely Tri -Angle Break Out for a huge upside
Trading at 1400 .
In daily chart Trading above 10/20/50/100 DEMA and has given golden DEMA crossover.
Formed a Triangle pattern in weekly chart which is a bullish pattern.
Holding above 1400-1420 likely to test 1600 followed by 1800 /1900/1200 positionally(For educational purpose only)
ITC symmetrical triangle breakout Price has broken down from a contracting structure.
Next major support sits near ₹358 (prior demand + structure support).
The recent wide-range candle + volume expansion suggests distribution, not a healthy pullback.
What to watch
A reaction near ₹358 is likely.
If price stabilizes with shrinking volume, a mean-reversion bounce is possible.
If selling pressure persists with volume, the trend shift confirms, and downside can extend.
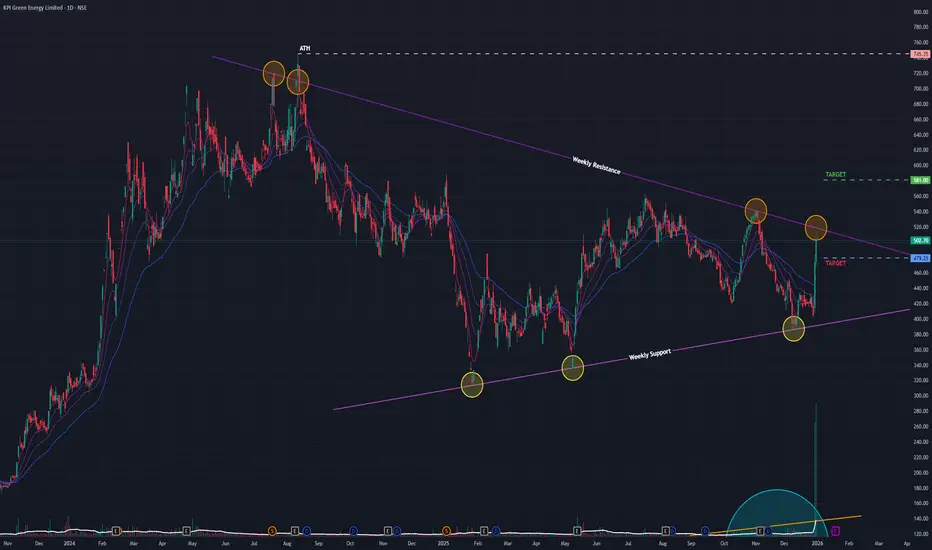
KPI Green (D): Aggressive Bullish, Promoter-Backed MomentumTimeframe: Daily | Scale: Linear
The stock is staging a violent recovery from the bottom of a Symmetrical Triangle. While it has surged +26% in two days, it is currently testing the critical angular resistance . The move is backed by "Insider Buying," which gives it high structural conviction.
🚀 1. The Fundamental Catalyst (The "Why")
The volume explosion is driven by two major factors:
> Promoter Buying: Reports confirm that Quyosh Energia (Promoter Group) purchased shares (approx. 1
BTC Broadening Bearish Formation Earlier, BTC was supposed to create a multi-week Rising Wage pattern, but that seems to have been rejected around 90.3k.
Note:
1. The past may or may not repeat
2. BTC might go to 81k, create bullish divergence on weekly or daily to retrace back to 100k before a major pullback
3. BTC will go to 84-81k. That looks to be more likely now.
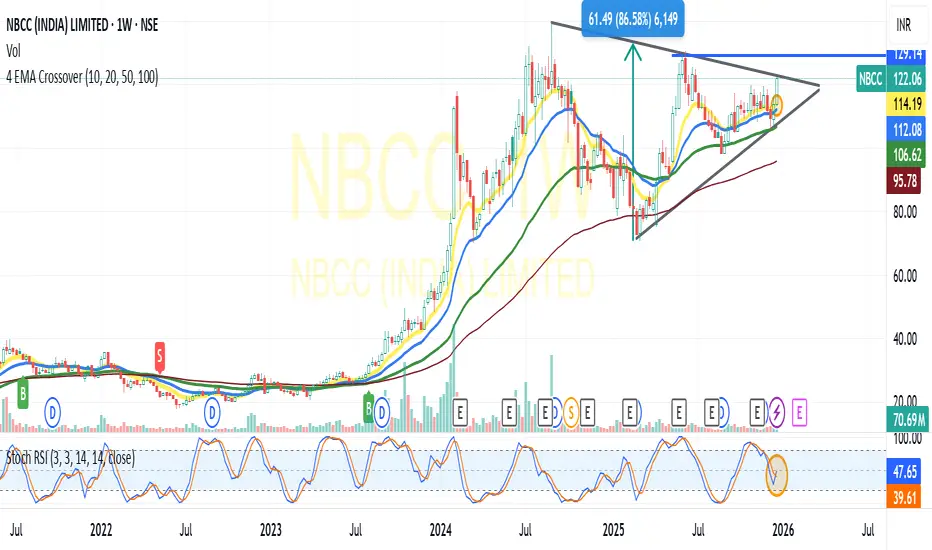
NBCC(India ) Ltd: At the verge of Tri-Angle Break OutNBCC (India) Ltd :
Trading at 122 and above all its moving Averages)10/20/50/100 DEMA)
Golden Cross over of 10 DEMA in Daily & Weekly Charts
Formed a Tr-angle pattern in daily chart and is about to cross the resistance line
Facing resistance at around 125-130 ,in the event of holding above 130 on closing basis expect a possible move towards 150+ as per the Tri-angle pattern break out Target(For educational purpose only)
CUBEX TUBINGS:Likely Triangle Break Out for 10% TARGETCUBEX TUBINGS:Trading at around 112.
Trading above all the critical Moving Averages viz.10 DEMA,20DEMA,50DEMA.
Golden Cross Over :10 DEMA Over 100DEMA
Increase in Volume.
Tri-Angle Break Out
Combination of the above with increase in volume suggests 10-15% upside for a Target of 120/130/140/150(For Educational purpose only)
RVNL cmp 319.15 by Daily Chart viewRVNL cmp 319.15 by Daily Chart view
- Support Zone 294 to 306 Price Band
- Resistance Zone 332 to 345 Price Band
- Support Zone tested retested over past few days
- Support Zone since January 2025 seems been sustained
- Volumes below avg traded quantity, need to increase for fresh upside
- Breakout from Descending Triangle pattern might be in the making process
StarThe price faced resistance at the 1020 zone, fall down and took support at the 850 zone. This created a narrow range which resulted in a symmetrical triangle pattern. The breakout can happen in any direction.
Buy above the 900 - 910 zone with the stop loss of 885 for the targets 925, 940, 954, 972, 996 and 1018.
Sell below 860 with the stop loss of 875 for the targets 844, 826, 808, and 790.
Always do your analysis before taking any trade.
Triangle Compression Zone🔎 Overview
The Triangle Compression Zone highlights a phase where price transitions from directional movement into consolidation. After an initial trend, price begins to contract between converging support and resistance lines, signaling reduced volatility and temporary market balance.
------------------------------------------------------------
📘 Concept
A triangle forms when price creates Lower Highs near resistance and Higher Lows from support. This converging structure reflects de
Triangle formationThangamayil Jewellers – Glistening with Opportunity
The overall sentiment in the jewellery sector has turned positive, supported by strong fundamentals and global tailwinds.
Gold and silver prices are on a consistent uptrend, hitting new highs almost daily, driven by both safe-haven demand and global metal rallies.
Thangamayil Jewellers, a Tamil Nadu-based company, has established a strong presence among the middle class, with steady growth in both sales and revenue.
Technically, the stock s
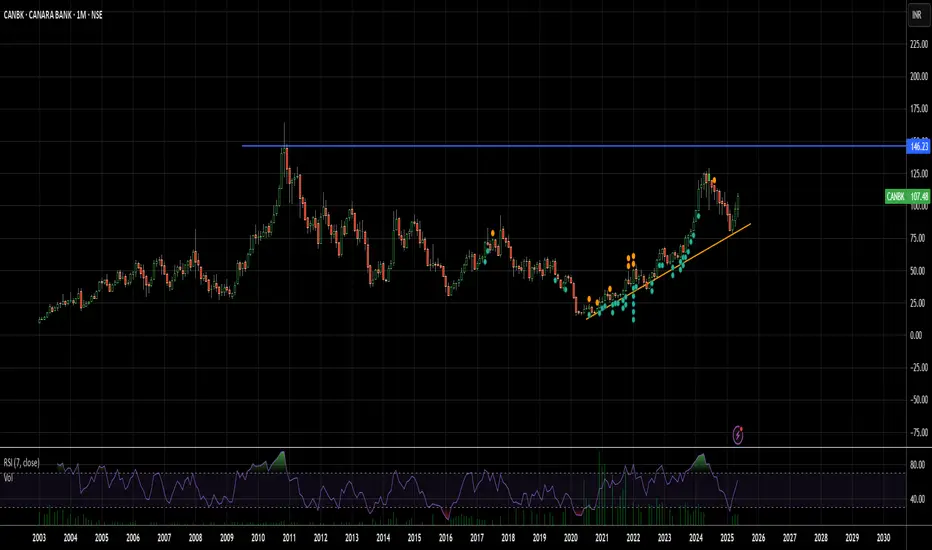
After the IPO of 2 subsidiaries that B/S might strengthenCanara Bank Subsidiaries Set for IPO; Strategic Moves Strengthen Position
There is news that two subsidiaries of Canara Bank — one in mutual funds and the other in insurance — are preparing for Initial Public Offerings (IPOs). In both joint ventures, Canara Bank is expected to be the primary seller, and the proceeds are likely to flow directly to the bank’s balance sheet, strengthening its capital position.
Following recent banking sector reforms, Canara Bank has emerged as one of the more robu
UPL ; Trade possible if ascending triangle 1H breakout.I have marked an ascending triangle line, and it shows how consolidation is expected around this area. This trade can take maximum of your 1 week to attain or fail.
Not a reco, for educational purpose.
I also validated the volumes with LuxAlgo indicator, it is really higher for a doji candle to attain.
Seeing vs Believing: Multi-Pattern Structure vs Single-Line BOOn the left, the weekly chart is mapped as a full A+ type setup, where multiple structural elements work together instead of relying on a single, convenient line.
-A red counter trendline marks a series of lower-high rejection points, visually defining the “least liquidity” supply line that price has repeatedly respected.
-A dotted parallel channel outlines a broader multi-pattern context.
-A dashed hidden line adds another layer of structure, hinting at less obvious inflection zones that are
Info Edge India cmp 1377.70 by Daily Chart viewInfo Edge India cmp 1377.70 by Daily Chart view
- Support Zone 1268 to 1315 Price Band
- Resistance Zone 1405 to 1455 Price Band
- Darvas Box : Stock trading in 1300 to 1432 Range
- Falling Resistance Trendline Breakout attempts made
- Volumes spiking regularly above average traded quantity
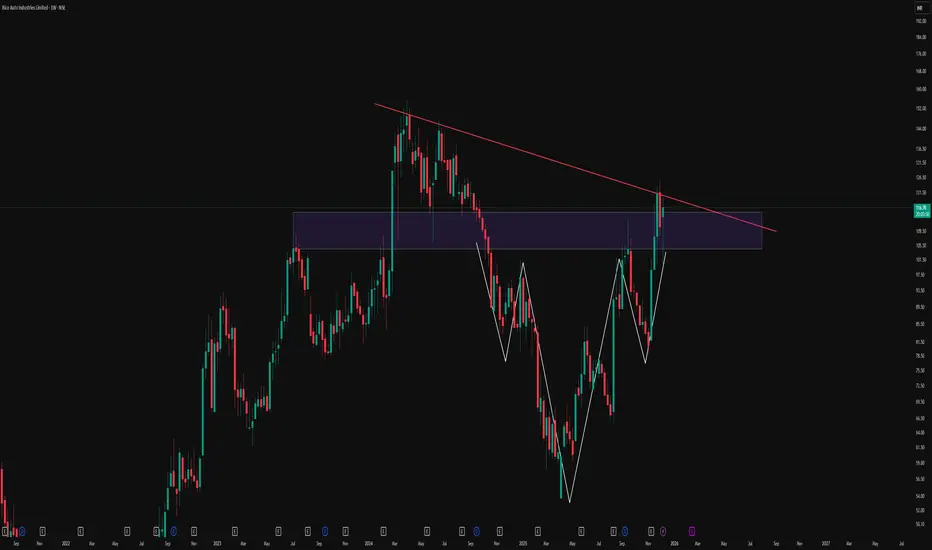
Reclaiming The Breakdown: Descending Triangle To Inverse HnSThis weekly chart of Rico Auto illustrates how structure can evolve over time and why rigid bias around a single pattern can be misleading. Price initially respected a clear descending trendline, forming a classic descending triangle and eventually breaking down below the support zone. Instead of continuing in a straight-line downtrend, the market absorbed that move and began to build a broader basing structure.
Over the following swings, price developed an inverted head and shoulders formation