NETWEB: AI Infrastructure Goldmine ? Chart of the MonthNSE:NETWEB MarchingTowards 4,000: Is This the AI Infrastructure Goldmine You've Been Waiting For? Let's analyze in the "Chart of the Month".
As per the Latest SEBI Mandate, this isn't a Trading/Investment RECOMMENDATION nor for Educational Purposes; it is just for Informational purposes only. The chart data used is 3 Months old, as Showing Live Chart Data is not allowed according to the New SEBI Mandate.
Disclaimer: "I am not a SEBI REGISTERED RESEARCH ANALYST AND INVESTMENT ADVISER."
This analysis is intended solely for informational purposes and should not be interpreted as financial advice. It is advisable to consult a qualified financial advisor or conduct thorough research before making investment decisions.
Price Action Analysis:
- Current Price: ₹3,695.40
- 52-Week Range: ₹738.60 - ₹3,745.00
- Recent Performance: +64% gain in a Month with strong momentum
- Price structure shows consistently higher highs and higher lows pattern
- Stock has demonstrated remarkable resilience with a 380% rally from its 52-week low
Volume Spread Analysis:
- Volume surge visible during recent breakout phases
- High volume of 24.25M shares traded, indicating institutional participation
- Volume expansion coinciding with price breakouts confirms genuine buying interest
- Strong volume accumulation during consolidation phases suggests smart money positioning
Chart Patterns Identified:
- Symmetrical Triangle Breakout: Successfully broken above the triangle pattern
- Ascending Triangle: Multiple resistance tests followed by decisive breakout
- Flag and Pennant Patterns: Short-term consolidation after sharp moves
Key Technical Levels:
Support Levels:
- Immediate Support: ₹3,200 (recent consolidation zone)
- Strong Support: ₹2,800 (previous resistance turned support)
- Major Support: ₹2,400 (trendline support and psychological level)
- Critical Support: ₹2,000 (long-term ascending trendline)
Resistance Levels:
- Immediate Resistance: ₹3,745 (52-week high)
- Next Resistance: ₹4,000 (psychological round number)
- Extended Resistance: ₹4,400 (measured move projection)
- Long-term Resistance: ₹5,000
Base Formation:
- Primary Base: ₹1,200-₹1,600 range (established during deep consolidation)
- Secondary Base: ₹2,400-₹2,800 range (recent re-accumulation zone)
- The stock has clearly established a strong foundation above the ₹2,400 levels
Technical Indicators Assessment:
Momentum Indicators:
- RSI is in overbought territory but showing positive divergence
- MACD showing bullish crossover with expanding histogram
- Stochastic indicates strong upward momentum
- ADX suggesting strong trending behaviour
Moving Averages:
- Price trading well above all major moving averages
- 20 EMA, 50 EMA, and 200 EMA in perfect bullish alignment
- Strong uptrend confirmed by ascending moving averages
- No signs of trend reversal in the near term
Sectoral and Fundamental Backdrop:
AI Infrastructure Sector Outlook:
- India's IndiaAI Mission with ₹10,372 crore budget creating massive opportunities
- Government's push for sovereign AI infrastructure benefiting domestic players
- Global demand for AI computing infrastructure is experiencing exponential growth
- Limited domestic competition in the high-end computing solutions space
Company-Specific Fundamentals:
- Netweb's supercomputers have appeared 15 times across three entries in the global Top 500 supercomputers ranking
- The company is almost debt-free with a market cap of ₹20,936 crore
- Recent order wins worth ₹1,734 crore for IndiaAI Mission and ₹450 crore additional order
- Order pipeline of ₹4,142.1 crore as of June 2025, excluding new mandates
Key Growth Catalysts:
- Delivery of servers built on NVIDIA's Blackwell Architecture for India's Sovereign AI System
- Expanding presence in high-performance computing and AI systems
- Strong relationships with global technology partners
- Beneficiary of the government's Digital India and AI initiatives
Financial Performance Metrics:
- Strong revenue visibility from a large order book
- Improving profit margins due to premium product offerings
- Healthy cash flows supporting future expansion
- Zero debt structure providing financial flexibility
Strategic Outlook:
- Expect continued momentum driven by the AI infrastructure theme
- News-driven volatility possible around order execution updates
- Sector rotation into a technology infrastructure play is expected
- Quarterly results will be the key catalyst for sustained momentum
- India's AI infrastructure buildout is a multi-year opportunity
- The company is well-positioned to capture significant market share
Risk Factors to Monitor:
Technical Risks:
- Overbought conditions may lead to profit-taking
- High volatility expected given the stock's momentum
- Any break below ₹3,000 would signal trend weakness
Fundamental Risks:
- Execution risk on large government orders
- Competition from global players in AI infrastructure
- Technology disruption risks in a rapidly evolving sector
- Dependence on government spending cycles
Market Risks:
- Overall market correction could impact high-beta stocks
- Sector rotation away from technology themes
- Global supply chain disruptions affecting component availability
My 2 Cents:
NSE:NETWEB presents a compelling technical setup with strong fundamental support from India's push for AI infrastructure. The stock's breakout from multiple chart patterns, combined with substantial order wins and sector tailwinds, creates an attractive risk-reward proposition. However, position sizing and disciplined risk management remain crucial given the stock's high volatility and premium valuation.
Full Coverage on my Newsletter this Week
Keep in the Watchlist and DOYR.
NO RECO. For Buy/Sell.
📌Thank you for exploring my idea! I hope you found it valuable.
🙏FOLLOW for more
👍BOOST if you found it useful.
✍️COMMENT below with your views.
Meanwhile, check out my other stock ideas on the right side until this trade is activated. I would love your feedback.
As per the Latest SEBI Mandate, this isn't a Trading/Investment RECOMMENDATION nor for Educational Purposes; it is just for Informational purposes only. The chart data used is 3 Months old, as Showing Live Chart Data is not allowed according to the New SEBI Mandate.
Disclaimer: "I am not a SEBI REGISTERED RESEARCH ANALYST AND INVESTMENT ADVISER."
This analysis is intended solely for informational purposes and should not be interpreted as financial advice. It is advisable to consult a qualified financial advisor or conduct thorough research before making investment decisions.  Long
Long
 Long
Long
 Long
Long
 Long
Long
UltraTech Cement – Wave 4 Triangle Breakout, Wave 5 in MotionUltraTech Cement completed a higher-degree Wave 4 triangle between 12,078 and 10,047. The breakout from the E-wave low (10,047) kicked off Wave 5 .
The first breakout attempt above 12,339 was followed by a clean retest of support , keeping the structure intact.
Price is now carving out the internal subwaves of Wave 5.
Strict support / stop loss sits at 12,078 – below this, the bullish thesis fails.
RSI shows momentum rising but not yet at extreme levels – consistent with an unfolding Wave 5.
Summary:
A triangle in Wave 4 has given way to an impulsive Wave 5. As long as 12,078 holds, UltraTech Cement remains biased upward with higher targets open.
The chart will be updated as price action evolves.
Disclaimer: This analysis is for educational purposes only and does not constitute investment advice. Please do your own research (DYOR) before making any trading decisions.  Long
Long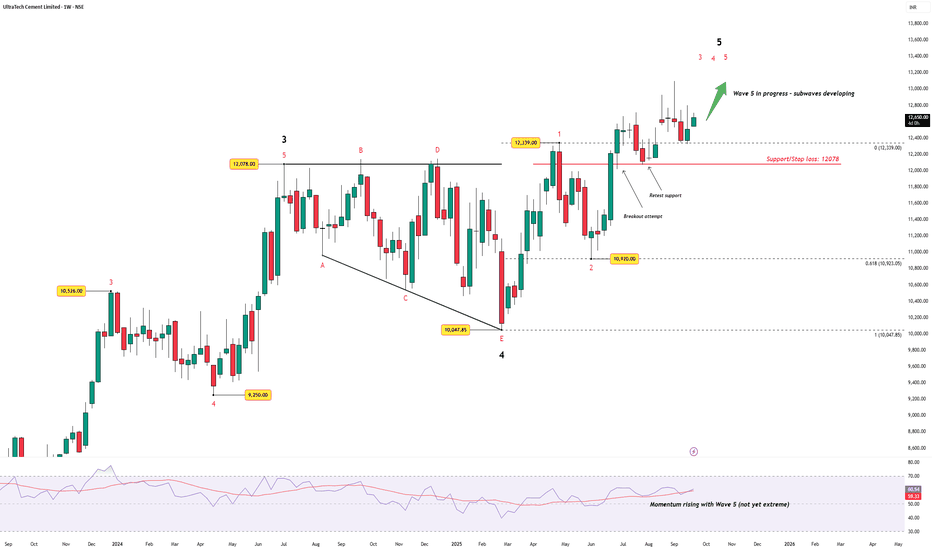
BANCOINDIA: BO after Consolidation, Chart of the WeekBanco Products Broke Out From a Consolidation, Continuing Its Massive Bull Run. Let's analyse in "Chart of the Week"
As per the Latest SEBI Mandate, this isn't a Trading/Investment RECOMMENDATION nor for Educational Purposes; it is just for Informational purposes only. The chart data used is 3 Months old, as Showing Live Chart Data is not allowed according to the New SEBI Mandate.
Disclaimer: "I am not a SEBI REGISTERED RESEARCH ANALYST AND INVESTMENT ADVISER."
This analysis is intended solely for informational purposes and should not be interpreted as financial advice. It is advisable to consult a qualified financial advisor or conduct thorough research before making investment decisions.
Price Action Analysis:
- Banco Products has completed a consolidation phase
- The stock has demonstrated exceptional momentum with a breakout above the ₹400 levels in April 2024
- Current trading price of ₹835.60 represents a gain of over 100% from the breakout point
- Price action shows strong institutional accumulation with increasing volumes during upward moves
Volume Spread Analysis
- Volume spikes are clearly visible during key breakout moments, particularly in Q2 2024
- The highest volume bars (green) coincide with price advances, indicating genuine buying interest
- Recent volume of 36.75M shares traded shows sustained institutional participation
- Volume patterns suggest smart money accumulation rather than retail speculation
Key Technical Levels:
Base Formation:
- Multi-year base formed between ₹100-400 levels from 2022 to early 2024
- This represents a classic cup and handle pattern on the weekly timeframe
- The base provided strong support and allowed for institutional accumulation
- Depth of base (approximately 18 months) suggests a strong foundation for future moves
Support Levels:
- Primary Support: ₹650-680 (previous resistance turned support)
- Secondary Support: ₹550-580 (50% retracement of recent rally)
- Major Support: ₹400-420 (breakout zone)
- Ultimate Support: ₹300 (top of multi-year base)
Resistance Levels:
- Immediate Resistance: ₹850-870 (current highs)
- Next Resistance: ₹950-1000 (psychological round number)
- Extended Resistance: ₹1200-1250 (measured move from base)
Position Sizing:
- Allocate a maximum of 3-5% of the portfolio to a single stock
- Use the pyramiding approach: 50% on initial entry, 25% on confirmation, 25% on extension
- Risk per trade should not exceed 2% of total capital
Risk Management Rules:
- Honour stop-losses strictly without emotional interference
- Book partial profits at predetermined levels
- Reduce position size if the stock shows signs of distribution
- Monitor sector rotation and overall market conditions
Sectoral and Fundamental Backdrop:
Auto Components Sector Overview:
- India's auto component industry is driving macroeconomic growth, with the market estimated to grow by USD 259.03 billion from 2025 to 2029 at a CAGR of 37%
- The auto components sector achieved 32.8% growth in FY24, with optimism for continued strong performance
- Export revenues could soar to $100 billion by 2030 from $21 billion in 2024, at a 30% CAGR
Fundamental Strengths of Banco Products:
- Market Cap of ₹11,952 crores with revenue of ₹3,379 crores and profit of ₹433 crores
- Leading manufacturer and exporter of automotive and industrial gaskets, heat shields, and sealing solutions since 1961
- Promoter holding at 67.88% shows strong management confidence
Growth Catalysts:
- Expanding electric vehicle segment creating new opportunities
- Sector attracted ₹2,45,771 crore FDI between April 2000 and December 2024
- Export potential with global OEM partnerships
- Various Indian auto component manufacturers are entering joint ventures with foreign companies for domestic production
Risks and Challenges:
- Commodity price fluctuations affecting margins
- Global economic slowdown impacting export demand
- Competition from Chinese manufacturers
- Trading at 9.17 times book value indicates a premium valuation
Market Outlook:
Short-term Outlook (1-3 months):
- Expect consolidation in the ₹750-870 range
- Watch any dip below ₹700
- Watch for a breakout above ₹870 for the next leg up
Medium-term Outlook (3-12 months):
- Sustained institutional interest expected
- Earnings growth should support price appreciation
Long-term Outlook (1-3 years):
- Export opportunities provide additional upside
- EV transition could create new revenue streams
- Sector leadership position makes it a preferred play in the auto components space
Full Coverage on my Newsletter this Week
Keep in the Watchlist and DOYR.
NO RECO. For Buy/Sell.
📌Thank you for exploring my idea! I hope you found it valuable.
🙏FOLLOW for more
👍BOOST if you found it useful.
✍️COMMENT below with your views.
Meanwhile, check out my other stock ideas on the right side until this trade is activated. I would love your feedback.
As per the Latest SEBI Mandate, this isn't a Trading/Investment RECOMMENDATION nor for Educational Purposes; it is just for Informational purposes only. The chart data used is 3 Months old, as Showing Live Chart Data is not allowed according to the New SEBI Mandate.
Disclaimer: "I am not a SEBI REGISTERED RESEARCH ANALYST AND INVESTMENT ADVISER."
This analysis is intended solely for informational purposes and should not be interpreted as financial advice. It is advisable to consult a qualified financial advisor or conduct thorough research before making investment decisions.  Long
Long
 Long
Long
 Long
Long
 Long
Long
Poonawalla Fincorp (Daily) - Potential ATH ?Poonawalla Fincorp has shown a significant bullish development, decisively breaking out of a Triangle continuation pattern today. This breakout was marked by a substantial 12.30% surge in price , backed by exceptionally high trading volume.
This move signals a potential continuation of the bullish run that began in March 2025, which itself was a reversal of a downtrend initiated by a Double-Top bearish pattern in April 2024.
Bullish Confirmation Signals 👍
The positive outlook is supported by several key indicators:
- Breakout Volume: The price surge was accompanied by a massive spike in volume , indicating strong conviction and participation from buyers.
- Momentum: Short-term Exponential Moving Averages (EMAs) have formed a positive crossover , confirming the renewed bullish momentum in the immediate term.
Immediate Hurdle Ahead 🚧
Despite the strong breakout, the stock is now trading at a crucial long-term resistance level . Overcoming this barrier is essential for the upward trend to continue.
Future Outlook and Scenarios
- Bullish Case 📈: If the upward momentum is sustained and the stock successfully breaks through the current long-term resistance, it could clear the path to test its all-time high . An initial price target in this scenario would be the ₹539 level.
- Bearish Case 📉: Conversely, if the stock fails to breach this resistance, the momentum could fade, potentially leading to a price correction towards the ₹427 support level.
Watchout for the price-action in the next few sessions !!  Long
Long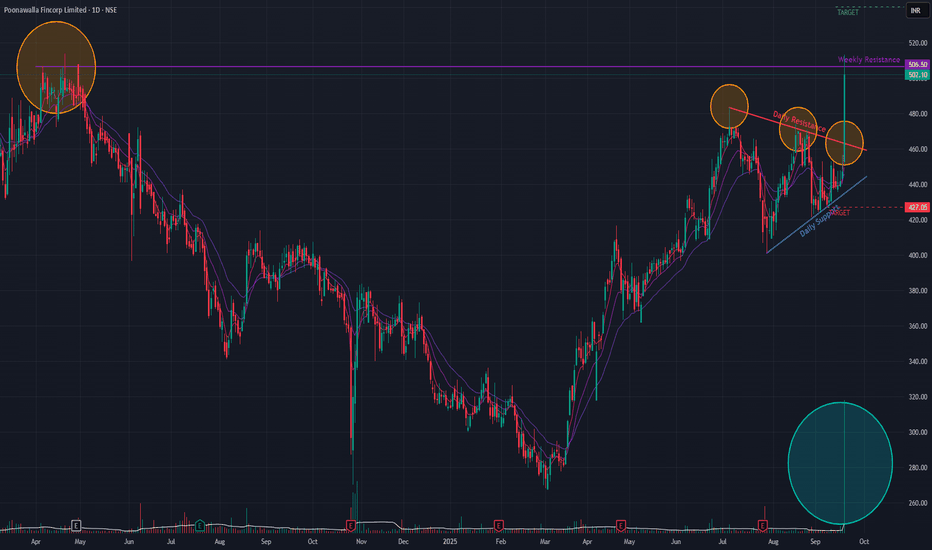
 Long
Long
 Long
Long
 Long
Long
Aegis Logistics (Daily Timeframe) - Potential Breakout ??Following a strong uptrend that peaked in July 2024, Aegis Logistics entered a multi-month consolidation phase. Despite marking a new all-time high in January 2025, the stock lacked sustained upward momentum and has since formed a clear Symmetrical Triangle pattern . This pattern typically acts as a continuation signal, suggesting the prior uptrend is likely to resume.
Recent Bullish Momentum
This week, the stock has shown a significant surge in buying interest, rallying +14.05% on the back of very high trading volume. This powerful move towards the triangle's upper boundary indicates strengthening bullish sentiment and a potential impending breakout.
Indicator Analysis
On the daily chart, short-term Exponential Moving Averages (EMAs) have already registered a bullish crossover , confirming the immediate positive momentum. While the weekly EMAs are yet to confirm a similar crossover, they are aligning positively, suggesting a longer-term bullish signal may be forming.
Future Outlook & Key Levels
The direction of the next major move hinges on the resolution of this triangle pattern.
Bullish Scenario: A decisive breakout and close above the triangle's upper trendline would confirm the pattern's continuation. The primary upside target in this case is ₹944 .
Bearish Scenario: If the stock fails to break out and instead breaches the lower trendline of the triangle, the bullish thesis would be invalidated. The key support level to watch on the downside would be ₹663 .
Watchout for the Price-action !!  Long
Long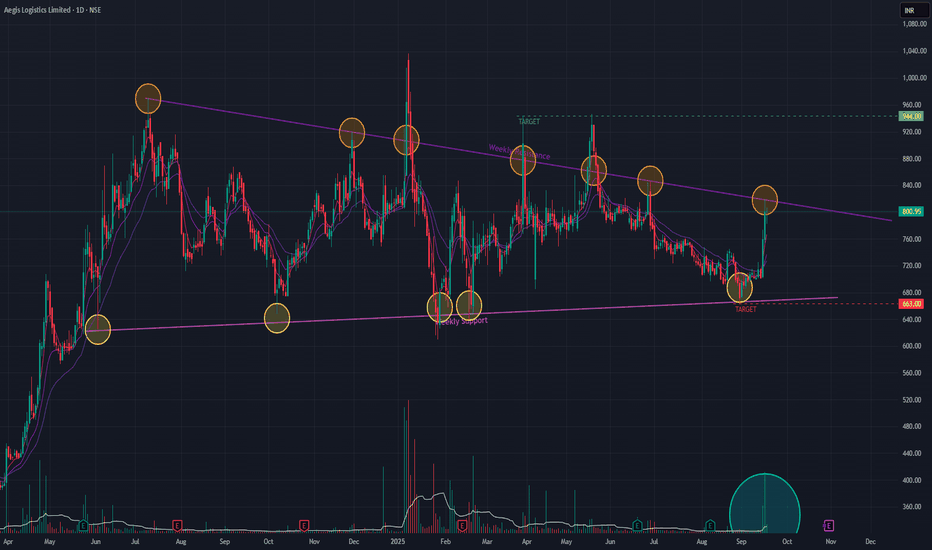
 Long
Long
 Long
Long
 Long
Long
 Long
Long