FEDERALBNK: Daily Ascending Triangle Breakout1. The Macro Perspective: The Ascending Triangle Formation
I am taking a LONG bias on Federal Bank Ltd. (FEDERALBNK) on the daily (1D) timeframe
When analyzing pure market structure on a major banking stock, consolidation patterns like the Ascending Triangle are critical for absorbing overhead supply before initiating the next leg of a secular markup. Following its previous trend, the stock entered a structural consolidation phase, carving out a high-precision ascending triangle. This digestion phase flushed out weak hands and allowed institutional capital to accumulate shares at higher lows
2. The Educational Setup: Horizontal Resistance & Ascending Support
To understand the technical validity behind this launch, look closely at how the price structure interacted with its core boundaries:
The 300.00 Resistance Ceiling: The definitive line in the sand for a bullish structural shift was the horizontal resistance line drawn at 300.00. This level established a solid supply zone that systematically capped upward momentum.
The Ascending Support: Complementing the resistance was a clear ascending support trendline. Buyers consistently stepped in to defend higher lows, creating the characteristic "squeeze" that inevitably leads to a sharp directional move once the resistance is breached.
3. Current Price Action: Breakout and Volatility Expansion
Look at the most recent daily candle on the far right of the chart. The structural pressure cooker has officially exploded. Institutional buyers have stepped in with undeniable conviction, backed by a significant volume expansion. The stock printed a strong, full-bodied green expansion candle that has decisively obliterated the 300.00 ceiling, currently trading incredibly strong near 315.10 (+3.45% on the session). The stock has officially transitioned out of accumulation and into a highly explosive markup trend into fresh blue-sky territory.
Note: As this is an all-time high breakout, ensure all exchange End of Day (EOD) data files have fully synchronized before finalizing your trade entry.
4. The Trade Plan: Entries, Targets, and Risk Management
Entry Strategy: Momentum is exceptionally strong with the stock trading vertically out in the open. Chasing an extended breakout candle carries a minor risk of a short-term mean-reversion pullback. The highest-probability entry strategy involves waiting for the initial excitement to cool off. Look to scale into long positions on a potential structural pullback to retest the broken 300.00 to 305.00 prior resistance zone. Letting old historical resistance prove itself as a concrete new support floor provides an unmatched risk-to-reward ratio.
Take Profit (Targets): By utilizing a classical measured move strategy based on the structural depth of the triangle, we can project upside targets. Taking the approximate depth of the triangle (roughly 50 points from the 250.00 low to the 300.00 ceiling) and projecting it upward from the breakout point, our primary structural target sits comfortably in the 345.00 to 350.00 zone over the coming weeks.
Invalidation (Stop Loss): An explosive breakout thesis is invalidated if the price fails to hold its newly claimed structural floor and collapses back inside the triangle boundaries. A hard stop loss should be placed safely below the recent breakout, specifically around the 290.00 to 295.00 level. A definitive daily close completely back below 290.00 would act as a severe warning sign of a failed breakout.
5. Time Horizon:
Because this technical setup captures a clear structural phase transition and a textbook triangle breakout on the 1-Day chart, this is a high-alpha swing trade designed to capture a rapid momentum markup phase. Let the trend run!  Long
Long
 Long
Long
 Long
Long
 Long
Long
 Long
Long
Motilal Oswal: Record Revenue Meets Shrinking VolumeAs a major financial services and broking firm, Motilal Oswal often acts as a mirror for the broader stock market. When trading activity peaks and retail investors rush in, these businesses scale up rapidly. Let us break down what the latest data and long-term charts are telling us, without any hype or bias.
The Technical Chart: A Late-Stage Pause
On the long-term monthly chart, the stock is in a clear, multi-year upward trend. It is currently moving through what looks like a late-stage structural cycle.
Right now, the price is taking a breather in a wave 4 correction. This pause is normal after a large upward move. The price may continue to chop sideways for a while, potentially forming a triangle pattern before it attempts its next major move higher.
Volume and Momentum Check
A key detail on the chart is the trading volume. While the price has been pausing and pulling back, the volume has been steadily shrinking. This contraction is generally a healthy sign. It shows that the price drop is due to a lack of buyers during a rest period, rather than aggressive, large-scale selling by big institutions.
Additionally, the momentum index has cooled down from an overheated zone to a neutral level, giving the stock necessary breathing room.
The Invalidation Level: 513
When looking at this specific chart structure, there is one critical level to watch: 513 .
This level represents the absolute line in the sand for the current trend structure. As long as the price remains above 513 , the upward structural outlook remains valid. If the market drops below 513 , this specific wave structure is completely broken and invalid, meaning a much deeper or longer downward cycle is taking place.
The Fundamentals: High Growth with High Volatility
The business side shows a clear contrast between massive growth and short-term cost pressures.
Total revenue has been on a powerful, multi-year upward climb, reaching a record high of 94.16 billion in 2026. This shows the core business engine is running fast. However, cash flows in this sector are highly volatile. Free cash flow recovered well to 14.29 billion recently, completely reversing a steep drop from the previous year.
The main point of caution is the recent quarterly operating margin, which dipped into a negative 6.95 percent loss due to a sudden rise in short-term expenses. Because the stock trades at a premium valuation with a P/E ratio around 31, the market expects the company to fix these margin pressures quickly and keep growing.
What This Means for the Bigger Market
A strong performance from brokerage stocks is generally a good sign for the broader index like the Nifty, because it confirms that liquidity is high and retail traders are active.
However, because the chart shows a late-stage wave pattern, it serves as a reminder that the broader market cycle is maturing. It suggests a market environment where managing risk and watching key support levels is much more practical than blind optimism.
Disclaimer: This post is for educational purposes only and is not financial advice. I am not a SEBI-registered analyst. Please do your own research and manage your risk carefully. Axis Bank: Analyzing the Current Triangle and Key LevelsAxis Bank is currently trading at 1,365.70 . Over the past few months, the price action has started to tighten significantly, moving into a well-defined technical range. By studying the chart structure and momentum, we can map out the two most likely paths ahead without bias.
The Chart Pattern: A Contracting Triangle
The structure starting from the peak of 1,418.30 looks like a classic contracting triangle. This pattern consists of five waves (A-B-C-D-E) that reflect a balance between buyers and sellers as volatility shrinks.
Wave A dropped to a low of 1,150.30 .
Wave B rallied to a lower high of 1,391.00 .
Wave C formed a higher structural low at 1,222.10 .
Wave D is currently testing the upper descending resistance line near 1,378.00 .
By connecting the lows of Wave A and Wave C, we get a upward-sloping support line. This gives us a clear geometric boundary for the bottom half of the pattern.
The Momentum Signal: RSI Divergence
The Daily RSI is currently reading 68.33 , which is near the overbought boundary.
Looking closely at the indicator, the RSI has printed a higher high compared to its peak during Wave B. However, the actual stock price has printed a lower high ( 1,378.00 versus 1,391.00 ). This setup is known as a hidden bearish divergence. It tells us that the market is using a lot of momentum to push the price up, yet it is still failing to cross the previous highs. This often warns that the upward move is getting tired near major resistance.
Primary Scenario: The Wave E Pullback
Because the price is meeting the upper trendline resistance and showing momentum exhaustion, the primary expectation is a near-term rejection.
If the 1,378.00–1,391.00 resistance zone holds, the price will likely turn down to form the final leg of the triangle, Wave E . This downward move is expected to find support along the lower ascending trendline, roughly around the 1,280.00–1,300.00 area. A successful hold there would complete the triangle and set up the foundation for a larger upward breakout later on.
Alternative Scenario and Key Invalidation
Markets can surprise us, so it is vital to know when a chart pattern is no longer valid.
If buyers find strong volume and push the price cleanly out of the top of the triangle, our expectation of a pullback changes. A daily candlestick close above 1,391.00 invalidates the contracting triangle pattern. Crossing this level means the corrective phase likely ended early at the Wave C low, opening the door for the stock to immediately test the major structural high at 1,418.30 .
Summary of Key Levels to Watch
Current Price: 1,365.70
Immediate Overhead Resistance: 1,378.00 – 1,391.00
Expected Support Zone (Wave E): 1,280.00 – 1,300.00
Pattern Invalidation Level: A daily close above 1,391.00
Disclaimer: This post is for educational purposes only and is not financial advice. I am not a SEBI-registered analyst. Please do your own research and manage your risk carefully.  Long
Long
Fine Organic Industries Ltd. (Weekly Chart) symetrical traingleFine Organic Industries Ltd. (Weekly Chart) symetrical traingle breakout awaited.
Observation: Symmetrical Triangle / Ascending Compression Setup
Fine Organic is trading inside a long-term compression zone. Price has respected the rising trendline support and is now consolidating just below a major descending trendline resistance near ₹5,000–₹5,120.
The highlighted yellow box shows a tight consolidation after a sharp bounce from support, which often precedes an expansion move.
RSI (20):
* RSI is at 57.5, above its moving average (52.3).
* Momentum is improving and remains above the 50 zone.
* No significant bearish divergence is visible on the weekly timeframe.
Key Levels
Resistance Zones
* ₹5,000–₹5,120 (triangle breakout zone)
* ₹5,494
* ₹5,958
* ₹7,321 (major long-term target)
Support Zones
* ₹4,700
* ₹4,400
* Rising trendline support near ₹4,150–₹4,250
Trading View
✅ Sustained weekly close above ₹5,120 can confirm a triangle breakout and may trigger momentum towards ₹5,494 and ₹5,958.
✅ If volume expands during the breakout, the stock may eventually attempt the larger target zone around ₹7,321.
⚠️ Failure to break resistance and a close below ₹4,700 may lead to renewed consolidation within the pattern. Long 
 Long
Long
QPOWER: Weekly Structural Breakout & Trendline Support1. The Macro Perspective: The Structural Shift
I am taking a LONG bias on Quality Power Electrical Equipments Ltd. (QPOWER) on the weekly (1W) timeframe. When analyzing market structure on this counter, we see a textbook structural transition. Following a corrective phase, the stock built a firm base, defended higher lows via an ascending trendline, and has now cleared the critical overhead supply zone. Documenting these specific technical patterns—where trendline support meets horizontal breakout—is key to identifying high-probability momentum entries.
2. The Educational Setup: Horizontal Resistance & Ascending Support
To understand the technical validity behind this launch, look closely at how the price structure interacted with its core boundaries:
The 1,060 Horizontal Resistance: This level acted as the definitive "neckline" for the structure. It capped the upside for several weeks, creating a clear supply zone that had to be conquered to initiate the next leg.
The Ascending Support Trendline: Complementing the resistance was a sharp ascending support trendline. This line proved that buyers were consistently willing to step in at higher prices, essentially squeezing the price against the 1,060 ceiling until the breakout occurred.
3. Current Price Action: Breakout and Momentum
The structural pressure has successfully resolved to the upside. The price has printed a strong series of green candles and is currently trading at 1,205.00. This confirms the breakout from the 1,060 horizontal resistance. The stock is now trading in fresh territory, signaling that the supply at the breakout zone has been absorbed, and the markup phase is active.
Note: Always allow for the weekly candle to close to ensure the breakout holds without leaving a large upper wick.
4. The Trade Plan: Entries, Targets, and Risk Management
Entry Strategy: Momentum is currently strong. For those who did not catch the initial breach, the highest probability entry is a "structural retest." Look to scale into long positions on any potential consolidation or minor pullback that brings the price back to retest the 1,060 to 1,080 prior resistance zone. Letting the old ceiling confirm itself as a new floor is a classic risk-reduction technique.
Take Profit (Targets): By utilizing a measured move based on the structural depth of the base, we can project upside targets. Taking the distance from the recent low (~600) to the breakout (1,060) and projecting that 460-point expansion upward, our primary structural target sits near the 1,500 to 1,520 zone.
Risk Management: An explosive breakout thesis is invalidated if the price fails to hold the trendline and falls back decisively below the breakout level. A hard stop loss should be placed safely below the trendline support, specifically around the 950.00 to 980.00 level.
5. Time Horizon:
Because this technical setup captures a clear structural phase transition on the 1-Week chart, this is a position trade designed to capture a sustained momentum markup phase over the coming months. Let the trend run!  Long
Long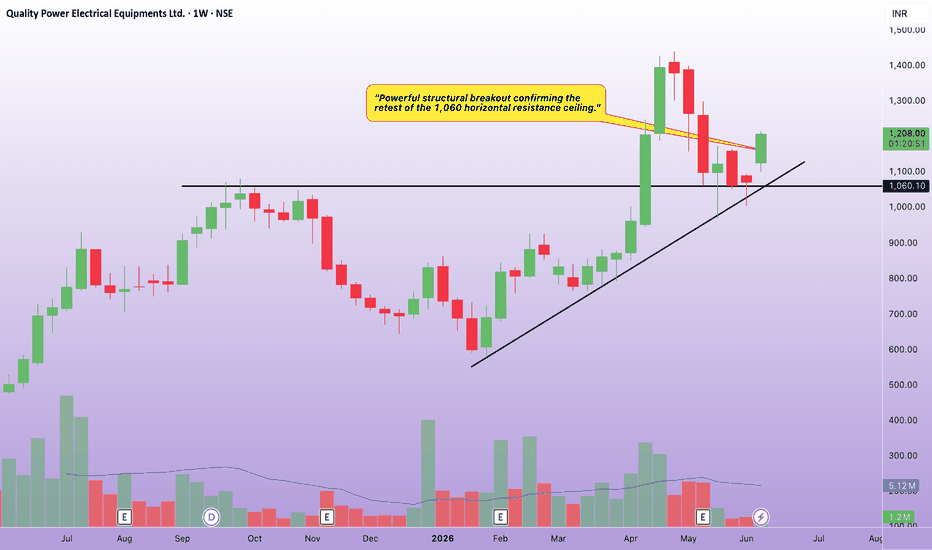
 Long
Long
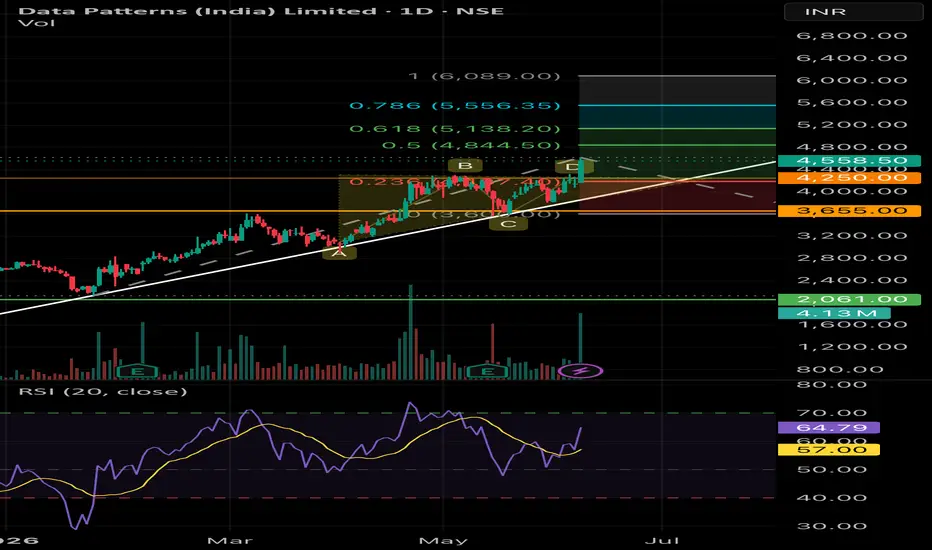
DATA PATTERNS (INDIA) LTD | Trend-Based Fibonacci ProjectionDATA PATTERNS (INDIA) LTD | Trend-Based Fibonacci Projection
The stock continues to maintain its long-term bullish structure, respecting the rising trendline and forming a series of higher highs and higher lows. After a healthy consolidation phase, price is showing signs of resuming the primary uptrend.
Using Trend-Based Fibonacci projections, the following levels will be crucial to watch:
Upside Targets
🔹 ₹4,845 – 50% Fib Projection
🔹 ₹5,138 – 61.8% Fib Projection
🔹 ₹5,556 – 78.6% Fib Projection
🔹 ₹6,089 – 100% Fib Projection
Support Levels
🔸 ₹4,150–₹4,200 – Immediate support zone
🔸 ₹4,050–₹4,100 – Trendline support
🔸 ₹3,655 – Major structural support
RSI has recovered strongly and is trading above its signal line, indicating improving momentum. As long as the stock sustains above the immediate support zone, the probability of testing higher Fibonacci projection levels remains favourable.
Also, The stock appears to be forming a symmetrical triangle after a strong uptrend, indicating a period of consolidation before the next directional move. Price action is gradually compressing between rising support and falling resistance, suggesting that a significant breakout.
A sustained breakout above the triangle resistance zone around ₹4,350–₹4,400 could confirm the continuation of the primary bullish trend.
A decisive move above recent swing highs could accelerate momentum toward the ₹4,845 and ₹5,138 zones, while maintaining the broader bullish outlook.
Disclaimer: This analysis is shared for educational and informational purposes only and does not constitute investment advice. Markets are subject to risk and uncertainty. Please conduct your own research and use proper risk management before making any trading or investment decisions.  Long
Long
 Long
Long
IZMO: Weekly Symmetrical Triangle Breakout1. The Macro Perspective: The Symmetrical Triangle Formation
I am taking a LONG bias on IZMO Limited (IZMO) on the weekly (1W) timeframe
When analyzing pure market structure on an IT/software services leader, extended consolidation patterns like the Symmetrical Triangle are essential to absorb supply and build kinetic energy. Following its previous high, the stock entered a protracted digestion period spanning several months. During this time, the price action narrowed into a clean, high-precision triangle squeeze. This period allowed institutional capital to systematically reposition, effectively coiling the spring for the next primary trend move.
2. The Educational Setup: Dynamic Boundaries
To understand the technical validity behind this macro launch, look closely at how the price structure interacted with its core boundaries:
The Upper Descending Resistance: The definitive ceiling for the breakout was the upper diagonal resistance line, which systematically rejected multiple attempts at higher valuations throughout early 2026.
The Lower Ascending Support: Complementing the resistance was an ascending support line. Buyers consistently stepped in to defend higher lows, creating the characteristic "squeeze" that inevitably leads to a sharp directional move once the apex is breached.
3. Current Price Action: Breakout and Volatility Expansion
Look at the massive weekly candle on the far right of the chart. The structural pressure cooker has officially exploded. Institutional buyers have stepped in with undeniable conviction, backed by a significant volume expansion. The stock printed a towering, full-bodied green expansion candle that has decisively pierced through the upper triangle resistance, currently trading strong at 917.40 (+22.17% on the session). The stock has officially transitioned out of its macro squeeze and into a highly explosive markup trend into fresh price discovery territory.
Note: Always ensure the exchange's End of Day (EOD) data files have fully synchronized before confirming the final weekly close shape. Wait until the close to account for any data synchronization, ensuring no false breakouts appear on the chart.
4. The Trade Plan: Entries, Targets, and Risk Management
Entry Strategy: Momentum is exceptionally strong with the stock trading vertically out in the open above the triangle apex. Chasing an extended breakout candle carries a minor risk of a short-term mean-reversion pullback. The highest-probability entry strategy involves waiting for the initial vertical excitement to cool off. Look to scale into long positions on a potential structural pullback that perfectly retests the broken upper triangle trendline. Letting old diagonal resistance prove itself as a concrete new support floor provides an unmatched risk-to-reward ratio.
Take Profit (Targets): We use a classical measured move strategy for triangle breakouts. By taking the widest part of the triangle (the distance from the start of the pattern at the 550.00 area up to the 950.00 high) and projecting it upward from the breakout point, our primary structural macro target sits comfortably in the 1,200.00 to 1,300.00 zone over the coming months.
Invalidation (Stop Loss): An explosive breakout thesis is completely invalidated if the price fails to hold its newly claimed structural floor and collapses back inside the core of the triangle boundaries. A hard stop loss should be placed safely below the ascending trendline and recent swing lows, specifically around the 680.00 to 720.00 level. A definitive weekly close completely back below 680.00 would act as a severe warning sign of a failed breakout and a major bull trap.
5. Time Horizon:
Because this technical setup is built on a 1-Week chart capturing a clear structural phase transition and a textbook triangle breakout, this is a high-alpha position trade designed to capture a sustained secular markup phase over the coming quarters. Let the trend run!  Long
Long
 Long
Long
AVALONhas explosively broken out of a massive ascending triangle1. The Macro Perspective: The Institutional Staircase
I am taking a LONG bias on Avalon Technologies Limited (AVALON) on the weekly (1W) timeframe.
When analyzing pure market structure, the most powerful and sustainable breakouts occur in alignment with an established macro trend. Look at the massive structural development on this chart. The defining feature is the steep, unbroken ascending trendline (the lower solid black line). Every single time the stock experienced a pullback, institutional buyers aggressively stepped in exactly at this dynamic support line. They refused to let the secular bull trend break, consistently printing higher lows and indicating massive, systemic accumulation over the long term.
2. The Educational Setup: The Squeeze and The Ceiling
To understand the sheer strength of this current breakout, look at how the price systematically squeezed historical resistance to form a textbook "Ascending Triangle":
The Concrete Ceiling: The stock's recovery was heavily capped by a formidable horizontal resistance line at 1,264.45. Sellers repeatedly defended this extreme high, creating a clear supply ceiling.
The High-Level Squeeze: Notice how the pullbacks became shallower over time, riding the ascending trendline and the 20 SMA (the middle blue line of your Bollinger Bands). By pressing up against the flat horizontal ceiling while simultaneously forming higher lows, the stock acted like the ultimate pressure cooker. It gracefully transferred shares from impatient retail traders to strong-handed institutional buyers, storing immense kinetic energy as the structure tightened.
3. Current Price Action: Riding the Upper Band into Blue Sky
Look at the most recent weekly candles on the far right. The high-level pressure cooker has absolutely exploded. Buyers have effortlessly shattered the 1,264.45 macro ceiling with a massive, full-bodied green momentum thrust, pushing the price well past the 1,400 mark. Furthermore, notice how the price has violently pierced the upper Bollinger Band, forcing the bands to rapidly expand upward. By decisively clearing this extreme resistance zone, AVALON has officially entered "Blue Sky Territory" (pure price discovery). All historical overhead supply has been completely eliminated.
4. The Trade Plan: Entries, Targets, and Risk Management
Entry Strategy: Momentum is exceptionally strong right now near 1,464.40. Chasing a massive vertical expansion candle that is riding outside the weekly Bollinger Bands always carries a higher risk of an immediate intraday or daily mean-reversion pullback as the stock breathes. The highest-probability, lowest-risk entry involves stepping down to a daily timeframe and waiting for the dust to settle. Look to place limit orders to catch a potential structural pullback to perfectly retest the 1,260.00 to 1,300.00 breakout zone. Letting that heavy historical resistance prove itself as a new, indestructible support floor offers a phenomenal risk-to-reward ratio.
Take Profit (Targets): Because the stock is breaking out of a massive macro structure into pure price discovery, we use measured targets based on the depth of the pattern. By taking a conservative depth of the ascending triangle (roughly 600+ points from the ~646 mid-base up to the 1,264.45 ceiling) and projecting it upward from the breakout line, our primary structural macro target sits comfortably in the 1,850.00 to 1,900.00 zone. The immediate psychological milestone will be the 1,500.00 mark.
Invalidation (Stop Loss): A trade thesis is only valid if the new market structure holds. A hard stop loss should be placed safely below the breakout line and the rising 20 SMA, around the 1,100.00 to 1,150.00 level. A definitive weekly close completely back inside the triangle and breaking below the ascending trendline would invalidate the immediate continuation thesis and signal a severe macro bull trap.
5. Time Horizon:
Because this technical setup is built on a 1-Week chart capturing a massive structural phase transition and volatility expansion, this is a medium-to-longer-term position trade designed to capture the explosive new markup phase. Let the new trend run!  Long
Long
ILMN: Weekly Ascending Triangle Breakout1. The Macro Perspective: The Multi-Month Accumulation Base
I am taking a LONG bias on Illumina, Inc. (ILMN) on the macro weekly (1W) timeframe.
When analyzing pure market structure on a biotechnology leader, prolonged consolidation patterns are necessary to build kinetic energy for the next major thrust. Following a severe markdown phase throughout 2025, the stock carved out a massive structural bottom and entered a prolonged accumulation phase. This ascending triangle formation successfully absorbed overhead supply while institutional capital quietly accumulated shares at progressively higher levels. Fundamentally, this technical momentum is strongly supported by the company's recent Q1 2026 earnings report. Illumina delivered strong revenue of $1.09 billion, representing a 4.8% year-over-year increase, and reported a non-GAAP EPS of $1.15. Based on robust clinical demand, management even raised their full-year revenue guidance to roughly $4.57 billion. Furthermore, on May 28, 2026, the company announced the launch of an innovative whole-genome sequencing solution aimed at advancing molecular residual disease (MRD) research for cancer, providing a significant fundamental catalyst for future growth.
2. The Educational Setup: Horizontal Resistance and Ascending Support
To understand the absolute technical validity behind this launch, look closely at how the price structure interacted with its core boundaries prior to breaking out:
The 152.34 Resistance Ceiling: The definitive line in the sand for a macro trend reversal was the solid black horizontal resistance line drawn at 152.34. This level acted as a heavy supply zone over the past year, systematically capping upward momentum and rejecting breakout attempts.
The Ascending Trendline: Notice how every deep structural pullback since early 2025 was heavily defended by buyers at progressively higher levels, forming the solid black diagonal support line. This sequence of higher lows steadily squeezed volatility directly beneath the breakout zone, building immense structural pressure.
3. Current Price Action: Breakout and Volatility Expansion
Look at the most recent weekly candle on the far right of the chart. The structural pressure cooker has officially exploded. Driven by the strong earnings and new product pipeline, institutional buyers stepped in with undeniable conviction. The stock printed a massive, full-bodied green expansion candle that decisively obliterated the 152.34 ceiling, currently trading strong near 164.28. This explosive thrust confirms that the asset has officially transitioned out of the accumulation phase and into a highly explosive secular markup trend into fresh territory.
4. The Trade Plan: Entries, Targets, and Risk Management
Entry Strategy: Momentum is exceptionally strong with the stock trading vertically out in the open above the pivotal breakout line. Chasing an extended weekly breakout candle carries a minor risk of a short-term, lower-timeframe mean-reversion pullback. The highest-probability, lowest-risk entry strategy involves stepping down to the daily timeframe and looking to scale into long positions on a potential structural pullback that perfectly retests the broken 148.00 to 153.00 prior resistance zone. Letting old historical resistance prove itself as a concrete new support floor provides an unmatched risk-to-reward ratio.
Take Profit (Targets): By utilizing a classical measured move strategy based on the structural depth of the ascending triangle pattern, we can project upside targets. Taking the approximate depth of the range (roughly 70 points from the structural floor near 80.00 up to the 152.34 ceiling) and projecting it upward from the breakout point, our primary structural macro target sits comfortably in the 215.00 to 225.00 zone over the coming quarters as price discovery continues.
Invalidation (Stop Loss): An explosive breakout thesis is completely invalidated if the price fails to hold its newly claimed structural floor and collapses back inside the core of the base boundaries. A hard stop loss should be placed safely below the diagonal trendline and the recent weekly higher lows, specifically around the 130.00 to 135.00 level. A definitive weekly close completely back below 130.00 would act as a severe warning sign of a failed macro breakout and a major bull trap.
5. Time Horizon:
Because this technical setup is built on a 1-Week chart capturing a clear structural phase transition and a major horizontal breakout, this is a longer-term position trade designed to capture a rapid momentum markup phase over the coming months. Let the macro trend run!  Long
Long