Libas - Potential Bullish Divergence in Descending TriangleLibas Designs Ltd. is currently trading within a descending triangle pattern. A potential bullish divergence between the price action and the RSI could indicate an upcoming trend reversal.
Technical Analysis:
Descending Triangle Pattern: The stock has been consolidating within a descending triangle pattern, characterized by lower highs and a strong support level around ₹16.5.
Lower Low in Price: The price recently made a lower low, near the support level of the triangle.
Higher Low in R
Triangle
SJVN Analysis for Long Term!NSE:SJVN Analysis!
SJVN Analysis on a Daily Timeframe!
Triangle Pattern formation in SJVN!
Triangle Pattern Breakout in SJVN!
Analysis:
SJVN was trading in a Triangle pattern. Yesterday it gave a powerful breakout to its resistance line with significant amount of volume. Also consider the 20, 50, 100 period EMA as these are also acting as a Support and Resistance as the price is respecting them it is moving ahead with them. Rest of the Analysis is on the chart itself please study it th
Indus tower near a strong demand zoneIndus tower is in continuous downtrend and now, it is on a strong weekly demand zone.
A small pull back, at least can be expected from this level. Even for a continuation of bear trend, a lower high has to be made.
However, entry can be confirmed only when there is a small breakdown from the level and subsequent strong buying is done, i.e. a bear trap.
BANKNIFTY LONGBankNifty is trading in a consolidation of an ascending triangle with a strong resistance at 52750-52800. Market is being cautious before the budget and quarterly results of major private sector banks.
BNF is sustaining at 52400-52450. A strong closing above 52500 will help to test the next resistance. A breakout above 52800 with a day closing will extend this rally to 53300 and lifetime high to touch 52500.
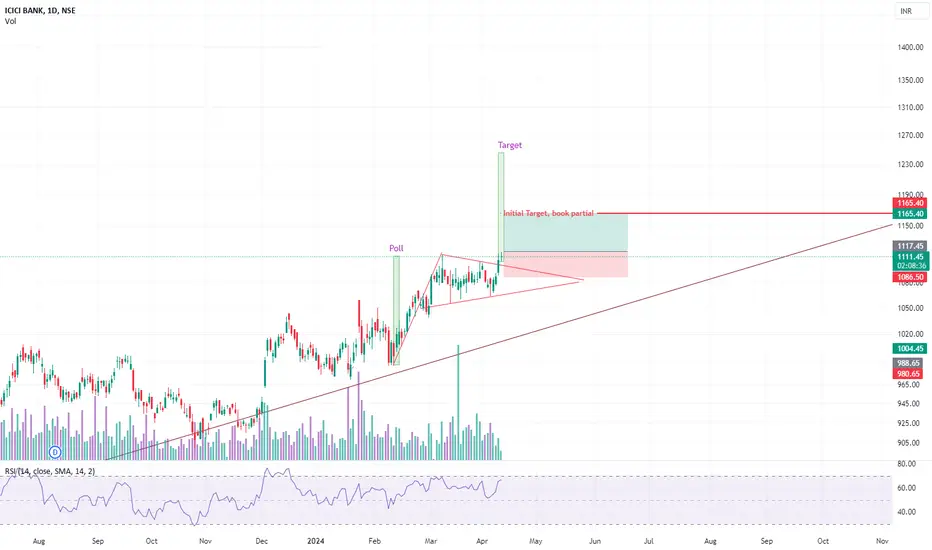
ICICI Bank: A Lucrative Triangle Breakout for Swing TradersTraders, a golden opportunity unfolds as ICICI Bank exhibits a compelling triangle breakout, marking a significant turn for those eyeing short-term gains. This technical pattern, a harbinger of potential upward momentum, invites us to dive deeper and explore the swing trading prospects it presents.
Key Observations:
Breakout Confirmation: The breakout is validated by a surge in trading volume, an essential indicator of the strength behind the move.
Support and Resistance Levels: Post-br
Mighty Nifty - July 18We had a choppy and narrow range movement yesterday. now it is at support. Sustaining above 24600 is important to be bullish.
Pattern : Consolidation.
Range : Medium.
Trend strength : Normal.
Buy Above : 24620.
Stop Loss : 24580.
Targets : 24660, 24700, 24740 and 24780.
Sell below : 24500.
Stop Loss : 24540.
Targets : 24460, 24420 and 24380.
Check the live market updates.
Hit the like button to Rock !! Show some energy !!
Note : This is my pre market analysis and my trading journal. Not a su
SWSOLAR - Start of Up-Leg in a triangle consolidation.NSE:SWSOLAR
Company Info:
Sterling & Wilson Renewable Energy Ltd. provides solar engineering, procurement and construction (EPC) solutions. The firm provides EPC services primarily for utility-scale solar power projects with a focus on project design and engineering and manage all aspects of project execution from conceptualizing to commissioning.
Technical Chart:
Day chart analysis. 🧐
🔹Trend: The stock is in a major up trend but recently it went into a triangle consolidation.
🔹Swing: It i
INFOSYS LTD LONG Key Points to consider-
1. The stock finally showed a multi-pattern breakout from the ascending triangle and the
rounding bottom pattern in a weekly time frame.
2. Good volume buildup can also be visible for several weeks.
3. Entry can be made upon breaking the previous day's high levels of 1739.
Disclaimer- This is only for study purposes and not a buy recommendation
PEL | Swing Trade | Ascending Triangle & Channel BreakoutPEL | Swing Trade | Ascending Triangle & Channel Breakout
Chart Analysis
1) Channel pattern breakout
2) Ascending triangle breakout
3) Breakout after longtime
PLong
CHENNAI PETRO - Swing Trade Analysis - 11th July #stocksCHENNAI PETRO (1D TF) - Swing Trade Analysis given on 11th July, 2024
Pattern: ASCENDING TRIANGLE BREAKOUT
- Weekly Resistance Breakout - Done ✓
- Volume Buildup at Resistance - Done ✓
- Demand Zone Retest & Consolidation (for a Small SL and a better RR) - In Progress
Please Note:
- Since the market is at a precarious spot at its levels, we need to be careful & mindful with our entries and position sizing
- Always work in probabilities and always keep your SL in play constantly
* Disclaimer
SUMICHEM : Breakout Candidate#SUMICHEM #patterntrading #chartpattern
SUMICHEM : Swing Trade
>> Ascending Triangle Pattern
>> Trending Setup
>> Good Strength & Volume in Stock
>> Good Risk Reward Trade
Swing Traders can lock profit at 10% and keep trailing
Please give a Boost or comment if u r Liking the analysis & Learning from it. Keep showing ur Love by following
Disclaimer : This is not a Trade Recommendations & Charts/ stocks Mentioned are for Learning/Educational Purpose. Do your Own Analysis before Taking positio
HOW TO USE DESCENDING TRIANGLE AS A SETUP?This is Berger Paint stock. In this stock Descending triangle is forming.
* What is the Descending triangle pattern?
- A descending triangle is a chart pattern used in technical analysis created by drawing one
trend line connecting a series of lower highs and a second horizontal trend line connecting a
series of lows.
A regular descending triangle pattern is commonly considered a bearish chart pattern or a
continuation pattern with an established downtrend. However, a descending
Triangle Pattern Breakout is on the way in IndiaMart IntermeshHello everyone i hope you all will be doing good,, today i have brought a stock which is still trading inside the triangle pattern, but there is higher probability we will see huge breakout very soon with huge volume on all time frame. Stock is really good name is IndiaMART, and it is the first and largest B2B digital marketplace in the country, today stands out as a game-changer on the B2B landscape. It focuses on integrating the Small and Medium Businesses (SMEs) into the new paradigm with spe
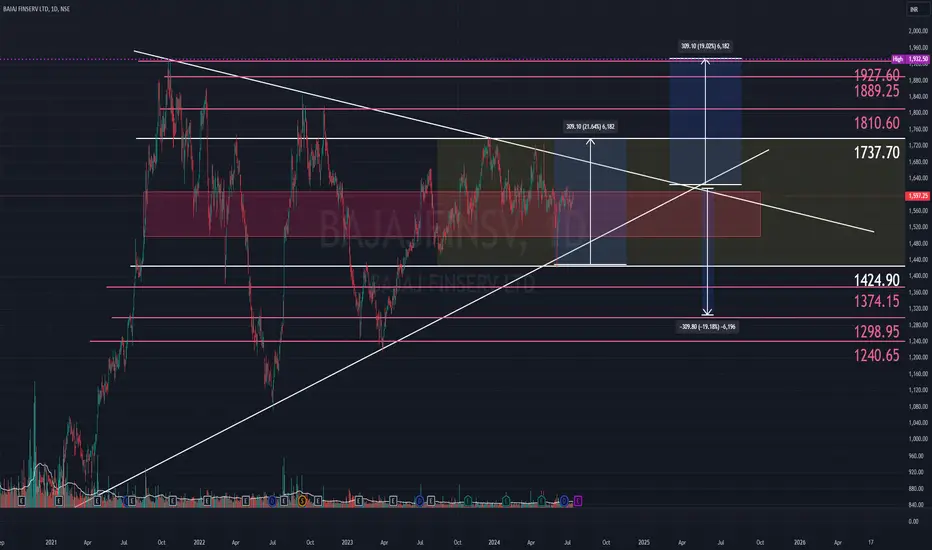
Symmetrical Triangle Pattern followed by chart from 20/11/2020Interesting! Symmetrical Triangle pattern started on 20th Nov 2020 and stock is wondering in this pattern till 14th July 2024. We are waiting for a breakout but can't expect a huge target because it started long ago. If it breaks after the white line is marked on both sides, I have given an expected level. It's a probability that it will follow the levels. It's a Bajaj Finserv Ltd chart on your Radar.
GTPL - Symmetrical Triangle Breakout with Retest - Bullish LongGTPL Hathway Ltd. (NSE: GTPL) has recently broken out of a symmetrical triangle pattern on the daily chart. The breakout has been followed by a successful retest, indicating a strong bullish signal.
A Symmetrical Triangle Breakout would indicate a continuation of prior trend, which is bullish in the long-term, as shown by the Monthly Chart below.
I have also given a possible long-term channel for GTPL. The support at the bottom of the channel has been tested multiple times, as shown. We'l