Short
Short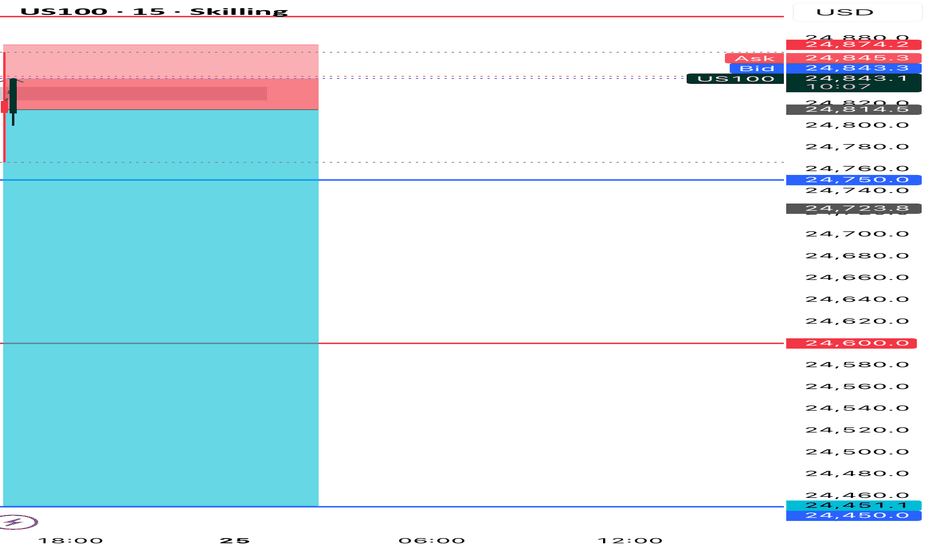
US 100 Index – Preparing for the Impact of AI Bellwether Nvidia’As if traders of the US 100 index haven’t already got enough to worry about with the recent upheaval surrounding global trade, related to Friday’s US Supreme Court decision to rule President Trump’s reciprocal tariffs as illegal, which was quickly followed by the White House’s use of other powers to reinstate a tariff of 15% on all imports into the US. Tomorrow, sees Nvidia, the biggest company in the world by market capitalisation and AI bellwether, report its quarterly earnings after the close.
This may be an even bigger event for traders to digest, given the recent sentiment wobble centered around the size of capital expenditure being committed to AI projects, and the debate about when this colossal spending may start to produce a meaningful revenue payoff. Not only that, but February has also seen several nasty sell-offs in the US 100 related to the potential negative impact of AI on the current business models of many businesses from software to wealth management. The latest of which was yesterday, which saw IBM shares experience their worst 1 day fall in over 20 years.
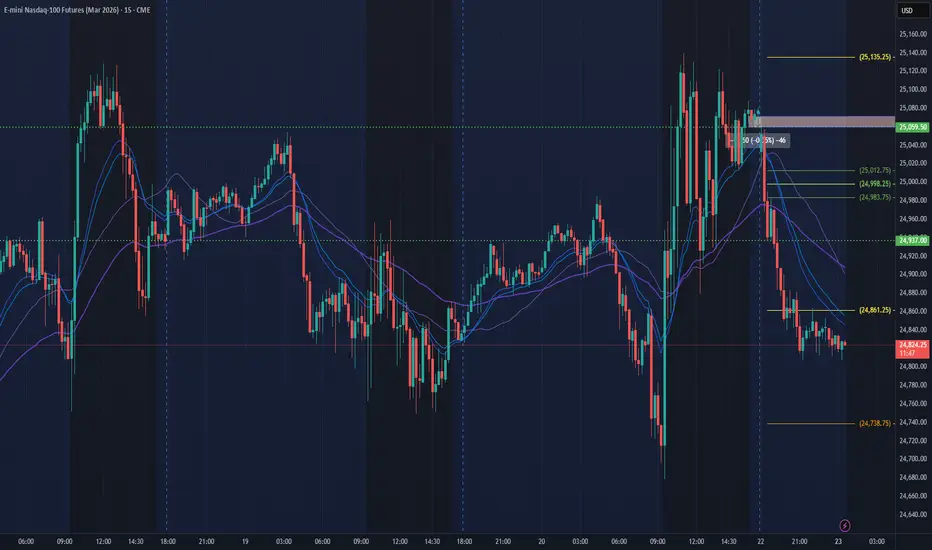
On Friday, after the initial headline confirming the US Supreme Court’s decision on reciprocal tariffs, the US 100 index eventually rallied 1% into the close, ending the week at 25012, however after a having a weekend to digest the news and consider what the Nvidia results could mean for pricing, traders came back selling on Monday, taking the index back down to a low at 24611, before bouncing back to current levels around 24780 (0630 GMT).
Where the index moves from here could depend not only on comparing the actual results of Nvidia, against lofty expectations, but also on what the company says about future revenue and demand, alongside how it is adjusting to threats to its chip business from a variety of competitors racing to join the space.
It could be a very nervy and volatile end to the week and assessing the technical outlook to identify key levels that may be relevant when the US 100 index starts to move could be helpful for structuring new and existing trades.
Technical Update: The Battle Between Buyers And Sellers Continues
Currently a tug‑of‑war is taking place between buyers and sellers of the US 100 index which is helping to create choppy price action. The wide range is defined by the October 30th high at 26277 and the November 21st low at 23834. This balanced, sideways theme remains intact, and a decisive closing break above 26277 or below 23834 is needed to signal the next significant directional move.
With no clear indication yet of which direction a breakout may take, staying aware of relevant closer support and resistance levels can be helpful, especially during a period where price volatility could well increase sharply due to the release of Nvidia’s earnings tomorrow.
Potential Support Levels:
While support at 23834 remains the key area to watch, there is a closer level that could be worth monitoring at 24142. This corresponds to the February 6th session low. A sustained close below 24142 could open the way for a retest of the more significant 23834 support.
Closing breaks below 23834 may increase the risk of a deeper decline. Such a break could open the way for a move toward 23207, which is the 61.8% Fibonacci retracement, and potentially even 22678, the August 1st session low.
Potential Resistance Levels:
Immediate resistance could sit near 25078, a level aligned with the Bollinger mid‑average. A sustained close above this level may be needed to signal momentum is building for a move to higher levels.
Successful closes above the 25078 level, could open the way for challenges of the next resistance at 25379, which is the February 11th high. If that level were to be broken on a closing basis, attention may then turn toward the more significant October 30th high at 26277.
The material provided here has not been prepared accordance with legal requirements designed to promote the independence of investment research and as such is considered to be a marketing communication. Whilst it is not subject to any prohibition on dealing ahead of the dissemination of investment research, we will not seek to take any advantage before providing it to our clients.
Pepperstone doesn’t represent that the material provided here is accurate, current or complete, and therefore shouldn’t be relied upon as such. The information, whether from a third party or not, isn’t to be considered as a recommendation; or an offer to buy or sell; or the solicitation of an offer to buy or sell any security, financial product or instrument; or to participate in any particular trading strategy. It does not take into account readers’ financial situation or investment objectives. We advise any readers of this content to seek their own advice. Without the approval of Pepperstone, reproduction or redistribution of this information isn’t permitted.
Long 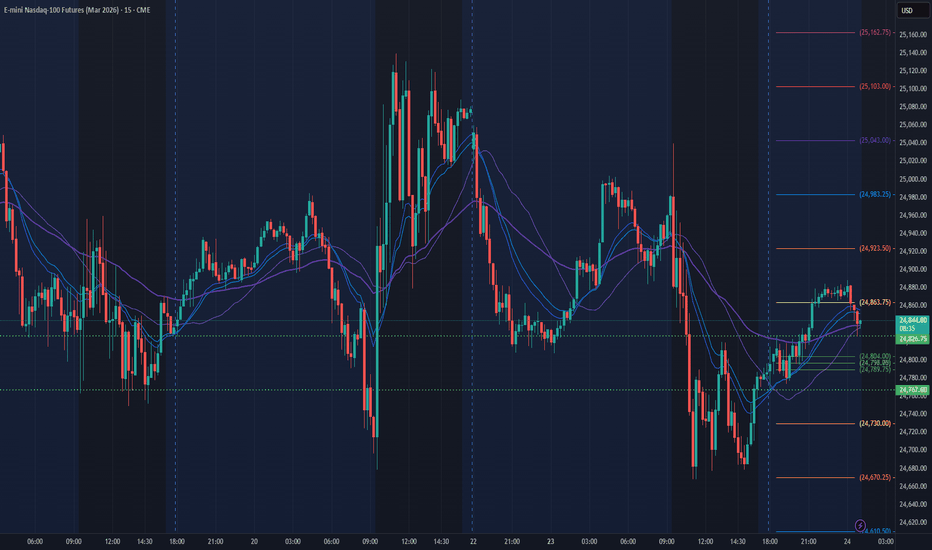
Silver – Can the Short Term Rally Continue?Silver roared back to life again on Friday with a gain of 7.7% to close at a 1 week high of 84.586, as the US dollar fell and traders sought out safe haven protection into the weekend, unsure of what the next move from President Trump may be after the US Supreme court ruled that he had exceeded his authority by invoking emergency powers to pursue his reciprocal tariff policies.
Since its collapse at the end of January from record highs at 121.625 (Jan 29th), Silver has been trading in a choppy range between a high at 92.194 (Feb 4th) and a low at 64.017 (Feb 6th), and for the past week it had been struggling for momentum above short term resistance around the 79.50/80 level. That has now been clearly broken in the short term.
Looking forward, President Trump hasn’t taken the Supreme Court decision lying down, he immediately used a different law to impose temporary tariffs of 10% on all imports from global trading partners on Friday, and then on Saturday changed this to 15%. These new levies are due to take effect on February 24th.
This news, taken with reports that the EU are considering a delay to the ratification of its US trade deal, helped to increase investor uncertainty surrounding the direction of global trade, which has weighed on risk sentiment and the US dollar early on Monday, while also stimulating fresh demand for Gold and Silver at the start of this new week. Silver briefly hit a high at 87.82, before edging lower again to trade +2% at 86.40 at the time of writing (0700 GMT).
How these events all unfold over the next 5 trading days, alongside progress towards a nuclear agreement between US-Iran could impact short term Silver price action from this point.
The technical outlook could also be something that may influence whether the early week upside momentum for Silver continues or if profit taking against higher resistance levels may dominate the thoughts of traders.
Technical Update: Have Overextended Upside Conditions Now Been Unwound?
Silver, like other precious metals, saw a sharp and aggressive sell-off from its January 29th highs. The move drove a decline of more than 47% into the February 6th low at 64.017. The drop to this low eventually stabilised price action and has even sparked a recovery over the past few sessions.
As the chart above shows, the sell-off perhaps wasn’t entirely unexpected. However, price activity went on to test potential support at 64.181, which aligned with the 61.8% Fibonacci retracement of the entire April 7th 2025 to January 29th 2026 advance. Traders may have viewed this as something of a “last ditch” support level - since a closing break of the 61.8% retracement often implies a full move back to where the price strength began - but it held, allowing price action to begin its latest recovery. Even so, monitoring key support and resistance levels this week could be essential for assessing the next directional risks.
Potential Support Focus:b]
While the 64.181 retracement level is likely to remain the key long term support, the rally from that area has brought several potential shorter term support levels into play, as shown on the chart below.
The first potential support level this week could sit at 78.372, which represents half of last week’s recovery range. A closing break below this level might signal scope for further downside. That could expose a retest of 71.945, the February 17th low, and if that gives way, a move toward the more significant 64.181 retracement level. Trader focus is likely to remain elevated around 64.181, as a closing break beneath it could increase the risk of deeper price declines.
Potential Resistance Focus:b]
The strong recovery over the past few sessions may have some traders anticipating further attempts to push higher. However, from a technical standpoint, resistance may emerge at 86.271, the current level of the declining Bollinger mid average. If additional strength is to develop this week, daily closing breaks above 86.271 may likely be needed to improve the upside potential.
If seen, such moves could then open the door to a more extended phase of price strength. Focus might then shift to potential resistance at 93.243, which is the 50% Fibonacci retracement of the January 29th to February 6th decline. Should that level also be breached, attention could turn toward 100.134, the higher 61.8% retracement level.
The material provided here has not been prepared accordance with legal requirements designed to promote the independence of investment research and as such is considered to be a marketing communication. Whilst it is not subject to any prohibition on dealing ahead of the dissemination of investment research, we will not seek to take any advantage before providing it to our clients.
Pepperstone doesn’t represent that the material provided here is accurate, current or complete, and therefore shouldn’t be relied upon as such. The information, whether from a third party or not, isn’t to be considered as a recommendation; or an offer to buy or sell; or the solicitation of an offer to buy or sell any security, financial product or instrument; or to participate in any particular trading strategy. It does not take into account readers’ financial situation or investment objectives. We advise any readers of this content to seek their own advice. Without the approval of Pepperstone, reproduction or redistribution of this information isn’t permitted.
 Short
Short
Short 
Long 
USDJPY – Has the Short Squeeze More Room to Run?The landslide win by Japanese Prime Minister Sanae Takaichi on February 8th saw USDJPY fall 3.4% from a high of 157.64 on February 9th down to a low of 152.26 on February 12th. Part of the reason for this move was a shift by global investors into Japanese assets in the hope that her election promises of tax cuts and spending would reinvigorate economic growth and consumer spending in the country, pushing corporate profits to new highs, while at the same time paving the way for the Bank of Japan to continue slowly raising interest rates.
This theory hit a bump in the road at the start of the week when the preliminary Japanese Q4 2025 GDP growth reading came in much lower than expected, just 0.2% higher on an annualized basis, against an expectation of +1.6%. While highlighting the size of the challenge ahead for the Japanese PM, this reading also gave those holding short USDJPY positions reason to reconsider, leading to an initial spike higher back above 153.00.
As the week has progressed, stronger US economic data readings and last night’s Federal Reserve minutes from their January policy meeting, which suggested some policymakers felt the US central bank may need to raise rates if inflation remained stubbornly high, have boosted the US dollar heaping further pressure on weak shorts, pushing USDJPY to current 1 week highs at 155.34 (0630 GMT).
Now, looking forward, where USDJPY moves from here may be decided by an inflation (CPI) update from Japan scheduled for release tonight at 2330 GMT, which could shift market expectations of when the Bank of Japan may raise interest rates next. Then, tomorrow traders could be focused on the latest US PCE Index (Fed’s preferred inflation gauge) and the Q4 2025 GDP reading, both are due at 1330 GMT. These 2 updates could add momentum to the recent US dollar surge or could stop the move in its tracks. There is a lot for USDJPY traders to digest in the next 36 hours!
Technical Update: Focus is on Key Support Zone
Recent uncertainty around possibilities of Bank of Japan intervention continues to keep USDJPY traders on their toes. Since the sharp 4.6% sell‑off between January 14th and January 27th, price action has remained confined within the 159.46 down to 152.09 range, but trading has been choppy throughout.
As the daily chart above shows, after approaching the 151.98 retracement support, USDJPY staged a strong rebound into the 157.66 high on February 9th. However, the subsequent decline has been equally sharp, placing the pair back within striking distance of the key 151.98 level, which is the 38% Fibonacci retracement of the April 22nd 2025 to January 14th 2026 advance.
While this support level could be a key focus for traders in the coming sessions, it remains important to stay aware of other potentially significant support and resistance levels in the current more volatile environment.
Potential Support Levels:
We have already identified 151.98 as a potential key retracement support, and its importance is perhaps reinforced by an alignment with the 152.09 low from January 27th. This 151.98/152.09 zone could be monitored closely as a potential support area, given its significance on both a Fibonacci and price‑action basis.
Closing breaks below the 151.98/152.09 support range could open the door to further weakness, suggesting a deeper retracement of the April/January advance may unfold. If so, risks might shift toward a further phase of declines, with the next support potentially at 149.67, which is the 50% retracement.
Potential Resistance Levels:
The 151.98/152.09 price zone remains intact on a closing basis, and as seen on January 27th, buyers have previously emerged here to trigger a strong rebound. While this continues, attention may shift toward resistance marked by half the latest decline at 154.84. Prices are currently trading above this level, but a daily close may now be needed to tilt possibilities toward renewed attempts at upside levels.
While not an outright positive signal, a closing break above 154.84 could open scope for moves toward 157.66, which is the February 9th bounce‑failure high, and potentially even 159.49, which is the January 14th upside extreme.
The material provided here has not been prepared accordance with legal requirements designed to promote the independence of investment research and as such is considered to be a marketing communication. Whilst it is not subject to any prohibition on dealing ahead of the dissemination of investment research, we will not seek to take any advantage before providing it to our clients.
Pepperstone doesn’t represent that the material provided here is accurate, current or complete, and therefore shouldn’t be relied upon as such. The information, whether from a third party or not, isn’t to be considered as a recommendation; or an offer to buy or sell; or the solicitation of an offer to buy or sell any security, financial product or instrument; or to participate in any particular trading strategy. It does not take into account readers’ financial situation or investment objectives. We advise any readers of this content to seek their own advice. Without the approval of Pepperstone, reproduction or redistribution of this information isn’t permitted.
Long 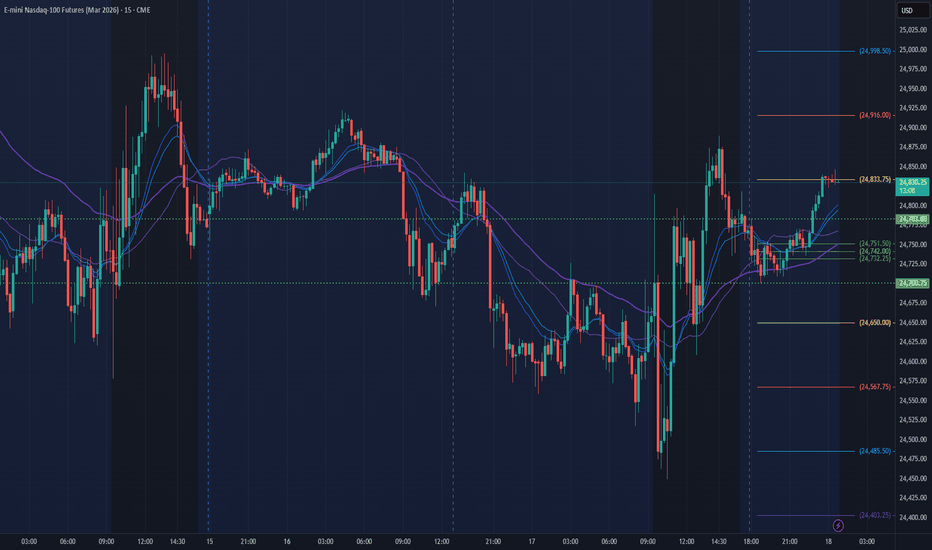
GBP/NZD 2026 Outlook: Strategic Divergence and VolatilityThe GBP/NZD exchange rate faces critical volatility in mid-February 2026. Trading near 2.25, the pair stands at a crossroads defined by diverging monetary policies and shifting trade dynamics. Investors must navigate a landscape where the Bank of England (BoE) remains cautious while the Reserve Bank of New Zealand (RBNZ) faces sticky inflation. This analysis dissects the drivers behind these fluctuations across geopolitical, economic, and technological domains.
Geopolitics and Geostrategy
Global trade fragmentation defines the 2026 landscape. The UK-New Zealand Free Trade Agreement, now fully operational, drives specific currency flows. Rising dairy and beef exports from New Zealand to the UK create structural demand for the Kiwi dollar. Conversely, the UK’s strategic pivot toward the Indo-Pacific through CPTPP membership bolsters Sterling’s long-term relevance in the region. Geopolitical tensions in supply chains force nations to prioritize "friend-shoring." This strengthens trade corridors between the UK and NZ, insulating the pair from broader USD-centric volatility.
Macroeconomics and Economics
Monetary policy divergence is the primary short-term driver. The BoE held rates at 3.75% in early February, citing persistent 3.4% inflation. This "higher for longer" stance supports Sterling yield appeal. In contrast, the RBNZ faces a dilemma with its Official Cash Rate at 2.25%. While markets expect a hold, domestic inflation breaching the 3% target creates hawkish risks. Traders are pricing in a potential hawkish pivot from Wellington. This yield spread dynamic currently favors the Pound, but any surprise tightening from the RBNZ will trigger sharp reversals.
Management and Leadership
Central bank leadership styles are testing market confidence. BoE Governor Andrew Bailey maintains a data-dependent, cautious approach that frustrates bears expecting quicker cuts. Meanwhile, the RBNZ sees a leadership transition with Governor Anna Breman facing her first major policy test. Her background suggests a scrutiny of labor market slack versus sticky food prices. Markets scrutinize her communication style for deviations from the previous consensus. A decisive, hawkish tone from Breman could rapidly erode Sterling’s recent advantage.
Industry Trends and Business Models
Export composition dictates currency sensitivity. New Zealand’s economy remains heavily reliant on agribusiness, where input costs have stabilized. The "value-over-volume" business model in NZ dairy increases export revenues despite lower gross tonnage. The UK focuses on exporting high-value services and fintech solutions. This structural mismatch means GBP/NZD fluctuates with global risk sentiment. When global growth forecasts dip, the risk-sensitive Kiwi often underperforms against the services-heavy Pound.
Technology and Cyber Security
Digital sovereignty is reshaping cross-border finance. The adoption of the "GENIUS Act" principles globally influences how institutions handle FX settlements. Banks now prioritize proprietary "sovereign clouds" for trading execution to mitigate cyber espionage risks. This shift increases transaction costs but enhances systemic resilience. For GBP/NZD, the integration of AI-driven algorithmic trading creates flash-crash risks. Automated systems react microseconds faster to RBNZ announcements than human traders, amplifying intraday volatility.
Science and Patent Analysis
Intellectual property trends signal long-term currency strength. UK-based firms lead in fintech and cybersecurity patents, bolstering the Pound’s status as a modern reserve asset. Conversely, New Zealand’s patent growth concentrates in agritech and methane reduction technologies. These innovations protect the long-term viability of NZ’s primary exports against climate regulations. The currency market increasingly values nations with robust IP portfolios. This "innovation premium" currently supports the GBP, reflecting the UK's broader R&D output.
Conclusion
The GBP/NZD pair remains a high-stakes battleground in Q1 2026. Immediate direction depends on the RBNZ’s willingness to combat sticky inflation against a backdrop of slowing growth. While the BoE provides a stable yield floor, the Kiwi dollar possesses latent explosive potential if Wellington turns hawkish. Traders should anticipate heightened volatility and manage position sizing accordingly. The intersection of trade strategy and monetary policy will define the next major trend. UK 100 Index – Recent Record High Still Within ReachThe UK 100 index posted a small gain yesterday to close at 10463 which is less than 1% from its most recent record high of 10543 seen on February 12th. The UK 100 is an index with a very limited technology weighting, packed full of ‘old world’ multi-national companies that generate well over 60% of their revenue from outside of the UK.
This composition has helped to insulate the index from the heavy selling pressure that has sporadically hit US and European indices during February, due to their heavier weighting towards businesses with AI exposure. After opening the month at 10230 on February 2nd, and briefly falling to a low at 10121, the UK 100 has moved steadily higher to register a monthly gain of 2.2% at current levels (10455, 0630 GMT).
However, the current UK 100 uptrend (more on this in technical section below) could face a stern test across the remainder of this week due to the release of some key UK economic data and earnings from Europe’s four largest mining companies all listed in the index.
In terms of economic data, traders will first have to negotiate today’s UK employment release at 0700 GMT, and then the latest CPI update which is due tomorrow at 0700 GMT. After the recent knife edge 5 to 4 vote by Bank of England (BoE) officials to keep interest rates unchanged earlier in February, traders may well be looking at these updates to confirm whether an interest rate cut will happen at their next meeting on March 19th.
Perhaps more important for the direction of the UK 100 could be the release of the earnings from Antofagasta (today, before open), Glencore (Wednesday, before open), Rio Tinto (Thursday, before open) and Anglo American (Friday, before open). These companies have seen their value surge $65 billion during 2026 according to Reuters, and whether that positivity continues both for the individual companies and the UK 100 could be heavily dependent on finding out if the surge in metals prices has translated into upbeat earnings and future revenue forecasts.
UK 100 Index Technical Update: Is the Trend Still Your Friend?
Since the UK 100 index recorded its first-ever close above the psychological 10,000 level on January 5th 2026, price action has remained positive, with a new all‑time high of 10,543 posted on Thursday last week. The move has formed a near‑classic uptrend, with buyers stepping in at progressively higher levels and each setback establishing support above the previous recovery high.
While traders may be looking for this positive pattern to extend in the coming sessions, the current move offers no guarantee of further price strength. Continued buying sponsorship is still required to drive prices higher and maintain the uptrend.
With that in mind, it remains prudent to monitor key support and resistance levels closely. This could help determine whether the recent price action reflects a continuation of upside momentum capable of producing new highs, or whether that momentum is beginning to fade and could lead to a period of price weakness.
Potential Resistance Levels:
If the current trend remains intact, the first resistance focus is the most recent recovery high at 10543. With Friday’s and Monday’s rally lifting prices back toward this area, 10543 now becomes a key level to watch in determining the possibility of further upside momentum. Closing breaks above this point may be needed to signal continued strength.
If confirmed, closing breaks above 10543 could signal a resumption of price strength, opening the way for a move toward 10634, which is the 138.2% Fibonacci extension. Sustained closes above 10634 could then open scope for further gains toward 10754, the 161.8% extension.
Potential Support Levels:
The Fibonacci retracements of the latest advance from the January 20th low to the 10543 all‑time high can be used to help highlight potential support levels to monitor across the remainder of this week. The 38.2% retracement at 10356 could mark the first key support zone should a correction in the UK 100 begin to develop.
As the chart above highlights, closing breaks below 10356 could expose further downside risks toward 10297, which is the 50% retracement. If that level also gives way, weakness may extend toward 10238, the 61.8% retracement.
The material provided here has not been prepared accordance with legal requirements designed to promote the independence of investment research and as such is considered to be a marketing communication. Whilst it is not subject to any prohibition on dealing ahead of the dissemination of investment research, we will not seek to take any advantage before providing it to our clients.
Pepperstone doesn’t represent that the material provided here is accurate, current or complete, and therefore shouldn’t be relied upon as such. The information, whether from a third party or not, isn’t to be considered as a recommendation; or an offer to buy or sell; or the solicitation of an offer to buy or sell any security, financial product or instrument; or to participate in any particular trading strategy. It does not take into account readers’ financial situation or investment objectives. We advise any readers of this content to seek their own advice. Without the approval of Pepperstone, reproduction or redistribution of this information isn’t permitted.
Short 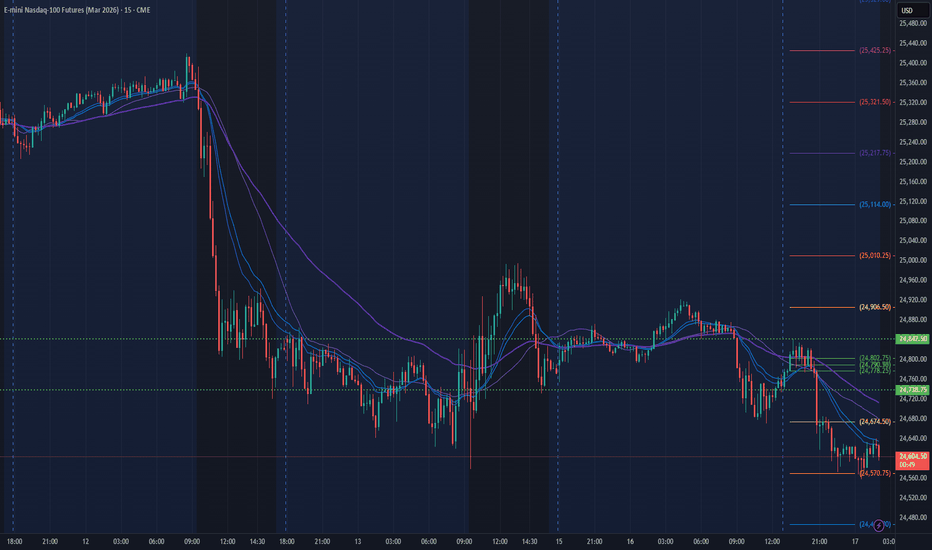
Gold – Consolidation Potential - Volatility Remains ChallengingGold volatility may have eased in the last week when judged by the levels of movement at the start of February, however prices are still relatively wild and can catch out those traders who haven’t prepared carefully in advance. For example, Monday February 9th saw Gold open at 4990 and steadily climb up to a high of 5119 on Wednesday, then prices collapsed 3.2% on Thursday down to a low of 4879, before spiking 2.46% on Friday to close at 5042, which was an eventual weekly gain of 1%. It’s a challenging environment for sure!
The current backdrop may remain constructive for Gold, with Asian central bank demand remaining on dips, as well as market expectations for a minimum of 2 Federal Reserve interest rate cuts across 2026 reinforced by Friday’s weaker than expect US CPI release, a move which typically provides support for non-yielding precious metal.
However, it also seems traders may be reluctant to attempt buying at higher levels for the time being after being scared by the drop from all-time highs at 5598 seen on January 29th down to the lows at 4403 on February 2nd. This could mean a period of consolidation may be due, especially with Chinese markets closed all week for the Lunar New Year. Chinese investors have been extremely active across all precious metals markets to start 2026.
That said, Gold traders may want to stay on alert this week, with several potential volatility catalysts on the horizon. Geopolitical tensions between the US and Iran remain a key wildcard, particularly with Washington maintaining a significant military presence in the region and diplomatic talks between the two nations set to resume on Tuesday. At the same time, macro risks could intensify with the release of the Fed’s January policy meeting minutes (Wednesday 19:00 GMT), followed by the Fed’s preferred inflation measure, the PCE Index (Friday 13:30 GMT). Together, these developments could prove pivotal in shaping near-term direction and volatility for Gold prices across the week.
Technical Update: Steady Recovery From 4425 Support Positive?
Gold has stabilised after its 21% liquidation from the January 29th all‑time high at 5598, with the 50% Fibonacci retracement at 4425 holding to form a steady recovery. The key question now is whether this is merely a reactive bounce before the resumption of a broader move back to the downside, the early stages of renewed positive momentum capable of resuming the long‑term uptrend, or a period of price consolidation between the key support and resistance levels.
While it’s impossible to know the next directional themes with absolute certainty, mapping key support and resistance levels can help to frame the current Gold recovery. These reference points could offer a clearer read on whether price action is leading to a more sustained rebound, a temporary reaction within the broader late‑January decline, or a more extended consolidation in price.
Potential Support Focus:
Bearish Gold traders might be viewing the latest recovery as merely a reactive bounce within the broader late-January weakness. Their focus during the upcoming sessions may be on identifying resistance levels capable of capping this strength and possibly turning price action lower again.
Using the chart above, Gold bears could now be watching 5142, which is the 61.8% Fibonacci retracement of the latest decline, as a key focal point. If this level continues to cap the current advance and weakness re‑emerges, breaks below potential support at 4762, a level which is equal to half the latest recovery, could trigger further downside. While not a guarantee of renewed declines, closing breaks below 4762 may well shift focus back to critical support at 4425 that held so effectively at the start of February. A break below 4425 could exposure risks of even deeper declines.
Potential Resistance Focus:
For those looking at the potential for upside continuation, 5142, the 61.8% retracement of the latest decline, may be the first key resistance focus. Traders expecting a broader recovery could be watching for sustained closes above this level, as a break could signal scope for a more extended phase of price strength.
A close above 5142 this week could keep upside momentum in play, shifting focus toward the 5346 upper Bollinger band. A break of that level may reopen scope toward the 5598 January all‑time high, though that may still provide strong resistance.
Potential Price Consolidation Focus:
Of course, while both the support at 4762 and resistance at 5142 continue to contain price action, Gold may simply settle into a broader consolidation phase. This would align with easing volatility and a natural period of re‑balancing after the recent dramatic price swings.
The material provided here has not been prepared accordance with legal requirements designed to promote the independence of investment research and as such is considered to be a marketing communication. Whilst it is not subject to any prohibition on dealing ahead of the dissemination of investment research, we will not seek to take any advantage before providing it to our clients.
Pepperstone doesn’t represent that the material provided here is accurate, current or complete, and therefore shouldn’t be relied upon as such. The information, whether from a third party or not, isn’t to be considered as a recommendation; or an offer to buy or sell; or the solicitation of an offer to buy or sell any security, financial product or instrument; or to participate in any particular trading strategy. It does not take into account readers’ financial situation or investment objectives. We advise any readers of this content to seek their own advice. Without the approval of Pepperstone, reproduction or redistribution of this information isn’t permitted.
 Long
Long
Long 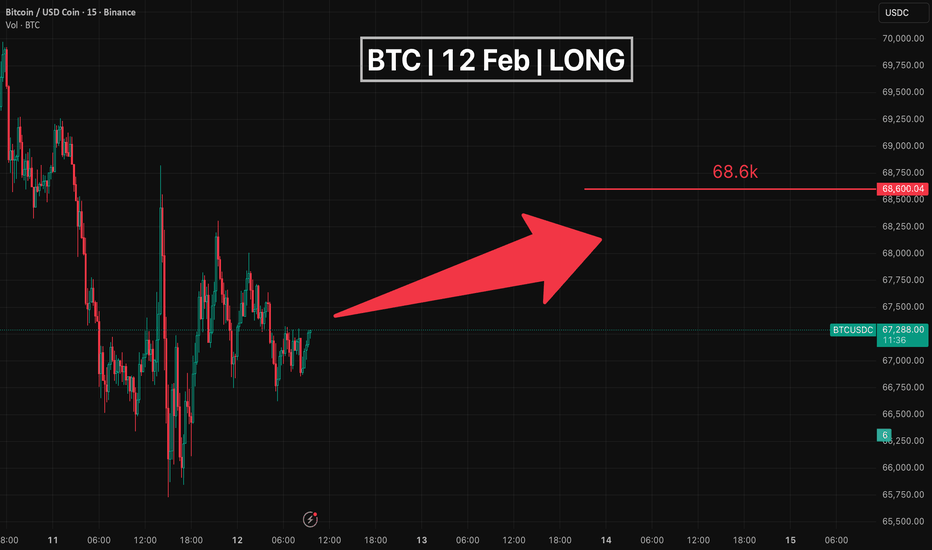
Short 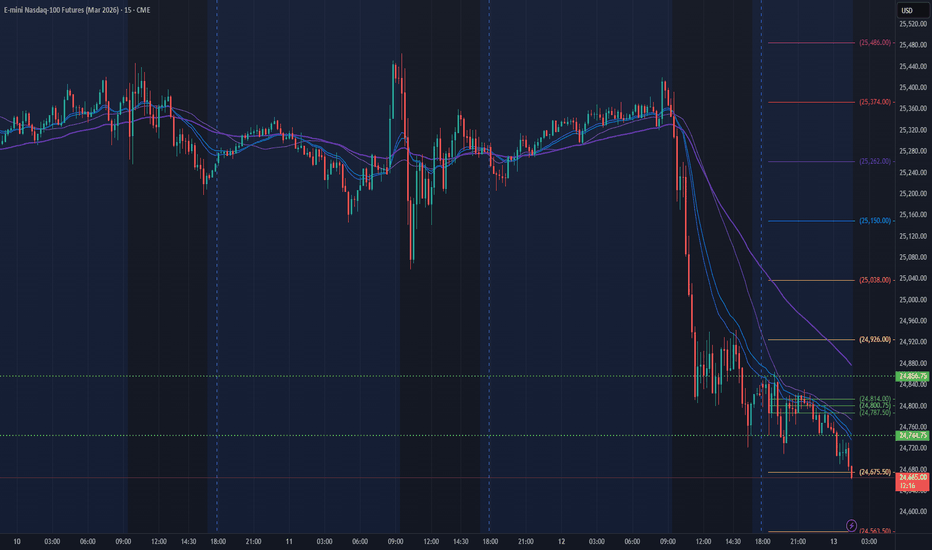
AAPL GEX 280 rejection multiple times🔶 AAPL – Rejection at 280 Call Resistance, Testing Support While Above HVL 🔶
On the daily chart, AAPL has once again been rejected at the 280 call resistance , a level that has now rejected price multiple times, confirming it as a significant call-side ceiling . 🔴
Yesterday’s rejection from 280 triggered downside momentum, and today price is showing a clear follow-through move lower, with AAPL currently down around 3% , signaling emerging relative weakness compared to its previously strong performance within the tech sector. 🔴
Technically, price has now moved to the 50-day moving average , which adds short-term pressure to the structure. Despite this weakness, the broader regime remains supportive for now:
Price is still trading above the High Volatility Level (HVL) 🟢
The GEX profile remains positive , suggesting dealer positioning is not yet in a fully reactive downside regime 🔵
From a structural perspective, the next key area to monitor sits around the 265–266 zone , which represents:
a nearby technical support level 🔵
an area just below the 50 SMA where buyers may attempt to stabilize price 🟢
🔶 Key Structure to Watch 🔶
280 – confirmed call resistance / rejection zone 🔴
HVL – regime pivot, still holding above 🟢
265–266 – near-term support area 🔵
Positive GEX – supportive but weakening context 🔵
If AAPL holds above HVL, downside may remain controlled despite short-term weakness. However, continued rejection at 280 combined with relative underperformance could shift sentiment if support levels fail.
Best,
Greg


 Short
Short