BNBUSDT — Bullish consolidation ahead of resumed uptrendThe bullish consolidation in BNBUSDT that I’ve been watching has begun to resolve in the market’s favor. Price action is coiling after two consecutive white spinning-top candles, a pattern that signals indecision but also a readiness to resume the prior trend when confirmed. The move has occurred on heavier volume concentrated in the current price area, and the pair sits roughly halfway between two key Fibonacci retracement levels — a location that commonly precedes a corrective bounce rather th
Volume Profile
EUR/USD H1 Analysis: Key Supply & Demand Zones to Watch I SEP/231) Overview
Timeframe: H1 (short to mid-term trades).
Short-term trend: bullish (trendline up from Sept 22 low).
Current price: around 1.1798, overlapping with POC zone ~1.1799 (from volume profile).
Key zones:
Supply zone: 1.1814 – 1.1820 (strong resistance).
POC zone / balance area: ~1.1799.
H1 Support: 1.17606 (near-term support).
Demand zone: ~1.17236 (stronger support below).
2) Price Action & Market Logic
Price has been making higher highs / higher lows → bullish structure.
Volume prof
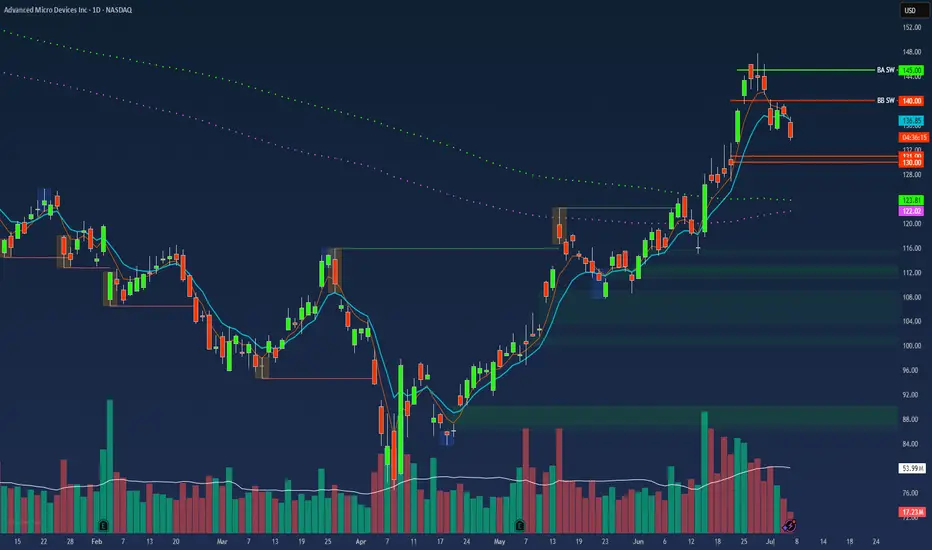
$AMD Swing Trade – Put Debit Spread Setup🔻 NASDAQ:AMD Swing Trade – Put Debit Spread Setup (Jul 18 Exp)
📅 Trade Opened: July 3, 2025
🛠 Strategy: Buy to Open (BTO) Put Debit Spread
📉 Strikes: $31 / $30 (Jul 18 Expiration)
💵 Cost (Premium Paid): $0.21
🎯 Trade Thesis
This setup aims to capture short-term downside in NASDAQ:AMD via a low-cost, defined-risk spread. The trade fits within my broader portfolio of OTM spreads under $0.25.
Key Drivers:
🔻 Semi sector under pressure – NASDAQ:AMD showing relative weakness.
📉 Breakdown bel
$LYFT Swing Trade – Low-Cost Call Debit Spread Setup🚗 NASDAQ:LYFT Swing Trade – Low-Cost Call Debit Spread Setup (Jul 18 Exp)
📅 Trade Opened: July 3, 2025, 2:53 PM
🛠 Strategy: Buy to Open (BTO) Call Debit Spread
📈 Strikes: $16.5 / $17.5 (Jul 18 Expiration)
💵 Cost (Premium Paid): $0.25
🎯 Trade Thesis
This swing trade targets a short-term bullish move in NASDAQ:LYFT based on improving fundamentals and favorable technical setup. The structure uses a low-cost OTM call spread to define risk and limit exposure while capturing directional potentia
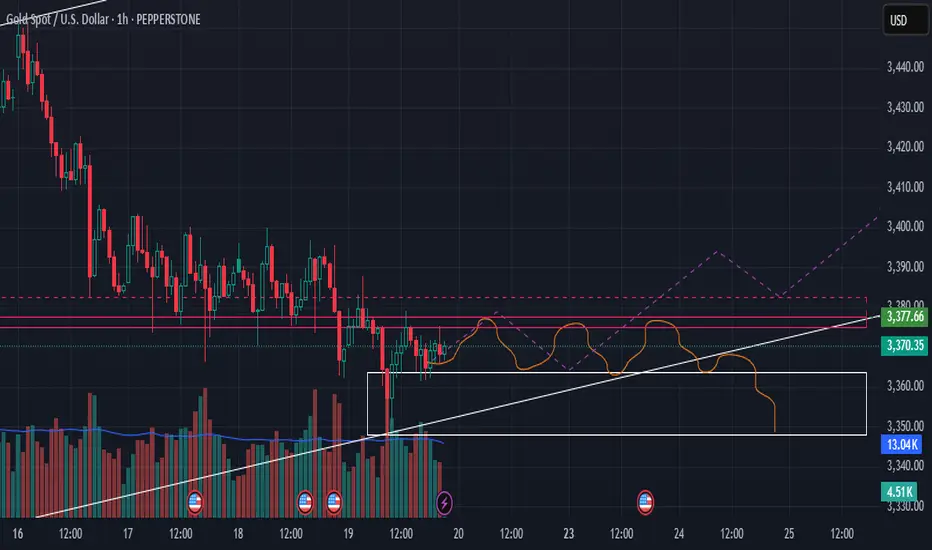
XAU/USD (Gold) – Educational Chart Breakdown [1H Timeframe]We’re currently observing a consolidation phase just below a well-tested resistance zone (~$3,377), while price remains supported by an ascending trendline — a classic setup where structure tightens before a significant move.
Two Potential Outcomes:
Bullish Case
If price closes convincingly above $3,378 with strong volume, we may see a continuation toward the $3,400–$3,410 zone. This would confirm the resistance break and shift market structure bullish on the 1H chart.
Bearish Case
Fail
What is a Bearish Breakaway and How To Spot One!This Educational Idea consists of:
- What a Bearish Breakaway Candlestick Pattern is
- How its Formed
- Added Confirmations
The example comes to us from EURGBP over the evening hours!
Since I was late to turn it into a Trade Idea, perfect opportunity for a Learning Curve!
Hope you enjoy and find value!
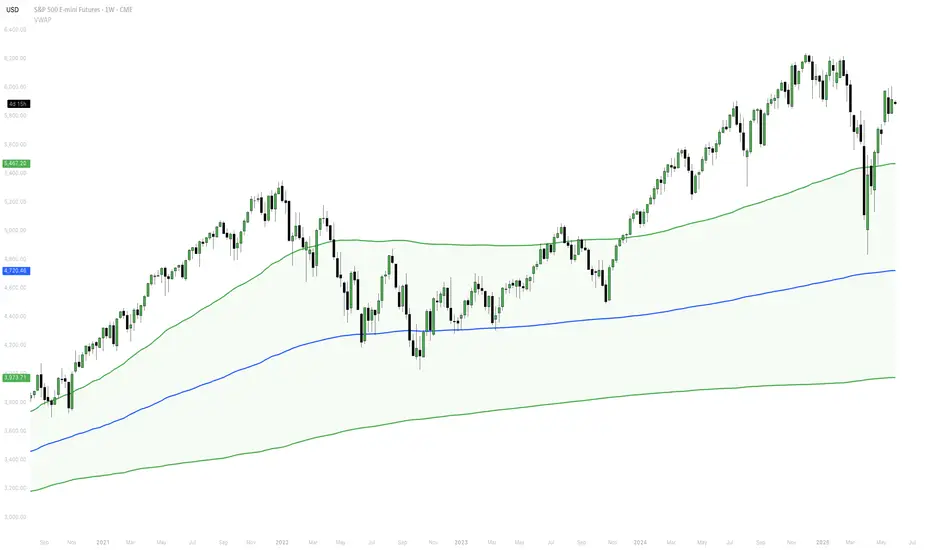
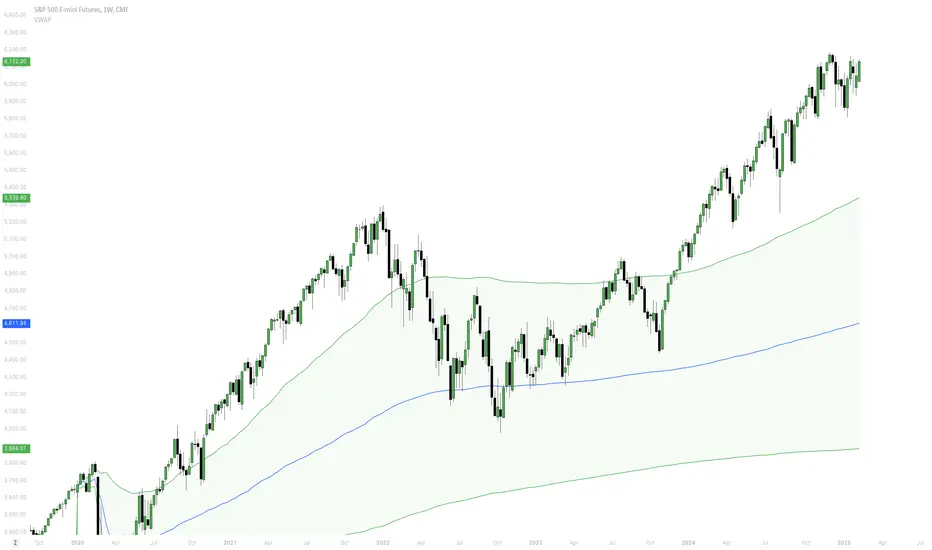
Understanding VWAP In TradingWhat is VWAP?
VWAP is a price benchmark that gives more importance to prices where higher trading volume occurs. Unlike simple moving averages, which treat each price point equally, VWAP provides a volume-weighted perspective, making it more representative of market activity.
Traders use VWAP to gauge market trends, confirm trade entries and exits, and measure the quality of executions relative to the market's liquidity.
How Institutional Traders Use VWAP
Large financial institutions an
NVDA - 140 Quasimodo?Well NVDA has exceeded the 120 PoC from the last year, and other than the head and shoulders developing it looks rather bullish above that 120. But I would sell 140, or at least not buy.
And if I'm buying I'd probably wait for 112. Think I will wait forever? 😂
Will update after we get some more data.
SPY and QQQ at MAJOR LevelsThe charts shown are highlighting the 12 month periodic volume profile chart. Currently, the S&P 500 and Nasdaq 100 are bouncing off major 2024 value areas.
Nasdaq 100:
Last week we can see how bulls lost the 2024 value area high (VAH) and couldn't reclaim. As a result we swiftly moved down to the point of control (POC) where we found buyers show up.
S&P 500:
Coincidently, the S&P 500 moved down to the 2024 VAH where it also found buyers show up.
Moving Forward:
These areas remain very
Understanding Volume In TradingVolume is one of the most crucial yet often overlooked aspects of trading. It represents the total number of shares, contracts, or lots traded in a given period and provides insight into the strength of price movements. By analyzing volume effectively, traders can identify trends, confirm breakouts, and detect potential reversals before they happen.
Unlike price action alone, volume adds a critical layer of confirmation. A price move supported by high volume is more likely to be sustainable, wh
Understanding Buy The Dip In TradingBuying the dip is a trading strategy where you take advantage of temporary price drops in an overall uptrend. The goal is simple: enter the market at a lower price before it resumes its upward move. It sounds easy, but knowing when and how to do it makes all the difference. In this guide, we’ll explore key setups, ideal market conditions, and smart risk management techniques to help you trade dips like a pro. 🚀
1. Understanding Market Structure 🏗️
Before jumping into a trade, it’s crucial to
SHORT META Ahead of Earnings Report Based on Insider Selling"Meta Platforms Insider Sold Shares Worth $22,132,922"
Mark Zuckerberg, 10% Owner, Director, Chair of Board and Chief Executive Officer, on January 15, 2025, sold 35,921 shares in [eta Platforms. Following the Form 4 filing with the SEC, Zuckerberg has control over a total of 353,696 shares of the company, with 353,696 controlled indirectly.
Jennifer Newstead, Chief Legal Officer of Meta Platforms sold 905 shares of Class A Common Stock on January 14, 2025, at a price of $604.54 per
BTC Bullish + Bearish PredictionsThis analysis is based on VWAP, one of the most definitive levels that determine the future trend direction.
Right now we are sitting well above the VWAP anchored to 1/13 where the pivot low for out most recent move up began. Depending on the price action, the strong overall sentiment for BTC is strong enough to take it past the 108k ATH, despite many technicals suggesting we are overdue for a large pullback down to the 70ks.
What needs to happen is for accumulation to happen between the 102k
NSTR - Technical Analysis of Key Bullish and Bearish LevelsKey Observations:
Expanded Volume Profile:
The volume profile on the left indicates significant trading activity (support/resistance zones).
The high-volume node around 360–380 suggests a key area of interest where the price might consolidate or face resistance/support.
Bullish Levels:
Bullish Week (376): A breakout above this level could trigger upward momentum toward 400 and potentially higher.
Close Week Swing (363): Currently being tested. Sustained strength above this level would be a sig
BOMBAY DYEING - Ready to Move to the Next OrbitThe stock after facing price rejection in the range of 224 to 241 was pushed down to the 50 DMA. It moved almost sideways in the last three months. Recently we saw some interest coming back into the stock with the relative strength and the money flow turning positive and the volume was also increasing. The stock remained very strong during the recent weakness we saw in the overall market. Now finally it has crossed above the price rejection zone with good volume support. The delivery volumes saw
MAZAGON DOCKS - ON A RECOVERY PATH ?The stock after a buying climax bar in the month of July was overwhelmed with the supply of the BC bar and was pushed down to below the 50 DMA levels. Then it started accumulating around the 50 DMA and now it's finally getting pushed above the short-term moving averages. And all the key parameters like the relative strength, absolute strength, the money flow, buying pressure are all nicely stacked up favouring further up move. So, this could move up again. Another 1000 points testing 5400 levels
Put Your Speculators On!This head and shoulders pattern could be just pure speculation at this point. In fact, let me reword that.. this IS speculation based on the fact that I missed the lows and psychologically, I'm really hoping this comes back to shore so I can get back on the boat with everyone else.
I do however do my technical analysis in advance and set alerts at levels like you should do and if it plays out then great if not there's always the opposite idea too. We move onto the next one.
For now though what
$TSLA Support Found at Yearly Anchored VWAPIt appears Tesla NASDAQ:TSLA might have found significant temporary support at the yearly anchored VWAP. I expect a move up to test upper deviation at 226.50, which would be first profit target. I own some Oct 4 240 C which I plan on scaling out of beginning around that level.
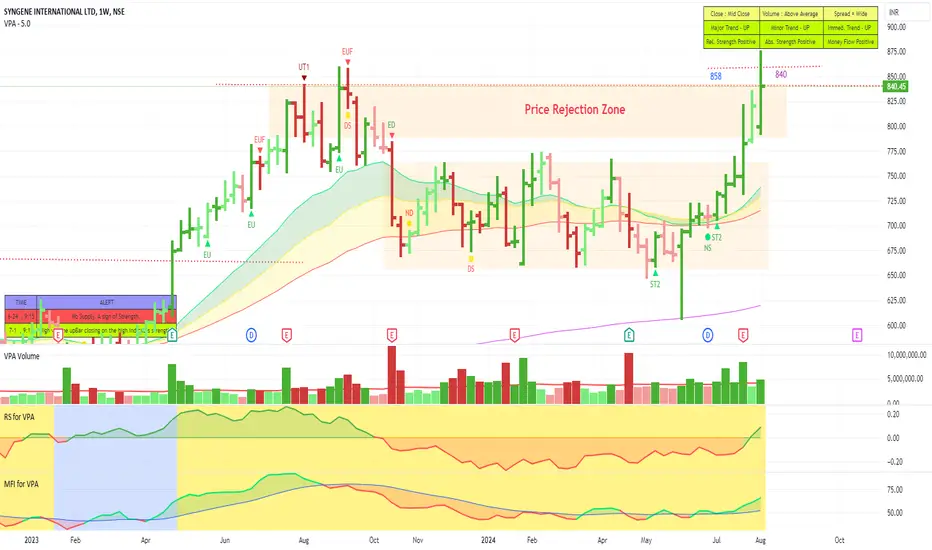
SYNGENE - Gearing up for higher MoveThe stock after nearly 10 months of consolidation had come out of the consolidation zone and now it is attempting to take out the previous supply zone as well. As we can see in the weekly chart, the relative strength and the money flow index are positive. In the daily chart as well, you can find the relative strength, the buying pressure are all positive. However, the money flow has not picked up. Given these conditions, once the money flow also picks up, the stock is likely to go up higher afte
MINDA CORP - Gearing up for More Upside ?After almost two months of side ways move the stock is on the verge of taking out the previous Price Rejection Zone. My checklist all ticked right
Relative Strength
Buying Pressure
Increased volume
Money Flow
Absolute Momentum
Increased Delivery volumes
There is a high probability of the stock moving into the next Higher trajectory. A positive close above 527 will add more conviction.
AFFLE - A stock to watchThe stock has been moving almost sideways for more than two years. Early this year it attempted to take out the old price rejection zone of two years at 1336 level, it failed and it was pushed down again below the 200 DMA. From there it started recovering and in the month of May the stock did make an attempt to take out this price rejection zone. It failed and again was pushed down below the 200 DMA. Now again it is making an attempt and it is crossed the rejection zone with a “Buying Climax” li
ICP Long Swing SetupThe chart suggests a bullish outlook based on the volume and price action. The significant volume spikes during rallies indicate strong buying interest.
The current low volume during the pullback phase supports the possibility of accumulation.
If the price breaks above the recent highs with increasing volume, it could signal the continuation of the uptrend.