TITAN 1 Day Time Frame 📊 Current approximate price: ₹4,250 – ₹4,270 (24-Feb-26 session range)
🔁 Daily Pivot & Key Levels (1-day)
Pivot Point (PP): ~₹4,230 – ₹4,260
Resistance Levels:
R1: ~₹4,260 – ₹4,276
R2: ~₹4,281 – ₹4,287
R3: ~₹4,310 – ₹4,347
Support Levels:
S1: ~₹4,155 – ₹4,172
S2: ~₹4,130 – ₹4,140 (below S1, potential next support)
S3: ~₹4,090 – ₹4,100 (deeper intraday support)
💡 In simple terms:
Above the pivot point → bias toward short-term upside toward the resistance zones.
Below the pivot → selling pressure could accelerate toward the first and second support levels.
Breakouts beyond R2/R3 during the session often indicate stronger intraday momentum.
📉 Intraday Range Reference
Typical day range (recent): ~₹4,240 (low) to ₹4,277 (high) — showing tight price action around the pivot zone.
⚠️ Note: These levels are based on technical pivot and support/resistance calculations. Actual intraday trading levels can vary based on market volatility, news flow, and volume conditions. Always consider live quotes from your broker/charting platform for precise real-time trading decisions.
W-pattern
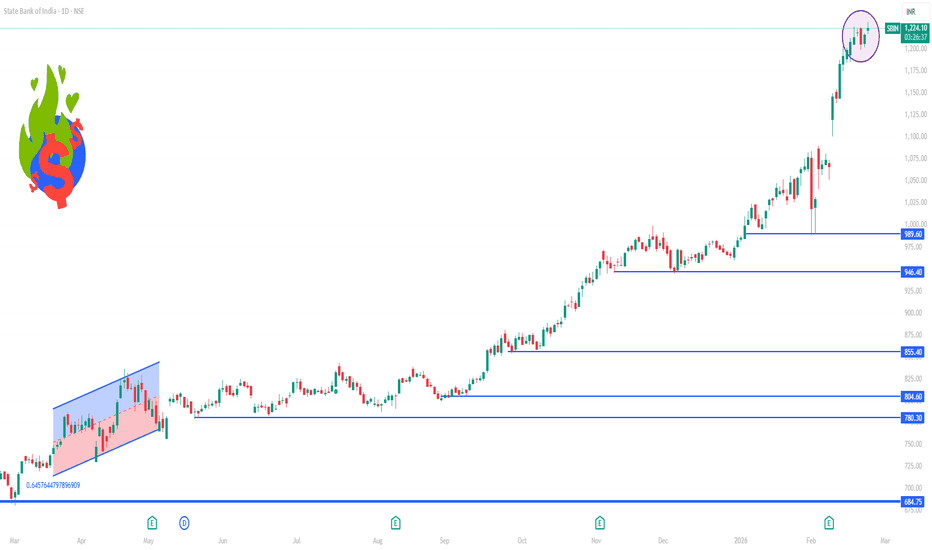
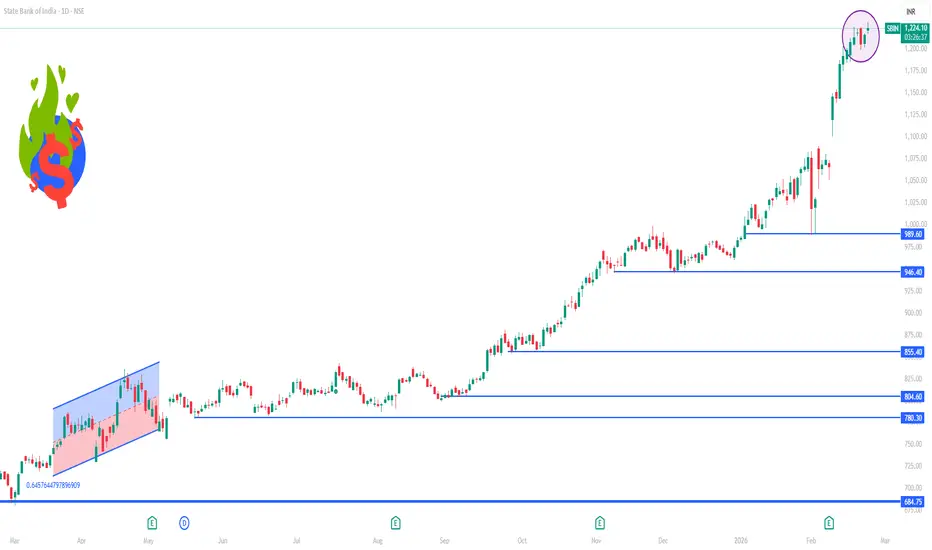
SBIN 1 Day Time Frame📊 Current price context
• SBIN is trading above ₹1,220 on the NSE recently (close to 52-week high).
📈 Daily Technical Levels (1D)
🔹 Resistance Levels
R1: ~₹1,221 – ₹1,222
R2: ~₹1,235 – ₹1,236
R3: ~₹1,245 – ₹1,247
🔹 Pivot
Pivot: ~₹1,210 – ₹1,211
🔹 Support Levels
S1: ~₹1,196 – ₹1,197
S2: ~₹1,185 – ₹1,186
S3: ~₹1,170 – ₹1,171
👉 These pivot and S/R levels are typical daily pivot point calculations used by traders to assess intraday directional bias and potential reversal zones.
🧠 How to Use These Levels (1-Day Chart)
Bullish bias: Price holding above the pivot (~₹1,210) suggests strength; rallies to R1/R2/R3 could follow.
Bearish risk: A break below S1 (~₹1,196) could accelerate selling toward S2/S3.
Intraday trades: Traders often watch reactions near pivot ± 1–3 support/resistance for entry/exit decisions.
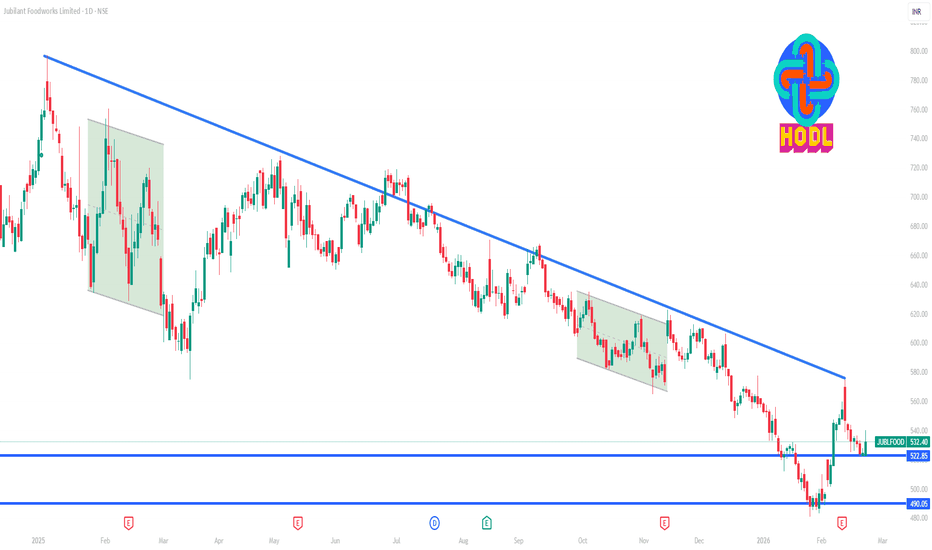
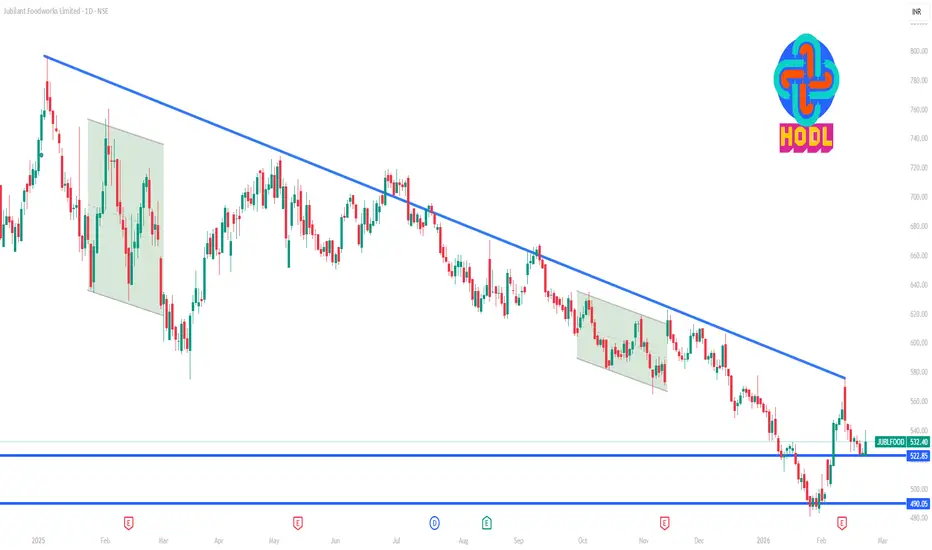
JUBLFOOD 1 Day Time Frame 📍 Current Price (latest available): ~₹532 – ₹533 per share (close of recent session / intraday range) on the NSE/BSE.
📊 1-Day Key Technical Levels (Support & Resistance)
These levels are used by intraday traders for entry/re-entry, pullbacks, and breakout decisions:
🔹 Pivot (Central reference level):
• ₹540 – ₹541 — daily pivot zone (trend reference)
🔸 Resistance Levels (Upside barriers):
1️⃣ R1 ~ ₹540 – ₹541 (near pivot/high point)
2️⃣ R2 ~ ₹551 – ₹552
3️⃣ R3 ~ ₹557 – ₹558
-- Price may test these levels before notable selling gets stronger.
🔹 Support Levels (Downside guard):
1️⃣ S1 ~ ₹534 – ₹535 (near current price support)
2️⃣ S2 ~ ₹528 – ₹529
3️⃣ S3 ~ ₹523 – ₹524
-- Below S3 break could see short-term bearish momentum.
🕐 Intraday Price Range (Latest Session)
• Day’s High: ~₹540.40
• Day’s Low: ~₹523.00
• Trading range: ~₹523 – ₹540 (active range today)
📉 Interpreting These Levels Today
Bullish momentum scenario:
✔ Price sustaining above pivot ~₹540–₹541 may encourage buyers aiming toward ₹551–₹558.
Bearish momentum scenario:
✔ Break and close below ₹523–₹524 likely signals short-term weakness and more sell-off risk.
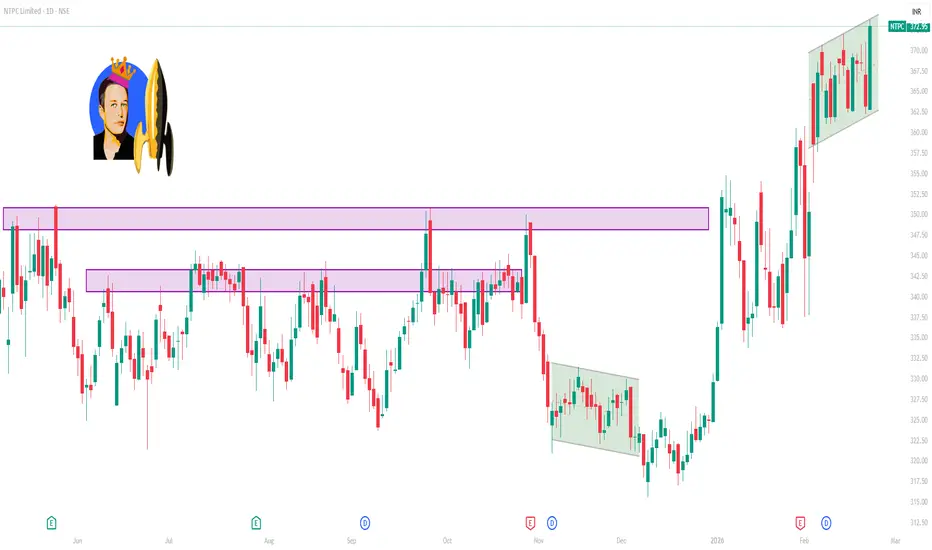
NTPC 1 Day Time Frame 📌 Current Price Snapshot (Latest Market Data)
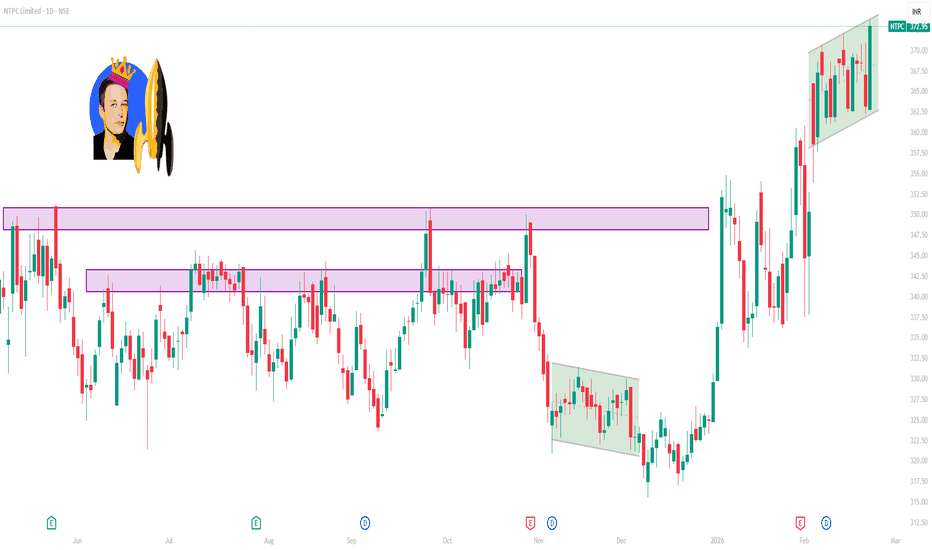
📈 NTPC’s share price has recently been trading around ₹372–₹374 on the NSE, continuing strength after recent gains and hitting near 52-week highs.
📊 Daily (1D) Technical Levels
These are derived from standard pivot point calculations and intraday technical data:
🔹 Pivot / Reference
• Daily Pivot: ~₹368.76 (central level where trading bias shifts)
🔸 Resistance Levels (Upside Targets)
R1: ~₹370.13
R2: ~₹372.01
R3: ~₹373.38 — near recent price highs
➡ If the stock stays above the pivot (~368–369) and breaches R2/R3, upside momentum may sustain during the session.
🔹 Support Levels (Downside Zones)
S1: ~₹366.88
S2: ~₹365.51
S3: ~₹363.63 — deeper intraday support
➡ Below the Pivot (~368) and especially below S2/S3, intraday weakness or pullback risks increase.
🧠 Indicator Snapshot (Short-Term Bias)
RSI (14): ~63.9 — generally neutral-to-mild bullish territory.
MACD: slightly bearish signal recently.
This mixed indicator picture suggests momentum is present but not deeply overbought, so watch price action around the pivot and first resistance/support zones closely.
📉 Moving Average Context
Key moving averages near current prices also act as dynamic support/resistance:
10D SMA ~367, 20D ~361, 50D ~345 — all below current price, indicating short-term bullish structure.
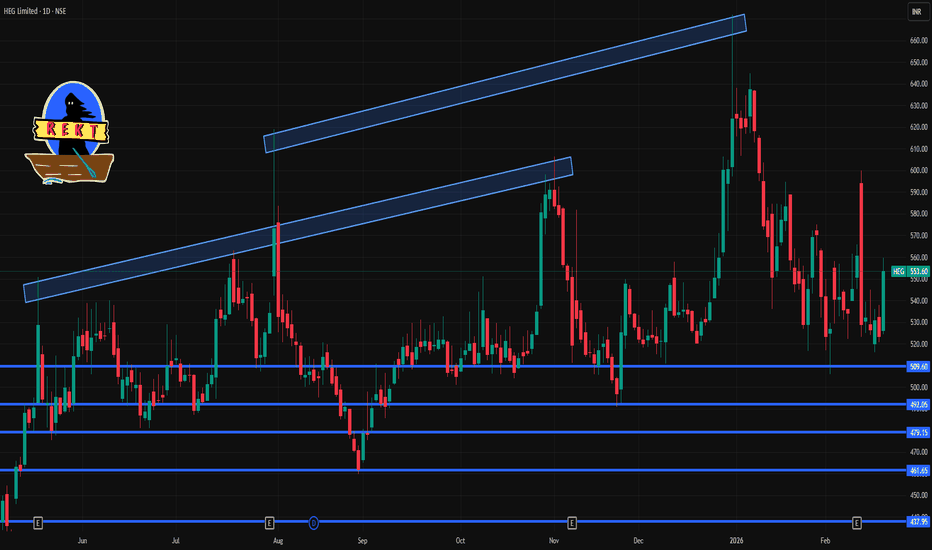
HEG 1 Day Time Frame 📊 Live Price Action Snapshot (latest)
Last traded range today: ~₹524.45 – ₹554.70 on NSE.
HEG has recently rallied on promoter buying news, lifting price toward higher intraday levels.
Overall RSI near mid-range (~42) suggests no extreme over-bought yet.
📌 Intraday Trading Guide
🟢 Bullish Scenario
If price holds above ₹540–₹547 early session → target ₹559+
Breakout on heavy volume increases likelihood of higher targets
🔴 Bearish Scenario
Failure to hold ₹519 → likely drift toward ₹507, then ₹499
Watch for weaker indicators like MACD/RSI turning negative
⚖️ Neutral/Sideways
If price stays between ₹520–₹540 without clear momentum → range trade only
📈 Indicator Context (Short-Term)
Current momentum readings show:
RSI ~42: neutral tilt — not overbought, not oversold.
MACD and ADX suggest weak trend strength — watch price action for confirmation.
This means no strong trend bias today — you’ll want to trade levels / patterns rather than ride a clear breakout unless volume accelerates.
📊 Summary — 1-Day Level Cheat-Sheet
Resistance:
🔹 R1: ~₹539–₹540
🔹 R2: ~₹547–₹548
🔹 R3: ~₹559–₹560+
Support:
🔹 S1: ~₹519–₹520
🔹 S2: ~₹507–₹508
🔹 S3: ~₹499–₹500
ETERNAL 1 Week Time Frame 📌 Current Context
Stock is trading around ₹275–₹285 range recently after weakening from higher levels.
Recent weekly action shows pressure near resistances and price dipping, indicating short-term weakness.
📊 WEEKLY Support Levels
These are key price zones on the weekly chart where the stock might find buyers:
🔹 ₹270–₹275 — Important near-term weekly support — previous consolidation area.
🔹 ₹260–₹265 — Secondary support cluster — historically a demand zone.
🔹 ₹245–₹250 — Major deeper support — below this level, broader selling could accelerate.
These support zones are derived from classic pivot and historical price action clusters.
📈 WEEKLY Resistance Levels
Levels where sellers could step in and make it harder for the price to rise:
🔸 ₹290–₹295 — First major weekly resistance / weekly pivot band.
🔸 ₹305–₹310 — Higher weekly resistance zone — watch here for breakout failure.
🔸 ₹320+ — Strong structural resistance — above this is required for bullish weekly bias.
Weekly closes above these make the trend confirmation stronger.
📌 Weekly Trend Bias (Short-Term)
Neutral to Bearish if weekly closes below ~₹275–₹270 — this keeps downside favors.
Bullish bias only if weekly closes above ~₹305–₹310 with good volume.
OLA Electric Mobility Limited 1 Week Time Frame 📉 Current Price Context
The stock recently traded around ₹28–₹30 range on NSE/BSE, having slid sharply amid weak sentiment and brokerage downgrades.
It has been near 52-week lows (~₹30-₹31) recently.
Daily technical indicators show bearish momentum and oversold conditions on RSI.
📊 1-Week Time Frame Levels (Short-Term Trading)
🔴 Immediate Resistance (Upside)
R1: ~ ₹29.50–₹30.40 – short-term price reaction zone.
R2: ~ ₹30.80–₹31.40 – near prior pivot areas.
R3: ~ ₹31.90–₹32.40 – near recent short-term supply.
If price breaks above this zone on good volume, it may see further probing toward ₹33+ in the very short term.
🟢 Immediate Support (Downside)
S1: ~ ₹28.40–₹28.90 – first floor around recent lows.
S2: ~ ₹27.90–₹27.20 – next deeper support area.
S3: ~ ₹26.50–₹26.80 – deeper low zone if breakdown accelerates. (not exact from cited sources but inferred continuation of downtrend)
Support levels are important for short-term traders to watch — a break below S2 may open sharper downside moves.
📈 Short-Term Technical Sentiment
Overall indicators are weak / bearish on 1D and 1W time frames with RSI showing oversold regions.
Bears still have momentum; bulls would need a strong weekly close above ~₹31.5-₹32 to flip short-term bias.
MPHASIS 1 Day Time Frame 📊 Daily Price & Range (Latest session)
• Mphasis has been trading roughly between about ₹2,438–₹2,501 intraday range in recent sessions. Current reference prices are in the ~₹2,450–₹2,510 zone.
📌 Daily Pivot & Levels (Classic / Pivot based)
Pivot Point: ~ ₹2,659
Upside Resistance (1D):
• R1: ~₹2,693
• R2: ~₹2,738
• R3: ~₹2,772
Downside Support (1D):
• S1: ~₹2,614
• S2: ~₹2,580
• S3: ~₹2,535**
(pivot based levels may vary slightly daily based on prior price range)
These pivots are calculated from a recent pivot analysis used by traders to gauge daily potential turning points.
📉 Alternative / Intraday Support & Resistance Zones
Intraday Support Zones (short-term):
• ~₹2,580 – ₹2,600 zone — first buffer support
• ~₹2,530 – ₹2,550 — deeper support if weakness continues
Intraday Resistance Zones:
• ~₹2,690 – ₹2,710 — near key short-term resistance
• ~₹2,730 – ₹2,770 — higher resistance cluster for daily push
📊 What This Means for Daily Trading
✔ If the price stays above the pivot (~₹2,659) with strength → bias could tilt bullish and potential move toward R1/R2 zones.
✔ A rejection below support levels (~₹2,580 / ₹2,535) may open room for further downside tests.
✔ Volume spike with breakout above resistance adds conviction to upside breaks.
NATCOPHARM 1 Month Time Frame 📊 Current & 1-Month Price Context
Over the past month the stock has traded roughly between ₹806 – ₹894 on the NSE, with observed closes in that range.
Recent prices have been volatile but staying within this ~₹800–₹900 band.
🔹 Near-Term Support Levels (1-Month Focus)
Key support zones you might watch:
₹806 – ₹810 — recent 1-month low area / first major floor.
₹817 – ₹821 — short-term pivot support and lower boundary of consolidation.
₹840 – ₹850 — mid-range support that has acted as a buffer on pullbacks recently.
These levels are typical areas where buyers have previously stepped in or price has bounced within the month.
🔺 Near-Term Resistance Levels (1-Month Focus)
Potential upside resistance levels:
₹868 – ₹875 — initial resistance from recent consolidation highs.
₹880 – ₹894 — higher resistance zone aligned with recent swings and weekly highs.
₹900+ — psychological/round number resistance (also coincides with some moving averages).
These levels often act as supply zones where price has slowed or reversed in recent weeks.
📌 Summary — 1-Month Price Band
Typical recent trading zone: ~₹806–₹894 per share on NSE.
Support cluster: ~₹806–₹840
Resistance cluster: ~₹868–₹900+
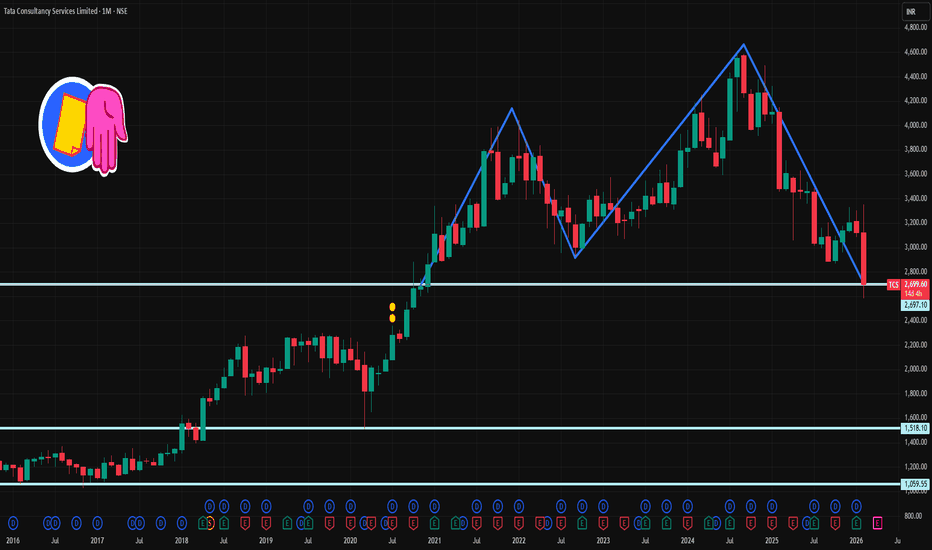
TCS 1 Month Time Frame 📌 Approx Current Price (Feb 2026)
• TCS price recently traded around ₹2,700–₹2,950 on NSE.
📉 Important 1-Month Levels — Support (Buy Zones)
• S1 ~ ₹2,910–₹2,915 — first support & pivot area.
• S2 ~ ₹2,880–₹2,880 — secondary support (near recent lows).
• S3 ~ ₹2,840–₹2,850 — deeper support zone if momentum weakens.
• Year-to-date low ~ ₹2,867–₹2,880 — structural weekly support.
📈 Important 1-Month Levels — Resistance (Sell Zones)
• R1 ~ ₹2,980–₹3,000 — first key resistance/pivot rejection zone.
• R2 ~ ₹3,015–₹3,020 — next major resistance on recent price action.
• R3 ~ ₹3,045–₹3,085 — broader resistance above current trading range.
📊 Range Structure (1M)
• Approx 1-Month Low: ~ ₹2,870–₹2,880
• Approx 1-Month High: ~ ₹2,950–₹3,050
• Common Trading Range: ₹2,880 ↔ ₹3,020
This range can act as a base for mean-reversion trades or breakout setups.
📍 How Traders Use These Levels
Bullish scenario
✔ Traders may look to accumulate near ₹2,880–₹2,850 with a close stop below zone.
✔ A breakout above ₹3,000–₹3,020 strengthens upside bias.
Bearish scenario
✘ Breakdown below ₹2,840 could see acceleration lower.
✘ Stops above ₹3,045–₹3,080 help manage risk.
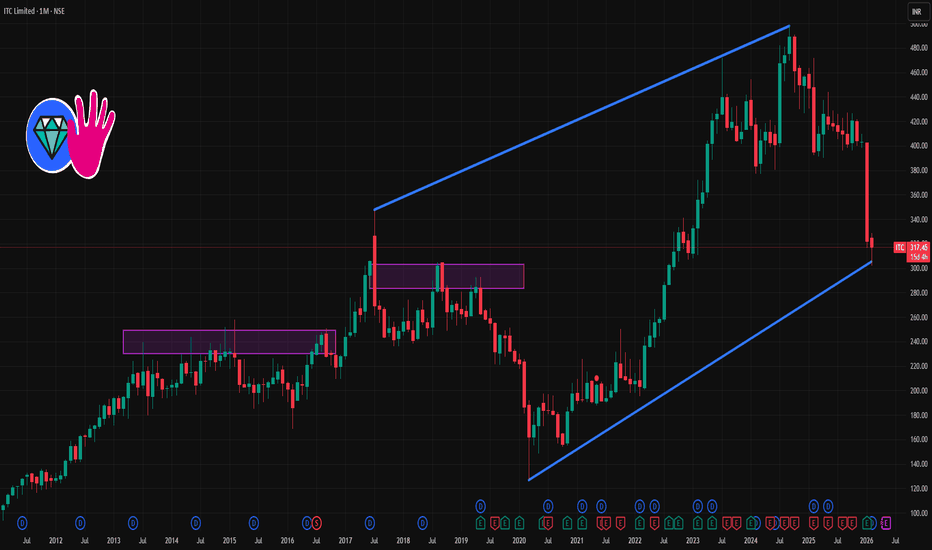
ITC 1 Month Time Frame 📌 Latest price context (today):
• Current stock price: ~₹317–₹320 range.
• RSI indicates weakness but oversold conditions.
📊 1-Month Support & Resistance Levels
🔵 Resistance Levels (Upside)
Short-term pullback levels where bears may push back:
1. R1: ~₹321–₹322
2. R2: ~₹324–₹325
3. R3: ~₹327–₹328
(These are near recent intra-day pivots and pivot extensions.)
👉 Above ₹328–₹330, the next range of interest becomes ₹335–₹340 (short-term supply zone from recent range).
🟢 Support Levels (Downside)
Key levels where buying buyers may absorb selling:
1. S1: ~₹315–₹315.6
2. S2: ~₹313–₹313.5
3. S3: ~₹309–₹310
(These reflect immediate pivot-based support levels near the recent low range.)
👉 A break below ₹309 could shift momentum toward the ₹302–₹300 zone (multi-session low range).
📈 Moving Averages (Trend Context)
Short-term trend indicators around current levels:
• 20-day EMA: ~₹326
• 50-day EMA: ~₹350
• 100-day & 200-day MAs: ~₹372–₹393
👉 The downward tilt of longer EMAs/SMA supports current bearish trend continuation near this level.
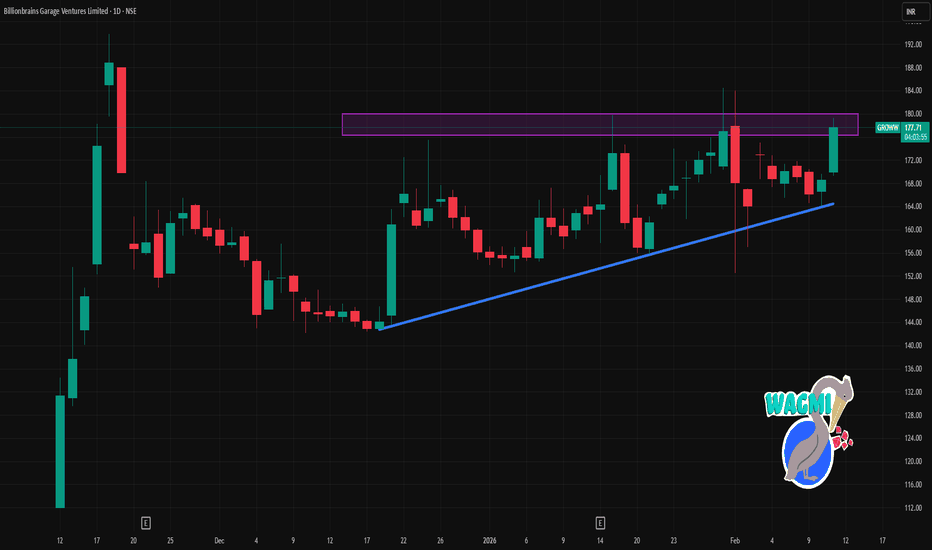
GROWW 1 Day Time Frame 📈 Daily Timeframe — Key Levels
🔁 Daily Pivot (Trend Reference)
Pivot Point (Daily): ~₹171.39 — central equilibrium price for the day. Above this suggests near-term strength; below suggests weakness.
🟢 Resistance Levels (Upside Barriers)
R1 ~ ₹175–₹176 — first resistance from pivot-based calculation.
R2 ~ ₹178–₹180 — higher resistance zone for continuation.
R3 ~ ₹203–₹235 — long-term structural resistance (classic pivot range).
👉 A clear daily close above ~₹176–₹178 would signal a stronger uptrend toward the higher zone near ₹200+.
🔴 Support Levels (Downside Floor)
S1 ~ ₹158–₹159 — first key support zone.
S2 ~ ₹139–₹140 — next support if price weakens further.
S3 ~ ₹107–₹110 — deep structural support (prior low).
👉 A breakdown below S1 (~₹158) on daily close increases probability of move toward ~₹139–₹140.
📊 Short-Term Intraday Pivots & Levels (Quick Reference)
From intraday brokers — similar daily-trend levels:
Daily Pivot ~₹169.7
R1 ~₹171.3
R2 ~₹173.4
R3 ~₹175.0
S1 ~₹167.6
S2 ~₹166.0
S3 ~₹163.9
⚠️ These are useful for intraday flow but daily pivot levels listed above are more relevant for 1-day timeframe.
📌 Current Technical Bias
RSI around mid-neutral (~55) suggests no extreme overbought/oversold condition.
Moving averages (10-EMA, 20-EMA) close to price — potential range compression.
Conclusion:
📈 Bullish scenario: Sustained daily close above ₹175–₹178 targets ₹190+ → ₹200+.
📉 Bearish scenario: Failure below ₹158–₹159 could target ₹140 or lower.
CRUDEOIL 1HR SIDEWAYS DOWNTREND Crudeoil update
Oil prices slipped a 110+ points because traders are adjusting their positions after recent news.
On the one hand, talks between the U.S. and Iran last Friday showed some willingness to continue diplomacy, which reduced immediate fears of a U.S. military strike. That calmed the market, leading to mild selling in oil. On the other hand, Iran has not agreed to stop enriching nuclear fuel and has warned it could launch missile attacks across the Middle East if the U.S. attacks. So the risk hasn’t gone away.
if tensions flare up again, crude could easily move back
Crude has seen volatile swings recently due to geopolitical drivers — U.S.–Iran tension spikes lifted prices, while easing diplomatic fears pulled them back. This creates chop on the 1-hour chart, making breaks of key levels meaningful for intraday direction.
Symmetrical Triangle Masterpiece : Multi-Layout W,DtfStep into this dynamic multi-layout window opened right in front of you—a split-screen showcase of pure price action artistry.
Left Side: Weekly Timeframe
Here, a symmetrical triangle (a classic continuation or reversal pattern formed by two converging trendlines of equal slope) takes center stage. Framing it are a green uptrend line (connecting higher lows for bullish structure) and a red downtrend line (linking lower highs for bearish pressure), creating a tightening coil of market indecision. A subtle white counter-trend line (acting as dynamic support/resistance opposing the main trend) adds layers of geometric elegance, hinting at its heightened significance when viewed on lower timeframes.
Right Side: Daily Timeframe
Flipping to the daily chart reveals how this white line shines as a pivotal counter-trend barrier, interacting seamlessly with intraday swings. Multi-timeframe analysis (comparing higher timeframe structure with lower timeframe details for confluence) illustrates the fractal beauty......how weekly patterns cascade perfectly into daily price action without a single forecast or bias.
This is markets at their most poetic: old-school chart patterns and trendlines weaving symmetry across scales. No predictions, just appreciation for the elegance.
Disclaimer: This post is for educational and illustrative purposes only, highlighting historical price action and chart patterns. It does not constitute financial advice, trading recommendations, or predictions of future market movement. Always conduct your own research and consult a professional advisor
INFIBEAM 1 Week Time Frame 📌 Current Price Snapshot
📍 Latest traded price: ₹16.25 – ₹16.30 approx. (last session)
📈 52-week range: ₹13.63 (low) – ₹22.02 (high)
📊 Near-Term 1-Week Technical Levels
🔰 Pivot Point (Reference)
Pivot: ~₹15.6 – ₹15.7 (neutral zone for short-term bias)
🛑 Resistance (Upside Targets)
These are levels where price may face selling pressure this week:
Level Mark (Approx) Notes
R1 ~₹15.8 – ₹16.0 First hurdle near current action zone
R2 ₹16.3 – ₹16.4 Key near-term resistance — breakout above this could add momentum
R3 ₹16.8 – ₹17.0 Next upside target if buyers remain strong
👉 A decisive daily close above ~₹16.4–₹16.5 can open the door toward ₹17.0+ in the week.
🧱 Support (Downside Floors)
These are levels where dips may find buyers this week:
Level Mark (Approx) Notes
S1 ₹15.3 – ₹15.4 First strong support — psychologically key pivot band
S2 ₹15.0 – ₹15.1 Next cushion below if the market weakens
S3 ₹14.8 – ₹14.7 Deeper support zone if selling accelerates
👉 A breakdown below ~₹15.0 would increase bearish pressure for the week.
📈 Short-Term Bias Interpretation
Bullish scenario:
If price holds above ₹15.6–₹15.7 pivot and breaks ₹16.3–₹16.4, the next near-term move could be toward ₹16.8–₹17.0+.
Neutral / range-bound:
Between ₹15.3 and ₹16.3, expect consolidation/trading range.
Bearish scenario:
Sustained trading below ₹15.3 risks weakening into ₹15.0 and lower.
🧠 Quick Trading Guide (1-Week)
📍 Watch for reaction at:
✔ Above ₹16.3–₹16.4 = possible upside extens ion
✔ Below ₹15.3 = risk of deeper pullback
📊 Trend cues: Recent technical indicators show mixed momentum — short-term range with pickup if buyers assert near pivot area.
SAMMAANCAP 1 Month Time Frame 📈 Current Snapshot (as reference)
Last traded / recent price around ~₹147 – ₹151 on NSE (varies with intraday moves).
52‑week range: ~₹97 – ₹192.9.
🔑 1‑Month Key Levels – NSE Pivot, Support & Resistance
Monthly Pivot Levels (short‑term framework):
These come from pivot analysis that captures intermediate trend areas over the past sessions — useful for 1‑month traders.
📍 Pivot Reference (Monthly)
Pivot (central reference): ~₹146‑₹147
This is the main gravity level — above it suggests bullish bias; below implies bearish bias in the short term.
🛑 Resistance Levels (Upside)
These are zones where price may face selling pressure if it rallies:
R1: ~₹155 – ₹157
R2: ~₹164 – ₹165
R3: ~₹173 – ₹175
Resistance areas represent possible profit‑taking or reversal zones near recent reaction highs.
🧱 Support Levels (Downside)
These levels may act as demand zones if price corrects:
S1: ~₹137 – ₹138
S2: ~₹128 – ₹130
S3: ~₹120 – ₹122
Below S1, sellers may dominate, with deeper support closer to S3 in an extended correction.
⚠️ Note
These levels are derived from pivot and technical data (not financial advice). Market news/events (e.g., legal developments, earnings) can quickly shift short‑term trend dynamics, so use stops and risk management if trading.
CREDITACC 1 Week Time Frame 📌 Current Price Context (21 Jan 2026)
Approx current price: ~₹1,330 – ₹1,370 on NSE as of recent trading session.
📊 Weekly Technical Levels (1-Week Timeframe)
These levels are derived from recent weekly pivot analysis (reflecting highs/lows and average weekly trend):
Weekly Pivot Point: ~ ₹1,300 – ₹1,305
Weekly Resistance Levels:
R1: ~ ₹1,325 – ₹1,330
R2: ~ ₹1,350 – ₹1,360
R3: ~ ₹1,375+
Weekly Support Levels:
S1: ~ ₹1,275 – ₹1,280
S2: ~ ₹1,250 – ₹1,255
S3: ~ ₹1,225 – ₹1,220
(Classic pivot study — see weekly pivot table)
📈 Short Summary of Weekly Bias
Bullish scenario:
if the price sustains above weekly pivot (~₹1,300) and breaks above R1 (~₹1,330), momentum favors moves toward R2 (~₹1,350-1,360) and possibly R3 (~₹1,375) for the coming week.
Neutral / Range scenario:
Between ₹1,275 to ₹1,330, price tends to oscillate within the weekly range with no clear directional bias — traders watch pivot and R1/S1 zones.
Bearish scenario:
A break below S1 (~₹1,275) increases the risk of deeper probes toward S2 (~₹1,250) or S3 (~₹1,220) on the weekly chart.
📌 How to Use These Levels
1. Short-term traders (swing): Watch catalystsensing breaks above R1/R2 for bullish continuation setups or break below S1/S2 for bearish setups.
2. Position traders: Weekly pivot and 50/100 SMA clusters (around ₹1,300-₹1,340) act as key decision zones for holding or trimming positions.
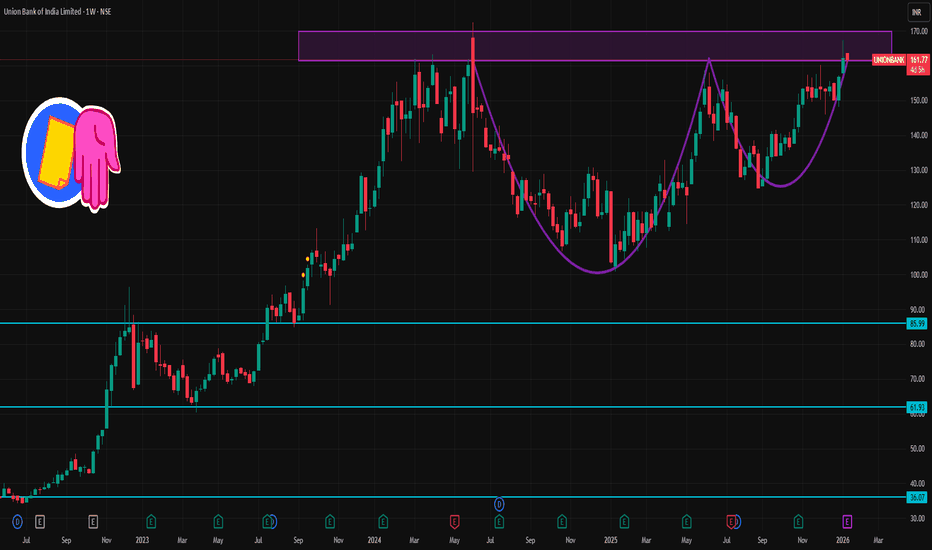
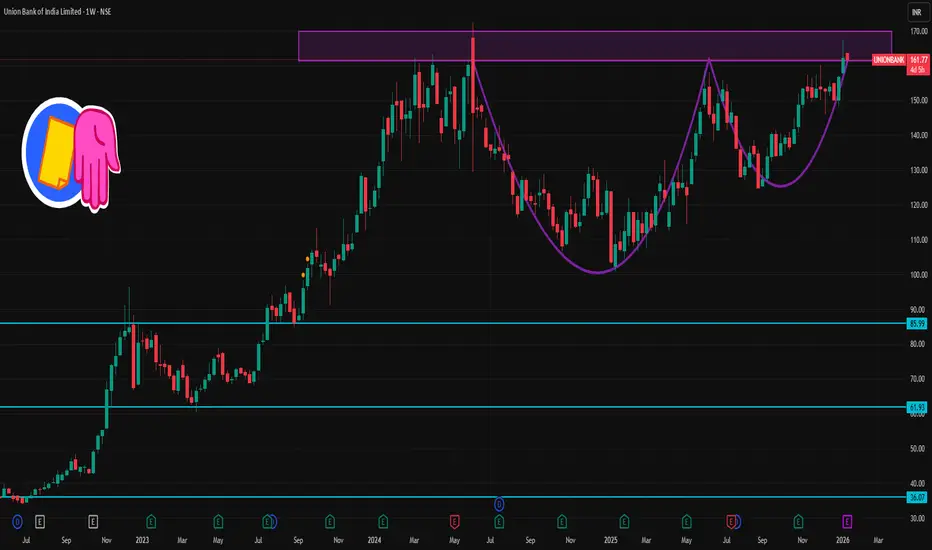
UNIONBANK 1 Week Time Frame 📊 Current Price (Weekly Context)
~₹162 – ₹163 per share (latest live/NSE quote).
📈 Weekly Support & Resistance Zones (Approx)
Resistance Levels (Upside)
These are key levels to watch if the weekly price continues uptrend:
• R1 ≈ ₹167–₹168 – immediate resistance near recent 52‑week high.
• R2 ≈ ₹170–₹172 – near psychological/upper range targets.
• R3 ≈ ₹175+ – extended zone if momentum accelerates (trend continuation).
Support Levels (Downside)
Important weekly support levels where pullbacks could find buying support:
• S1 ≈ ₹158–₹159 – near recent short‑term pullback zone.
• S2 ≈ ₹155–₹156 – near mid‑range cluster of moving averages.
• S3 ≈ ₹150–₹152 – deeper support aligned with 50‑day average zone.
🔄 Technical Indicators Outlook (Weekly / Short‑Term)
Momentum & Trend:
Weekly technicals show bullish momentum with RSI moderately bullish and MACD positive on recent data.
Price remains above key EMAs (20, 50, 100, 200 averages), which supports the uptrend.
Volatility:
ATR and trend indicators suggest active movement, so breaks above/below key levels can lead to sustained swings.
📌 Quick Weekly Levels Summary (Approx)
Level Type Price Zone
R3 (Strong Resist) ₹172–₹175+
R2 (Next Resist) ₹170–₹172
R1 (Immediate Resist) ₹167–₹168
Current Price ₹162–₹163
S1 (Immediate Support) ₹158–₹159
S2 (Mid Support) ₹155–₹156
S3 (Strong Support) ₹150–₹152
Multi-Timeframe Channel Mastery UnveiledTradingView's multi-window layout reveals pristine price action across weekly and monthly charts, highlighting structural precision without forecasts.
Both timeframes demonstrate unwavering respect for key lines and zones, underscoring market geometry's reliability.
Monthly Chart Insights
The right-side monthly view features a robust supply zone where sellers dominate, enforcing repeated rejections with textbook accuracy. A white trend line provides dynamic support, paired with the red parallel channel line creating a textbook channel that price honors meticulously. This setup exemplifies how channels contain swings beautifully.
Weekly Chart Patterns
On the left, weekly timeframe displays two pivotal pattern lines: a counter trend line and a primary trend line, both tracked flawlessly through advances and retreats. These lines form the backbone of the structure, filtering noise and revealing order in motion.
Disclaimer
Purely educational analysis of past price action—no advice, signals, or predictions provided. Trading carries high risk of capital loss; perform independent due diligence and seek professional guidance.
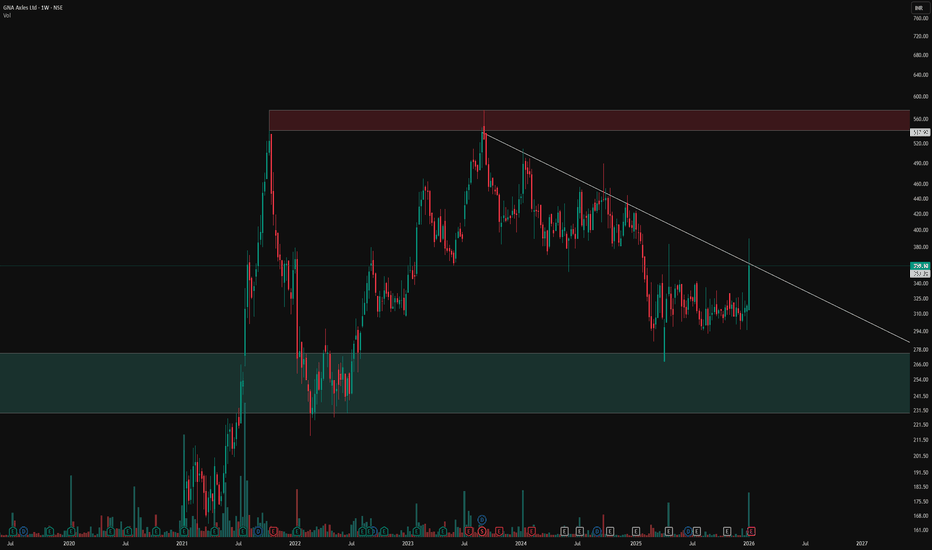
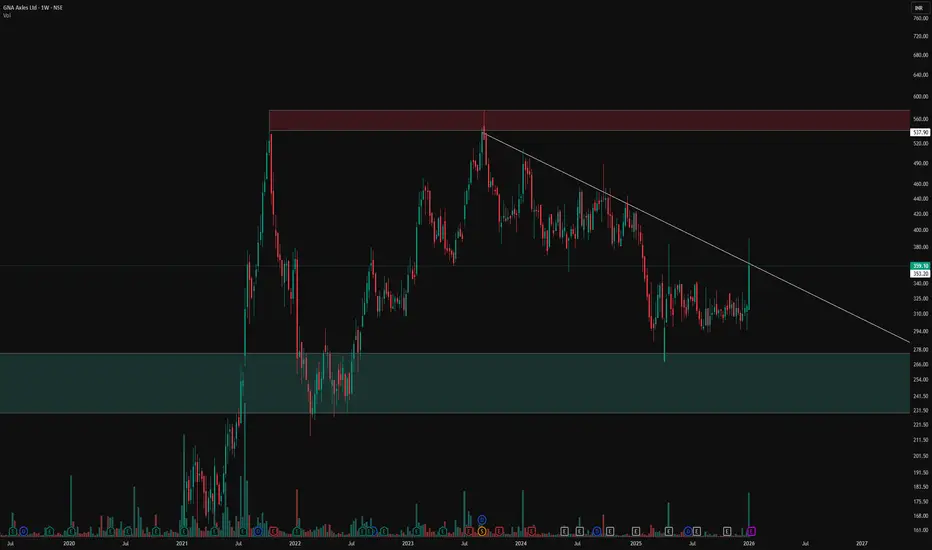
Weekly Timeframe Price Action MasteryObserve the red supply zone where price consistently faces resistance, halting upward moves with precision. The green demand zone, formed after a decisive breakout from prior resistance, now acts as robust support for subsequent bounces. The white counter trend line serves as the pattern's key action line, guiding price movements with remarkable adherence across multiple tests.
Zone Dynamics
Supply zones in red mark areas of overhead selling pressure on weekly charts, often leading to rejections. Demand zones in green emerge post-breakout when former resistance flips, attracting buyers on retracements. These zones filter noise effectively in trending markets.
Counter Trend Line Role
This white line defines the counter-trend structure, respected through pullbacks and rallies. Price follows it as a dynamic guide, confirming pattern integrity without implying direction. Such lines enhance zone analysis by highlighting momentum shifts.
Disclaimer
This post showcases historical price action only and constitutes neither financial advice nor trading signals. Trading involves substantial risk of loss; conduct your own analysis and consult professionals.
SHRIRAM - Buy - SwingTrading #Shriram Finance Limited - #Technical Analysis
Price: 854.90
#Technical Setup
Pattern: Continuation pattern with bullish hidden divergence following weekly breakout
Key Levels:
- Target 1: 877.00
- Target 2: 936.55
- Target 3: 967.55
- Support: 838 - 825 (critical)
- Major Support: 730.45
#Outlook
The chart shows a swing trading setup with upside potential toward 877 - 967 if support at 838 holds. A break below 825 would invalidate the bullish structure.
DISCLAIMER
This is NOT investment advice. This analysis is for educational purposes only. Trading involves substantial risk of loss. Always conduct your own research and consult a SEBI-registered financial advisor before making investment decisions. Past performance and technical patterns do not guarantee future results. The author assumes no responsibility for any losses incurred.
Classic Descending Channel With Clear Structural LevelsThe primary feature of this chart is the broad descending parallel channel marked by the orange lines, which frames the entire corrective phase in a neat, orderly manner. Price has repeatedly respected both the upper and lower boundaries, reinforcing the relevance of this channel as a dominant structure.
A trend‑changing resistance line is drawn in white, connecting swing highs and visually separating the prevailing downtrend from any potential shift in behavior. This line serves as a clear reference for how price has reacted to supply zones within the channel, without implying any future breakout or directional bias.
The red dotted line acts as an internal, hidden line derived from prior price interaction, helping to map out the internal rhythm of the move. Overall, the chart is intended purely as a structural illustration of how price respects channels and internal reference lines, without any forecast or trade signal.
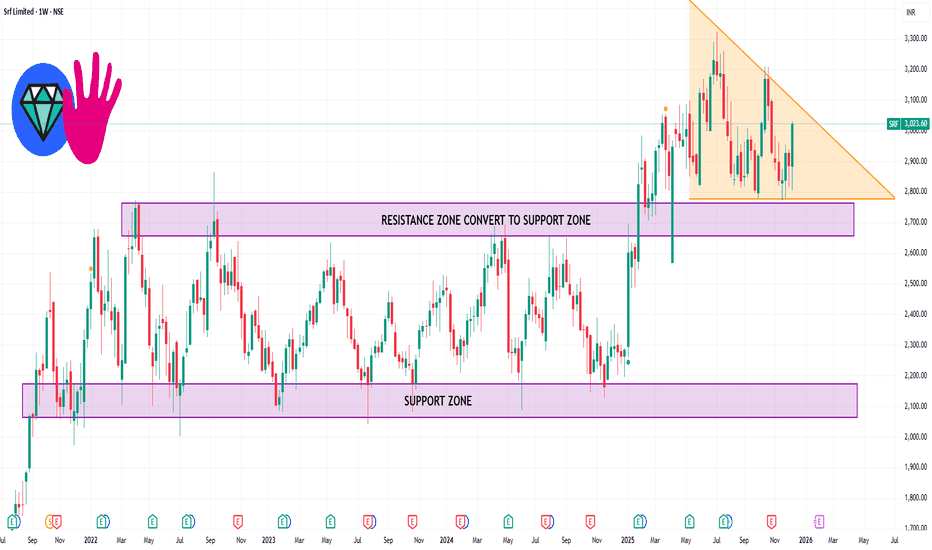
SRF 1 Week Timw Frame 📌 Current Price Context (as of latest close):
• SRF was trading around ₹3,023–₹3,024 recently.
📊 Weekly / Short-Term Key Levels
📈 Resistance Levels
These are possible upside targets where price may face supply pressure:
R1 (Immediate resistance): ~₹2,971–₹2,990 — key level to break for near-term upside.
R2: ~₹3,007–₹3,031 — next hurdle after R1.
R3 / Higher Resistances: ~₹3,060–₹3,100+ zones if momentum continues.
A close above ₹3,000–₹3,030 on the weekly chart often signals stronger short-term bullish bias.
📉 Support Levels
These are downside floors that may act as buyers’ interest zones:
S1 (Immediate support): ~₹2,873–₹2,900 — first key support area.
S2: ~₹2,811 — deeper support if the first level breaks.
S3: ~₹2,775 or lower — if broader weakness materialises.
📌 Weekly Pivot Level
• Pivot zone around ₹2,950–₹2,990 can act as a gauge of short-term trend direction. Above it = bullish bias; below it = bearish bias.