BTC/USDT - Buyers Push Higher!Hi traders, how are you viewing this pullback?
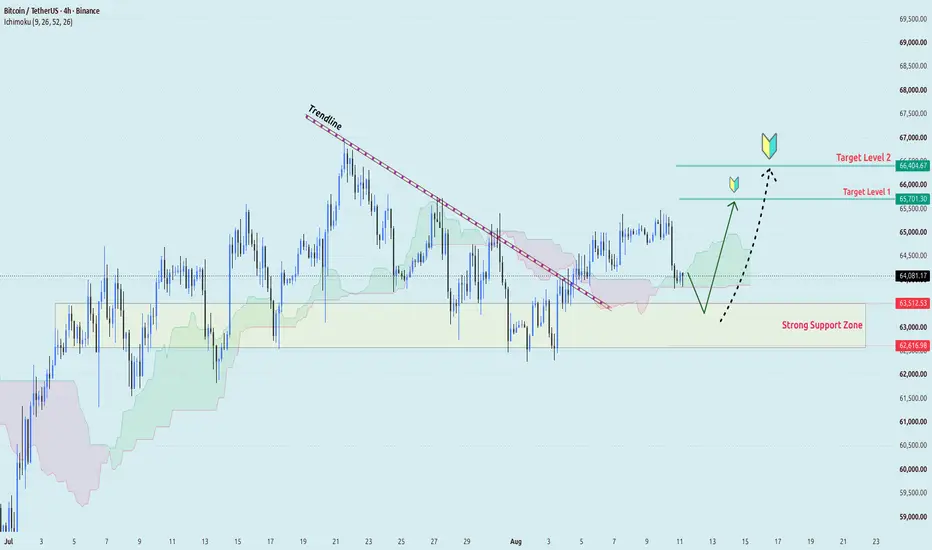
BINANCE:BTCUSDT broke out of the descending trendline and extended to the 65,000+ region, but is now retesting the breakout structure. For me, the 62,600–63,500 region is the most noteworthy area right now.
If buyers continue to defend this support and the price regains momentum above the Ichimoku cloud, I still favor a pullback to the following regions:
🎯 Target 1: 65,700
🎯 Target 2: 66,400
I don't want to chase the price midway through the rally. A clear bullish reaction from support would result in a cleaner setup and easier risk management.
If the H4 closes below 62,600, the current bullish structure will lose much of its advantage and needs to be re-evaluated.
AURICVERSE View: A breakout has occurred, but the 63K level is where it will show whether buyers truly want to continue the trade.
How are you reading this structure? Share your view below.  Long
Long
XAU/USD - Bulls strong, Next signal upwardHi traders, are you waiting for gold to pull back before continuing?
OANDA:XAUUSD has clearly broken the descending trendline and left the consolidation zone around 4,050–4,100 with a fairly decisive upward move. The price is currently above the Ichimoku cloud, so the H4 structure is still leaning towards buyers.
My area of interest right now is 4,300–4,360. If gold corrects to this level but the selling pressure isn't strong enough to break through, this will be a noteworthy area for a continued upward move.
🎯 Target: 4,550
On the other hand, the new day's macroeconomic outlook continues to support the bulls: weak US labor data has reduced expectations of a Fed interest rate hike, while US-Iran tensions continue to maintain safe-haven demand.
However, tomorrow's US CPI data could significantly increase volatility, so I still prefer waiting for price confirmation rather than FOMO.
If the H4 chart loses 4,300 and retraces back into the breakout zone, the bullish scenario will need to be reconsidered.
AURICVERSE View: The current trend remains positive, but after such a rapid increase, a clean pullback would be more appealing than chasing the price.
How are you reading this structure? Share your view below.  Long
Long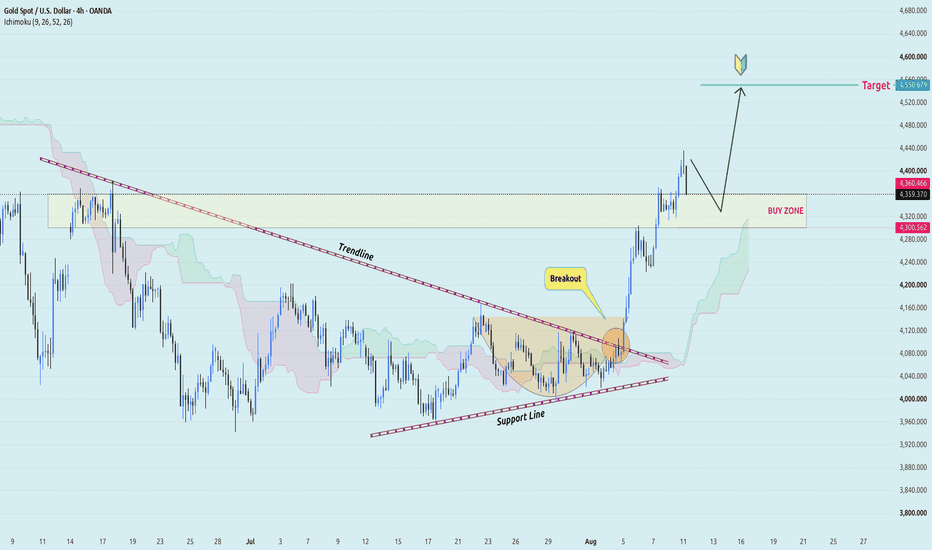
XAU/USD - Buyers Heading Towards New Aim!Hi traders, are you viewing this dip as a pullback or a sign of losing momentum?
OANDA:XAUUSD is correcting quite well after a series of consecutive higher highs at H1 chart. The price is currently back in the 4,350–4,390 range, and is close to the lower edge of the ascending channel — this is the area I want to observe the buyer reaction.
If this area holds and buying pressure returns on the H1 chart, I still favor the scenario of a continued upward movement:
🎯 Target: 4,530
In my opinion, the key point is that short-term momentum has slowed down and the price is below the Ichimoku cloud, so I don't want to enter too early before confirmation.
If the H1 chart clearly breaks 4,350 and loses the lower edge of the ascending channel, the current bullish structure will weaken significantly.
AURICVERSE View: The overall trend isn't bad yet, but the 4,350–4,390 range is where buyers need to prove they still have control.
How are you reading this structure? Share your view below. Long 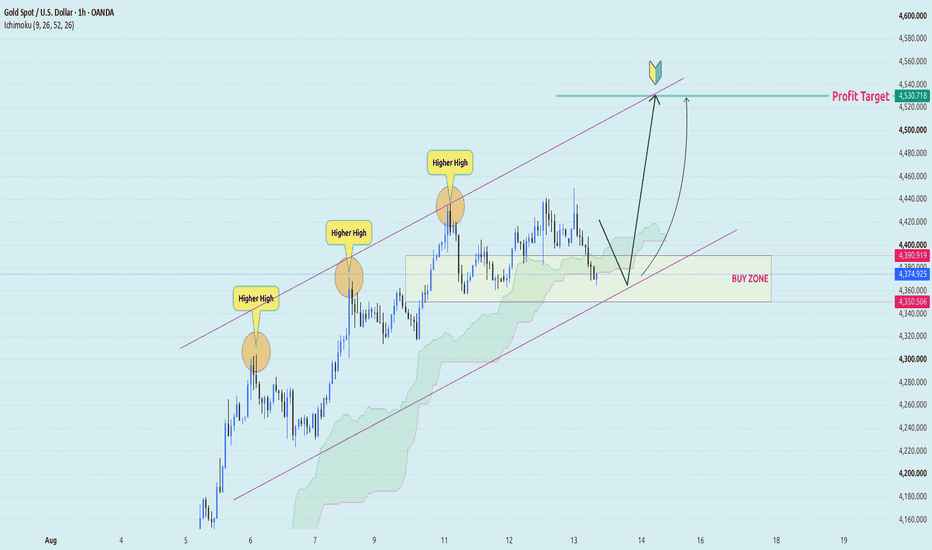
Long 
SENSEX TRADING PLAN | 20th AUGUST 2026Previous Close: 76,909.68
Chart Basis: 15-Minute Timeframe | Key Structural Levels
Gap Consideration: 300+ Points (High Volatility Gap Scenario)
🎯 CRITICAL LEVELS FOR TODAY
📍 Level Price
🔴 Major Target Resistance 77,451
🔴 Last Intraday Resistance 77,216
🟠 Opening Resistance/Support 77,068
⚪ Previous Close 76,909.68
🟢 Opening Support Zone 76,532 – 76,680
🟩 Last Intraday Support (Reversal Zone) 76,221
📚 Learning Point: A 300+ point gap is considered a "large gap" and reflects a strong overnight trigger (global cues, major news, or event-based reaction). Large gaps carry higher volatility and higher risk of sharp reversals — extra caution and wider stop-losses are required compared to normal gap days.
🟢 SCENARIO A: GAP-UP OPENING (300+ Points) | Opens Above 77,210
🔍 Understanding the Setup:
A 300+ point gap-up signals a major bullish trigger overnight. Such large gaps often see initial follow-through buying, but they also carry a higher probability of profit-booking due to overextended moves. The first 15-30 minutes are crucial to gauge real strength.
📋 Action Plan:
1️⃣ First 15-Minute Rule: With large gaps, avoid entering in the opening candle itself — volatility is extreme and spreads widen. Let price test 77,216 (Last Intraday Resistance) and observe reaction.
2️⃣ Bullish Continuation Setup: If the 15-min candle closes firmly above 77,216 with strong volume, this confirms genuine buying strength. Enter long on a shallow dip toward 77,068-77,150, using it as fresh support.
3️⃣ Trend/Momentum Traders: Once 77,216 is reclaimed as support, target the extended move toward 77,451 — marked as the next major resistance zone.
4️⃣ Gap-Fill Trap Alert 🚨: Large gap-ups (300+ points) have a higher tendency to partially fill due to profit booking. If price fails to sustain above 77,068 and slips back toward the previous close of 76,909, avoid fresh longs — this indicates exhaustion, and a gap-fill move toward 76,680 zone becomes likely.
🎯 Trade Levels:
Target 1: 77,300
Target 2: 77,451
Stop-Loss: 77,050 (on closing basis)
💡 Options Insight:
Large gap-ups cause a sharp spike in IV, making Call premiums extremely expensive at open. Avoid chasing ATM/ITM calls immediately. Prefer waiting 20-30 minutes for volatility to settle, or use a Bull Call Spread to control premium cost while capturing directional upside.
⚪ SCENARIO B: FLAT OPENING | Opens Between 76,610 – 77,210
🔍 Understanding the Setup:
A flat opening after a volatile previous session suggests the market is digesting recent moves before committing to a fresh direction. This is a session that rewards patience over prediction.
📋 Action Plan:
1️⃣ Observation Window: Allow the first 15-30 minutes to build a defined trading range. Avoid early directional bets.
2️⃣ Pivot Zone Strategy: The 77,068 level (Opening Resistance/Support) is the key pivot for the day.
Sustained close above 77,068 → Bullish bias triggers → Look for longs targeting 77,216 → 77,451.
Sustained close below 77,068 → Bearish bias triggers → Look for shorts targeting 76,680 → 76,532.
3️⃣ Alert-Based Trading: Set alerts at 77,216 (breakout) and 76,221 (breakdown). A confirmed close beyond either level with strong volume defines the real intraday trend.
4️⃣ Range Scalping (Experienced Traders Only): Buy near 76,680 targeting 77,068; Sell near 77,068 targeting 76,680. Maintain tight stop-losses — this only works while the market stays range-bound.
🎯 Trade Levels:
Bullish Setup: Above 77,068 → Targets: 77,216 / 77,451 | SL: 76,950
Bearish Setup: Below 77,068 → Targets: 76,680 / 76,532 | SL: 77,150
💡 Options Insight:
Flat sessions after volatile days often see elevated IV cooling down gradually — this favors premium-selling strategies (Iron Condor, Short Strangle) for experienced traders with proper hedges. Option buyers should wait for a clear breakout/breakdown confirmation before committing capital.
🔴 SCENARIO C: GAP-DOWN OPENING (300+ Points) | Opens Below 76,610
🔍 Understanding the Setup:
A 300+ point gap-down indicates a strong negative overnight trigger — could be global sell-off, negative news, or heavy FII outflows. Such sharp gaps often see continued selling pressure initially, but also carry high reversal potential once oversold levels are reached.
📋 Action Plan:
1️⃣ First 15-Minute Rule: Avoid shorting on the opening candle. Let price test the Opening Support Zone (76,532-76,680) and observe the reaction.
2️⃣ Bearish Continuation Setup: If price sustains below 76,532 with a confirmed 15-min close, look for shorts on a pullback toward 76,600-76,680, keeping a well-defined stop-loss above the zone.
3️⃣ Breakdown Continuation: A confirmed break and close below the opening support zone opens the path toward 76,221, marked as a historically important reversal support.
4️⃣ Critical Reversal Zone 🚨: 76,221 is flagged as an important support for price reversal. If the market reaches this level, avoid fresh shorts. Watch closely for reversal signals — bullish candlestick patterns, RSI divergence, or a sudden volume spike — before considering a bounce-back long trade.
🎯 Trade Levels:
Target 1: 76,680
Target 2: 76,532
Target 3 (Reversal Zone): 76,221
Stop-Loss: 76,750 (on closing basis)
💡 Options Insight:
A 300+ point gap-down causes a sharp IV spike, making Put premiums very expensive at open. A Bear Put Spread helps manage cost while maintaining directional exposure. Near the 76,221 reversal zone, consider booking partial profits on puts rather than holding blindly — sharp gap-down days often see equally sharp relief rallies from key support.
⚠️ ESSENTIAL RISK MANAGEMENT TIPS FOR OPTIONS TRADING (LARGE GAP DAYS)
✅ Reduce Position Size on Gap Days: Large gaps (300+ points) bring higher volatility — trade with smaller position sizes than usual to manage risk effectively.
✅ Wait for Volatility to Settle: The first 15-30 minutes on big gap days often see erratic price swings. Avoid entering trades in this window.
✅ Beware of IV Crush: After a large gap, IV often spikes and then contracts sharply once the initial move plays out — this can hurt option buyers even if direction is correct.
✅ Use Spreads Over Naked Positions: On high-gap volatility days, spreads (Bull Call Spread / Bear Put Spread) help control cost and reduce risk compared to naked option buying.
✅ Always Define Stop-Loss Before Entry: Big gap days move fast — decide your risk tolerance in advance, not reactively.
✅ Watch for Gap-Fill Tendency: Large gaps (both up and down) have a statistical tendency to partially fill during the session — factor this into your target planning.
✅ Avoid Revenge Trading: If the first trade goes against you on a volatile gap day, step back and reassess rather than immediately re-entering.
✅ Track Overnight Triggers: For 300+ point gaps, always identify the underlying reason (global markets, crude oil, major news, RBI/Fed policy, geopolitical events) — this helps gauge whether the move has follow-through potential or is an overreaction.
📝 SUMMARY & CONCLUSION
Today's trading plan for 20th August 2026 on SENSEX is structured around key levels: 77,451 (major resistance), 77,216 (last intraday resistance), 77,068 (opening pivot), 76,532-76,680 (opening support zone), and 76,221 (major reversal support).
🔹 Gap-Up Opening (300+ pts): Validate strength above 77,216 before committing to longs — be alert for a gap-fill move if 77,068 fails to hold.
🔹 Flat Opening: Let the range form around the 77,068 pivot zone — trade the confirmed breakout/breakdown, not the guess.
🔹 Gap-Down Opening (300+ pts): Shorts remain favored down to 76,532-76,221, but treat 76,221 as a high-probability reversal zone rather than a blind continuation target.
🎯 Golden Rule for Large Gap Days: Bigger gaps mean bigger risk and bigger opportunity — but only for those who wait for confirmation. Never let excitement override discipline; let the market prove its direction before you commit capital.
⚠️ DISCLAIMER
I am not a SEBI registered analyst. This content is shared purely for educational purposes to demonstrate how traders can plan for different market opening scenarios (especially large gap days) using technical levels and structure. This is not a buy/sell recommendation or investment advice of any kind. Please consult a SEBI registered financial advisor before making any trading or investment decisions. Trading in equities, options, and derivatives involves substantial risk of loss, especially on high-volatility gap days, and may not be suitable for all investors. Trade responsibly and at your own risk. 🙏  Short
Short
NIFTY : Intraday Trading Plan | 20-Aug-2026🕘 Focus: Opening reaction, first 60 minutes, and gap-based direction
📍 Reference Zone: 24078
📊 Key Levels on Chart:
Opening Resistance / Support: 24092–24123
Last Intraday Resistance: 24190
Opening Support Zone: 23913–23963
Last Intraday Support / Reversal Zone: 23856
Higher Resistance Area: 24400
Market Context 🧠
The index is sitting in a zone where both buyers and sellers can become active quickly.
For gap openings of 100+ points, the first move can be emotional and unstable, so the best approach is to wait for confirmation, acceptance, and retest rather than chasing the first candle.
Key idea:
Above 24190 = bullish continuation becomes more credible 📈
Below 23963 = bearish pressure increases 📉
Between 23963 and 24190 = market may stay range-bound and reactive ⚖️
1) GAP UP SCENARIO 📈
If NIFTY opens 100+ points above 24078
That means the market is opening with strength and may try to continue higher, but only if the opening gap is accepted by the market.
Plan of Action
If price opens above 24178–24190, treat it as a strong gap-up opening.
Do not buy call options immediately in the first candle. Wait for the first 5–15 minute candle to settle.
If the price holds above 24190 and then retests 24092–24123 successfully, that zone can act as a launch pad for further upside.
In such a case, bullish targets can be 24240, then 24300, and if momentum stays strong, 24400. 🚀
Why this matters
24190 is the key intraday resistance. A breakout and hold above it can force short covering.
24092–24123 is a very important area for confirmation. If this zone holds after the gap-up, it shows acceptance, not just a one-time spike.
If the market fails to hold above 24123 or falls back below 24190, the gap-up may start getting sold into. In that case, traders should avoid overconfidence and watch for a fade back toward 24078 or even 23963.
Possible Trade Plan
Entry: Buy only after breakout + retest above 24190 or after a successful bounce from 24092–24123
Stop-loss: Below the retest candle low or below 24123
Targets: 24240 / 24300 / 24400
Avoid: Chasing the first green candle blindly ⚠️
2) FLAT OPEN SCENARIO ⚖️
If NIFTY opens near 24078 or within a narrow range
This suggests a balanced market where neither bulls nor bears have clear control at the open.
Plan of Action
Treat the session as a range-bound opening until a clear breakout happens.
If price remains between 23963 and 24123, the market may chop for some time.
Wait for the first breakout from this band before taking a directional trade.
A move above 24123 followed by a break of 24190 increases bullish probability.
A move below 23963 increases bearish probability and can open the way to 23913 and 23856.
Why this matters
Flat openings often produce false breakouts in the first 15–30 minutes.
Traders who enter too early may get trapped in whipsaws.
A cleaner setup comes when price clearly accepts above resistance or below support.
Possible Trade Plan
Bullish setup: Buy only if price sustains above 24123 and later clears 24190
Bearish setup: Sell only if price breaks below 23963 and retests it as resistance
Stop-loss: On the opposite side of the breakout zone
Targets:
Long side: 24190 → 24240
Short side: 23913 → 23856
Avoid: Random entries in the middle of the range ⏳
3) GAP DOWN SCENARIO 📉
If NIFTY opens 100+ points below 24078
This indicates early weakness and possible selling pressure, but it is still important to check whether the gap down is being sold further or being bought back.
Plan of Action
If the market opens below 23978, treat it as a strong gap-down opening.
If price also stays below 23963, bearish control becomes more reliable.
In that case, downside levels to watch are 23913, then 23856.
23856 is an important support zone where a reversal or sharp bounce may appear.
Why this matters
A gap down is not automatically bearish forever.
If price quickly reclaims 23963 and later 24078, it can trigger a short-covering bounce.
If price reclaims 24123, then the gap-down weakness is likely failing.
In that case, selling pressure may reduce, and bullish traders can look for reversal signs.
Possible Trade Plan
Entry: Short only after breakdown below the opening low or rejection near 23963–23913
Stop-loss: Above 23963 or above the rejection candle high
Targets: 23913 / 23856
Reversal clue: If price reclaims 24078 and then 24123, bearish momentum may weaken
Avoid: Buying puts immediately at the open without confirmation ⚠️
Options Trading Risk Management Tips 🛡️
Trading options requires discipline because premium moves can be faster than the underlying index.
Important Tips
Trade the level on NIFTY first, not just the premium. Premiums can decay quickly due to theta and volatility.
Use a fixed risk per trade — ideally 0.5% to 1% of total capital only.
Avoid averaging losing positions in weekly options. One wrong average can damage the account fast.
Prefer liquid strikes near ATM or slightly ITM for cleaner execution and lower slippage.
Keep stop-loss on the index structure, not only on the option premium.
Book partial profit at the first target and trail the stop-loss for the remaining quantity.
Reduce position size on gap days because volatility can expand quickly in both directions.
Avoid overtrading if the market is stuck between key levels. Patience protects capital.
If the setup fails, exit fast. Capital preservation is also a winning strategy 📌
Do not trade with emotion after a gap-up or gap-down surprise. Wait for confirmation.
Summary & Conclusion ✅
For 20-Aug-2026, the market structure is very clear:
Above 24190 → bullish continuation becomes stronger 📈
Between 23963 and 24190 → market may stay sideways and reactive ⚖️
Below 23963 → bearish pressure can expand 📉
23856 → important support for reversal or continuation decision
24400 → major higher resistance if buying continues
For 100+ point gap openings, the key is not prediction but reaction.
Let the first move show its hand, then trade only after confirmation, retest, and acceptance.
A disciplined trader survives by respecting levels, managing risk, and avoiding emotional entries. 💹✨
Disclaimer ⚠️
This post is for educational and informational purposes only and is not financial advice.
I am not a SEBI registered analyst.
Please consult your financial advisor before taking any trade, and trade at your own risk.  Short
Short
Short 
Long 
 Long
Long
 Long
Long

 Long
Long

Long 
THE GOLD TRAP IS SET — $4,373 IS THE KEY!Everyone thought Gold was finally ready to continue selling after Tuesday's bearish move — but this is exactly where the market can trap the majority. The selling we saw on Tuesday forced many traders to completely flip their bias from bullish to bearish, and now the market is showing the kind of price action that can make those sellers regret their entries. Wednesday's upside move wasn't random — the trap was already being built, and we may now be getting very close to the real move.
Basically, this upside momentum came because a lot of traders had built a bullish bias on Tuesday. However, they kept getting trapped, and during the New York session on Tuesday, we finally saw a strong selling move in the market. Looking at that move, many of the traders who were bullish on Tuesday quickly shifted their bias toward selling. And whenever traders aggressively start selling based on recent price action, the market often takes advantage of that psychology and plays the opposite game to trap them. That is exactly what we saw today.
Right now, I believe many of the traders who were selling throughout the day are confused, and some of them may still be holding onto their selling bias. If we look at the price action, the Tuesday Asian low and the area where the market formed a low around the London session were both around $4,377. From that area, the market is currently showing some resistance.
So, somewhere around here, I believe the market is already making its third or even fourth attempt to push lower. We saw sellers coming in during the Asian session, then they were trapped. After that, we saw another selling move before the London session, and now we are seeing another selling attempt during the pre-New York session. But in my view, this could be the final selling attempt of the day.
I believe we could see the $4,373 high getting broken in the short term. Once that happens, the traders who have been selling throughout the day may start giving up on their positions, thinking that the market is finally going higher. And once the majority of sellers give up and exit their selling positions, that is when I believe we could see the real selling move begin. Basically, the market could first force the sellers to give up by breaking $4,373, and then reverse aggressively to the downside — leaving those sellers with nothing but regret.
However, there is one very important condition I am watching. If the market manages to close below $4,356, then we could see a strong selling move, with the next levels around $4,330, $4,317, and eventually a breakdown toward $4,300. This move could happen within the next few hours or potentially during tomorrow's Asian session.
Now, talking about the downside, as I mentioned earlier, $4,300 has become a very important liquidity area. The market has been sustaining above $4,300 since breaking out of that level last week. Because of this, a lot of traders are currently holding buy positions around $4,300, with their stop losses placed below this area.
And this is exactly where I believe the market makers are looking for liquidity. If enough buyers are positioned around $4,300 with their stop losses underneath, the market has a clear pool of liquidity to target. So, in my view, there is a strong possibility that we could see a proper breakdown toward the downside over the next few hours.
I hope you enjoyed this quick update and, more importantly, understood the psychology behind today's move. There is a lot to learn from the way the market trapped both buyers and sellers.
Good luck, everyone. Make sure you trade with patience and discipline, and if the setup comes, lock in some good profits from Gold. And by the way, what is your current view on Gold? Let me know in the comments. Thank you.
 Education

 Education

Education

Global Financial MarketsGlobal financial markets are systems where people, companies, and governments buy and sell financial assets across the world. They help move money from those who have extra funds to those who need funds.
Main Types of Global Financial Markets:
Stock Markets – Buying and selling shares of companies (e.g., NYSE, NSE).
Bond Markets – Governments and companies borrow money by issuing bonds.
Foreign Exchange (Forex) Markets – Trading currencies like USD, EUR, INR.
Commodity Markets – Trading gold, oil, wheat, etc.
Money Markets – Short-term borrowing and lending.
Derivatives Markets – Contracts based on assets like stocks or currencies.
Importance:
Provide funds for business growth
Support international trade
Create investment opportunities
Help manage financial risks
Affect global economies
Example:
If the US stock market falls sharply, markets in Asia and Europe may also be affected because markets are connected globally.  Education

Bitcoin Forward Test: $4,500 Profit With Free Leading IndicatorsBTC Forward Testing | August 2026 | Free Leading Indicators
In this video, I forward-test Bitcoin using the free Trading Truth indicators in real market conditions.
The goal is simple: take the signals generated by the indicator, combine them with Wyckoff Market Structure, Wave Principles, Volume Analysis, and Fibonacci projections , and then manage the trades as the market unfolds.
Market: BTCUSDT
Testing: Forward Testing
Market Structure: Accumulation → Re-Accumulation → Distribution
Methodology: Wyckoff + Wave Principles + Volume + Fibonacci
Trade Direction: Long & Short
Trades Demonstrated: 5
Testing Period: Less than 2 weeks
Demonstrated Result: Approximately $4,500
What I demonstrate in this session:
How the indicator identifies potential long and short setups.
How to read accumulation, re-accumulation and distribution structures.
How Spring, SOS, Upthrust and LPS/LPSY concepts can provide market context.
How I use wave structure to anticipate potential continuation and correction phases.
How Fibonacci extensions are used to project potential Wave 3 targets.
How volume expansion and contraction help confirm market behavior.
How to trail the stop-loss as the trade develops.
How to scale out and protect profits instead of becoming greedy.
How the same framework can be used in both bullish and bearish market conditions.
The indicators shown in this video are available for free . You can add them to your own TradingView chart and forward-test the methodology yourself.
I am not asking you to blindly trust the indicator. Test it yourself, study the market structure, and decide whether the methodology fits your trading style.
Trading Truth is built around one simple idea: use mathematical market structure, price action, volume and wave behavior to understand what the market is doing — rather than relying on a single conventional indicator.
Educational Content Only. This publication is for educational and research purposes and is not financial advice. Past or simulated/forward-tested performance does not guarantee future results.
If you test the indicators yourself, let me know what you find in the comments.

Education

XAUUSD – ABC Rebound Before Selling RotationGold is holding a short-term recovery structure after bouncing from the 4,320 area, but this move still looks more like an A-B-C rebound than a full buying reversal. From Kelly’s view, price may continue pushing higher first into resistance, then face renewed selling pressure once the corrective structure is completed.
⟡ Market structure
The chart shows a completed selloff into the 4,320–4,330 region, followed by a rebound forming an A-B-C pattern. Wave A has already pushed price back above 4,350, while wave B created a shallow pullback. If buyers stay in control in the short term, wave C can extend toward the resistance band around 4,370 first, and possibly into the higher sell zone near 4,392–4,398.
That upper zone is important because it aligns with the projected end of the corrective wave and the 1.618 extension area marked on the chart. If price reaches that zone and loses momentum, the market may rotate lower again.
➤ Key levels
◌ Current price area: 4,360
◌ Near resistance: 4,368–4,372
◌ Main sell zone: 4,392–4,398
◌ Short-term support: 4,345–4,350
◌ Lower downside target: 4,330–4,333
⌁ Trading scenario
Kelly’s preferred path is a bullish push first, with price trying to complete wave C into 4,370 and then 4,392–4,398. If gold reacts bearishly from that zone, sellers may take control again and drive price back toward 4,345, then deeper into 4,330.
◌ Invalidation
If price breaks cleanly above 4,398 and holds, the bearish follow-up scenario becomes weaker and gold may extend higher.
▸ Do you think gold will complete wave C into the sell zone first, or reject earlier from 4,370? Short 
 Short
Short
BRIAN XAUUSD – GOLD BREAKS VALUE, BUT THE REACTION ZONE IS HERE BRIAN XAUUSD – GOLD BREAKS VALUE, BUT THE REACTION ZONE IS HERE
Gold is showing a deeper corrective move after failing to hold the upper value structure near 4,420 - 4,430.
The important detail on this chart is not only the drop. The key point is where gold is dropping into now.
Price has already lost the POC Acceptance Zone around 4,390 - 4,400 and then failed to reclaim the VAL Resistance Flip around 4,350 - 4,360. That means the previous support has now become short-term resistance.
This is a clear value shift.
Technical structure
On the H1 chart, gold previously moved inside a bullish recovery structure, but sellers stepped in near the upper value area and pushed price back below the main acceptance zone.
The POC Acceptance Zone around 4,390 - 4,400 is now the first major resistance above price. If gold rebounds into this zone but fails to hold above it, sellers may continue to defend the market.
The VAL Resistance Flip around 4,350 - 4,360 is the closest reaction zone. Price is currently trading below this level, which shows that buyers are losing short-term control.
Below current price, the next important support is around 4,324 - 4,330. If gold sweeps this area and reacts strongly, a short-term rebound can appear.
The deeper support remains the LVN Deep Support around 4,315 - 4,320. This is the final lower value zone where buyers may try to defend the bigger structure.
Important zones
Current price area: 4,335 - 4,340
Gold is trading below the flipped VAL zone after the breakdown.
VAL Resistance Flip: 4,350 - 4,360
Nearest resistance. Buyers must reclaim this level to reduce selling pressure.
POC Acceptance Zone: 4,390 - 4,400
Main value resistance after the breakdown.
VAH Rejection Zone: 4,445 - 4,455
Upper supply zone where sellers previously controlled the move.
Short-term support: 4,324 - 4,330
First reaction area if price sweeps lower.
LVN Deep Support: 4,315 - 4,320
Major lower support and buyer defence zone.
Trading scenario
Buy reaction from 4,315 - 4,330
Entry:
Look for buy positions only if price sweeps into 4,315 - 4,330 and shows clear bullish rejection.
Stop Loss:
Below the LVN Deep Support or below the local sweep low.
Take Profit:
TP1: 4,350 - 4,360
TP2: 4,390 - 4,400
TP3: Trail higher only if gold reclaims the POC Acceptance Zone with strength
This setup is based on a reaction from lower value after gold has already broken down. It is not a blind buy. The rejection must be clear.
Alternative scenario
If gold rebounds into 4,350 - 4,360 and fails to reclaim this flipped VAL zone, sellers can continue to pressure price back towards 4,324 and 4,315.
A bullish recovery only becomes stronger if gold reclaims 4,360 first, then accepts back above 4,390 - 4,400.
Final view
Gold is correcting after losing value.
The short-term structure is weaker because price is now below both the POC Acceptance Zone and the VAL Resistance Flip. However, gold is approaching an important lower support area where buyers may attempt a reaction.
For now, the plan is simple:
Do not chase sells late near support.
Do not buy early without confirmation.
Wait for the reaction around 4,315 - 4,330.
If buyers defend this zone, gold can rebound towards 4,350 and 4,390.
If this zone breaks, the correction can extend deeper.
This is the key question now:
Is this only a value reset before buyers return, or has gold started a deeper bearish rotation?
Long 
XAU/USD - Sellers Have Back Toward 4,320Hi traders, would you sell the breakdown now or wait for the retest?
OANDA:XAUUSD has lost the previous ascending channel and is now trading below the Ichimoku Cloud, while the 4,400–4,430 area has turned into a strong resistance zone.
Rather than chasing the move lower around current price, I’m watching for a rebound into that resistance. If buyers fail to reclaim it and rejection appears, I still favor another leg down toward:
🎯 Target: 4,320
The setup becomes much cleaner if price first retests 4,400–4,430 and gives sellers another reaction.
A sustained H1 close above 4,430 would weaken the bearish idea and suggest the market is rebuilding bullish momentum.
AURICVERSE View: the important part isn’t the first drop — it’s whether 4,400–4,430 now behaves as resistance. If it does, 4,320 remains the level I’m watching.
How are you reading this structure? Share your view below. Short