BRIAN XAUUSD – GOLD STARTS THE WEEK ABOVE VALUE, BUT 4,400 IS BRIAN XAUUSD – GOLD STARTS THE WEEK ABOVE VALUE, BUT 4,400 IS THE REAL TEST
Gold begins the new week with buyers still holding control after the strong recovery from the 4,300 area. Price has pushed back above 4,400, but the market is now trading near an important decision zone where momentum needs confirmation.
From the fundamental side, the US dollar is facing renewed pressure as expectations for another Fed rate hike continue to fade. This gives gold short-term support. At the same time, Middle East tension remains active, so traders will closely watch new updates from the region and the upcoming July FOMC meeting minutes.
The technical picture is still bullish, but gold is now testing high value. This is where buyers must prove that the breakout is not only a reaction, but real acceptance.
Technical structure
On the H1 chart, gold has recovered strongly from the Lower Value Refill Zone around 4,348 - 4,352 and is now holding near the POC Acceptance Zone around 4,392.
This POC zone is the key level for the start of the week. As long as price holds above 4,390 - 4,395, buyers still have control and gold can continue towards the HVN Resistance Zone around 4,420.
Above that, the VAH Target Zone around 4,445 - 4,450 becomes the next major upside target.
However, if gold loses the POC Acceptance Zone, price may rotate back into the Lower Value Refill Zone before the next buyer reaction appears.
Important zones
POC Acceptance Zone: 4,390 - 4,395
Current decision zone and short-term buyer control area.
Lower Value Refill Zone: 4,348 - 4,352
Main pullback support if gold needs a deeper reset.
HVN Resistance Zone: 4,415 - 4,420
First resistance where sellers may react.
VAH Target Zone: 4,445 - 4,450
Main upside target if buyers keep momentum.
Current price area: 4,390 - 4,400
Gold is holding high value, but still needs acceptance above 4,400.
Trading scenario
Buy reaction from POC Acceptance Zone 4,390 - 4,395
Entry:
Look for buy positions only if price holds around 4,390 - 4,395 and shows clear bullish rejection.
Stop Loss:
Below the POC Acceptance Zone or below the local pullback structure.
Take Profit:
TP1: 4,415 - 4,420
TP2: 4,445 - 4,450
TP3: Trail higher only if gold accepts above the VAH Target Zone
This setup follows the current bullish structure, but avoids chasing price blindly after a strong rebound.
Alternative scenario
If gold fails to hold 4,390 - 4,395, the better reaction may come lower around 4,348 - 4,352.
That would not immediately destroy the bullish trend. It would only mean gold needs to refill lower value before continuing higher.
Final view
Gold starts the week with a bullish structure. Buyers are still active, the daily setup remains positive, and price is holding above reclaimed value.
But the 4,400 area is not a simple level. It is where momentum must prove itself.
If buyers defend the POC Acceptance Zone, gold can continue towards 4,420 and 4,450.
If this zone breaks, I will wait for the deeper value reaction around 4,350.
For now, the plan is simple:
Do not chase the top.
Wait for value.
Let 4,390 decide the next move.
Will gold accept above 4,400 this week, or will buyers need one more pullback before the next push?
 Long
Long
BTCUSDT: Bulls Find Momentum For BreakoutBTCUSDT is trading around 63,680 USDT, with the 4-hour (H4) candle currently up by approximately 257 USDT (+0.40%). Bitcoin also rebounded about 0.8% during the Asian session, signaling a return of buying pressure after days of facing headwinds.
Macroeconomic factors are supporting this recovery. The market currently prices in a 69.9% probability that the Fed will hold interest rates steady in September, while the DXY has dropped to around 99.50—near its monthly low. A weak USD and expectations of a less hawkish Fed generally create a more favorable environment for crypto.
On the H4 chart, the 62,400–63,000 USDT zone continues to act as support. The price has reclaimed the EMA34 but needs to clear the EMA89 around 63,770 for the recovery to gain convincing momentum.
If the support level holds, I lean towards the scenario where BTCUSDT extends its rebound to the 64,700–65,000 USDT range.
However, oil prices remain elevated around $88 per barrel due to Middle East tensions, meaning risk sentiment has not yet fully stabilized.  Long
Long
 Long
Long
Long 
NIFTY – Intraday Trading Plan | 18th August 2026Reference Chart: 15 Min Timeframe | Previous Close: 24,287.65
This plan is prepared purely for educational purposes to help traders understand how to react to different opening scenarios using key support/resistance zones plotted from previous price action. Please read the disclaimer at the end before taking any action. 🙏
🔑 Key Levels for the Day
🔸 Major Resistance: 24,655
🔸 Immediate Resistance: 24,492
🔸 No Trading Zone (NTZ): 24,332 – 24,390
🔸 Immediate Support: 24,190 – 24,220
🔸 Major Support: 24,093
🚀 SCENARIO 1: GAP UP OPENING (100+ points, Open above 24,390)
A gap-up opening of 100+ points shows strong overnight positive sentiment. However, gap-up days often see initial profit booking, so patience in the first 15 minutes is key. ⏳
🔸 If Nifty opens above 24,492 and sustains with a 15-min candle close above it, this confirms strength — look for CE (Call) buying opportunities targeting 24,600 → 24,655.
🔸 If price opens between 24,390 – 24,492, treat this as a test zone. Wait for a clean breakout & retest above 24,492 before entering fresh longs.
🔸 If the gap-up fails and price slips back into the No Trading Zone (24,332–24,390), avoid fresh positions — this indicates gap-fill risk and choppy price action.
🔸 Suggested Stop Loss for CE buyers: Below 24,440 (15-min candle close basis).
🔸 If 24,655 is breached with strong volume, trail stop loss upward and avoid booking full profits too early.
⚖️ SCENARIO 2: FLAT OPENING (Open within ±50-70 points, i.e., near 24,287 – 24,390 zone)
A flat opening reflects market indecision. This is exactly where the No Trading Zone (24,332 – 24,390) becomes important — price often whipsaws here before choosing direction. 🎯
🔸 Avoid initiating fresh trades while price is trading inside the No Trading Zone (24,332–24,390). This is a trap zone for both CE & PE buyers.
🔸 If Nifty breaks and sustains above 24,390 with a strong candle close, initiate CE buying, targeting 24,492 and then 24,655.
🔸 If Nifty breaks and sustains below 24,332, initiate PE buying, targeting the support zone of 24,190–24,220 and further to 24,093.
🔸 Keep stop losses tight in flat sessions as false breakouts are common — use 15-min candle closing basis rather than reacting to wicks.
🔸 Patience is the key strategy today — let the market pick a direction before committing capital.
🔻 SCENARIO 3: GAP DOWN OPENING (100+ points, Open below 24,190)
A gap-down opening of 100+ points signals weak sentiment carried from global cues or negative triggers. First reaction near supports must be watched carefully. 👀
🔸 If Nifty opens below 24,190 and sustains below the support zone (24,190–24,220), consider PE (Put) buying, targeting the major support at 24,093.
🔸 If 24,093 breaks decisively with strong selling pressure, expect further downside continuation — trail your stop loss and avoid holding blindly.
🔸 If price recovers quickly back above 24,190–24,220 after the gap down, this may indicate a bear trap — avoid fresh shorts and wait for confirmation before reversing bias.
🔸 Suggested Stop Loss for PE buyers: Above 24,240 (15-min candle close basis).
🔸 A sharp V-shaped recovery from 24,093 could also open opportunities for a counter-trend CE trade — but only for experienced traders with strict risk control.
🛡️ Risk Management Tips for Options Trading
🔸 Always trade with a predefined stop loss and target — never enter an options trade without an exit plan.
🔸 Risk only 1–2% of your total capital per trade — options can move fast in both directions.
🔸 Avoid trading inside the No Trading Zone — most false signals originate here.
🔸 Be cautious of theta decay — avoid holding naked option buys too long, especially in the last hour of trading.
🔸 Reduce position size on gap-opening days since volatility (IV) is usually elevated.
🔸 Never average a losing option position — cut losses early and preserve capital for the next opportunity.
🔸 Book partial profits at the first target and trail your stop loss for the remaining quantity to protect gains.
🔸 Keep an eye on India VIX — sudden spikes can distort option premiums independent of Nifty direction.
📝 Summary & Conclusion
Today's plan revolves around three key zones: Major Resistance (24,655 / 24,492), No Trading Zone (24,332–24,390), and Support Zone (24,190–24,220 / 24,093).
🔸 In a Gap-Up, wait for sustainability above 24,492 before going long.
🔸 In a Flat opening, avoid the No Trading Zone and wait for a directional breakout/breakdown.
🔸 In a Gap-Down, watch for sustainability below 24,190 for downside continuation, or a reversal signal near 24,093.
Discipline, patience, and strict risk management are the pillars of consistent trading — especially in options where volatility can work both for and against you. Trade the plan, not your emotions. 💡
⚠️ Disclaimer
I am not a SEBI registered analyst. This post is shared purely for educational and informational purposes only and should not be construed as investment/trading advice. Please consult your financial advisor and do your own research before making any trading or investment decisions. Trading in equities, futures & options involves substantial risk of loss and is not suitable for all investors. 🙏  Long
Long
Inside the Equilibrium Game Between Supply and DemandThis post is educational and observational in nature based on historical price action. It is not a forecast or a trading recommendation.Price action used is older than 3 months
The Setup
In 2004, this stock began a strong upmove, delivering a 600% rally. That move eventually ran into a supply zone, marked in red, formed in 2006. From that point forward, the stock entered an extended sideways phase lasting roughly 7100 days, a genuinely prolonged period of consolidation that offers a rich case study in range bound behavior.
Supply Zone (Red)
The supply zone marks the area where sellers repeatedly capped price, originating from the top of the 2004 to 2006 rally and continuing to act as resistance throughout the sideways period that followed.
Demand Zone (Green)
The demand zone marks the area where buyers repeatedly stepped in, forming the lower boundary of this same sideways range.
Equilibrium Point (Red Dotted Line)
Marked with a red dotted line, the equilibrium point is the lateral midpoint between the topmost level of the supply zone and the bottommost level of the demand zone. This midpoint becomes an important reference within a sideways market, since price behavior around it can vary significantly from one visit to the next.
The Many Ways Price Behaved Around Equilibrium
Within this 7100 day range, price did not interact with the equilibrium point in just one consistent way. At times, the market pushed down to create a lower low before reversing upward through demand. At other times, it simply took resistance directly from the equilibrium point without testing the lower demand zone at all. On other occasions, it found support exactly at the equilibrium level and moved higher from there. This range of outcomes, all occurring within the same sideways structure, highlights how many permutations and combinations a single equilibrium point can produce over an extended consolidation.  Long
Long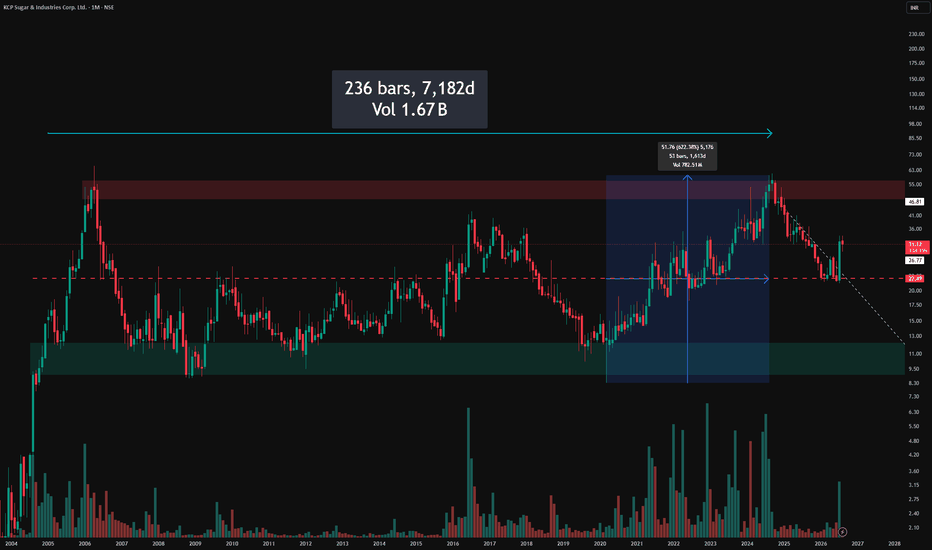
XAUUSD: Pullback Structure, 4.500 TargetXAUUSD is currently trading around $4,394. Spot Gold is up approximately 0.4% today, supported by a weakening US dollar and a decline in market-implied odds of a September Fed rate hike—now around 30%—following a series of softer US economic data releases.
On the H4 chart, the bullish structure remains intact following the trendline breakout earlier this month. The two most recent pullbacks saw renewed buying interest, with the price holding above the EMA34 and EMA89.
The $4,270–$4,330 zone remains a key support area. Should XAUUSD experience another pullback but hold this level, I favor a scenario where buyers step back in, pushing the price toward the $4,480–$4,500 range.
Macro factors currently align with the technical setup; however, as the market turns its attention to the July FOMC minutes, volatility may pick up again in the coming sessions. Long 
Long 
XAUUSD: Bullish Elliott Wave Target 4,500Gold is still holding a constructive bullish structure after reacting from the lower support area. From Kelly’s view, the chart suggests that XAUUSD may be preparing for the next bullish Elliott wave, as long as price continues to hold above the current buy zone.
The key idea is simple: gold may still move with short-term corrections, but the main scenario remains bullish while buyers defend the 4,390–4,405 area.
⟡ Market structure
The chart shows gold recovered strongly from the 4,300 area and built a new bullish sequence. After forming a higher low, price pushed back above 4,400 and is now consolidating near the Buy zone.
Current price is around 4,402. This is an important reaction area because it sits close to the short-term support zone and below the nearest breakout level around 4,416.
If gold holds above the Buy zone and breaks 4,416 with strength, the next upside target is the resistance area around 4,435–4,445. A clean breakout above that resistance may open the path towards the Elliott wave completion zone around 4,500–4,510.
➤ Key levels
◌ 4,390–4,405: Buy zone and short-term support
◌ 4,402: current price reaction area
◌ 4,416: bullish confirmation checkpoint
◌ 4,435–4,445: main resistance zone
◌ 4,500–4,510: End Elliott wave / Fibonacci 1.618 target
◌ Below 4,380: area where the bullish setup starts to weaken
⌁ Elliott Wave view
From an Elliott Wave perspective, gold may be forming a bullish 5-wave structure after the previous correction ended near 4,300.
Wave 1 created the first recovery move from the lower base.
Wave 2 corrected but held above the main low.
Wave 3 may develop if price breaks above 4,416 and pushes into 4,435–4,445.
Wave 4 may later form as a controlled pullback near resistance.
Wave 5 may then continue towards 4,500–4,510, where the chart marks the Elliott wave completion zone.
This means Kelly is still watching for bullish continuation, but confirmation is important. The stronger setup is not to chase price randomly, but to wait for the Buy zone to hold and for price to confirm above the nearest resistance.
▸ Trading scenario
Preferred scenario: wait for gold to hold the Buy zone and show bullish confirmation.
Entry zone: 4,390–4,405 if bullish confirmation appears
Stop loss: below the confirmed pullback low or below 4,380
Take profit 1: 4,416
Take profit 2: 4,435–4,445
Take profit 3: 4,500–4,510
Alternative scenario: if gold breaks below 4,380 with strong bearish pressure, the bullish Elliott setup weakens. In that case, price may need to retest the lower support area before building a new bullish structure.
⌁ Kelly’s view
For Kelly, the main structure still favours the bullish scenario. Gold is holding above the buy zone, the recovery structure is improving, and the next Elliott wave may continue if buyers protect support.
The key zone to watch is 4,390–4,405. If this area holds, gold may continue higher towards 4,435 first, then the 4,500 Elliott target.
Gold is building bullish momentum.
If the buy zone holds, wave 5 may extend higher.
Share your view below. Long 
BRIAN XAUUSD – GOLD HOLDS HIGH VALUE, NEXT TARGET IS THE SELL BRIAN XAUUSD – GOLD HOLDS HIGH VALUE, NEXT TARGET IS THE SELL POC
Gold is ending the week with a strong recovery structure after buyers defended value several times during the pullback phase.
Across the week, the main story was clear: gold reacted from the lower value zones, reclaimed the POC structure, pushed into higher value, then corrected slightly without breaking the broader bullish base. Even when profit-taking appeared near the recent high, buyers continued to defend the important Volume Profile levels.
Now the H4 chart shows gold trading around 4,376, holding above the Buy zone 4,348 and still respecting the bullish recovery from early August.
Technical structure
On the H4 chart, gold has shifted from a long consolidation base into a strong bullish expansion.
The Buy zone 4,348 is the nearest support. This is the first area where buyers may defend the market if price pulls back.
Below that, the Buy zone VAL 4,245 is the deeper value support. If gold corrects harder, this zone becomes the main buyer reload area.
Above current price, the next major upside target is the Sell zone POC 4,539. This is the higher Volume Profile resistance where sellers may start defending aggressively.
Important zones
Current price area: 4,370 - 4,380
Gold is holding high value after the weekly recovery.
Buy zone: 4,348
Nearest support and first buyer reaction area.
Buy zone VAL: 4,245
Deeper support if gold needs a larger correction.
Sell zone POC: 4,539
Main upside target and major resistance zone.
Weekly structure:
Buyers defended value, reclaimed momentum, and kept price above the key support zones.
Trading scenario
Buy reaction from Buy zone 4,348
Entry:
Look for buy positions only if price pulls back into 4,340 - 4,350 and shows clear bullish rejection.
Stop Loss:
Below the Buy zone or below the local pullback low.
Take Profit:
TP1: 4,400
TP2: 4,460
TP3: 4,539 if buyers keep strong acceptance above value
This setup follows the current bullish Volume Profile structure, but avoids chasing price after a strong weekly move.
Alternative scenario
If gold breaks below 4,348 and fails to reclaim it, the market may rotate deeper towards the Buy zone VAL around 4,245 before buyers step in again.
That would not immediately destroy the larger bullish structure, but it would show that gold needs a deeper value reset before continuing higher.
Final view
Gold is still bullish while it holds above 4,348.
The week showed that buyers are not giving up control easily. Every correction into value has attracted demand, and the structure now points towards a possible continuation into the higher POC target.
But the best trade is still not to chase the top. The cleaner plan is to wait for a pullback into value and watch whether buyers defend the zone again.
If 4,348 holds, gold can continue towards 4,539.
If 4,348 fails, watch 4,245 as the next major buyer reaction zone.
For now, gold is strong, but value still decides the next clean entry.
Would you buy the 4,348 retest, or wait for gold to reach the 4,539 Sell POC first?
Long 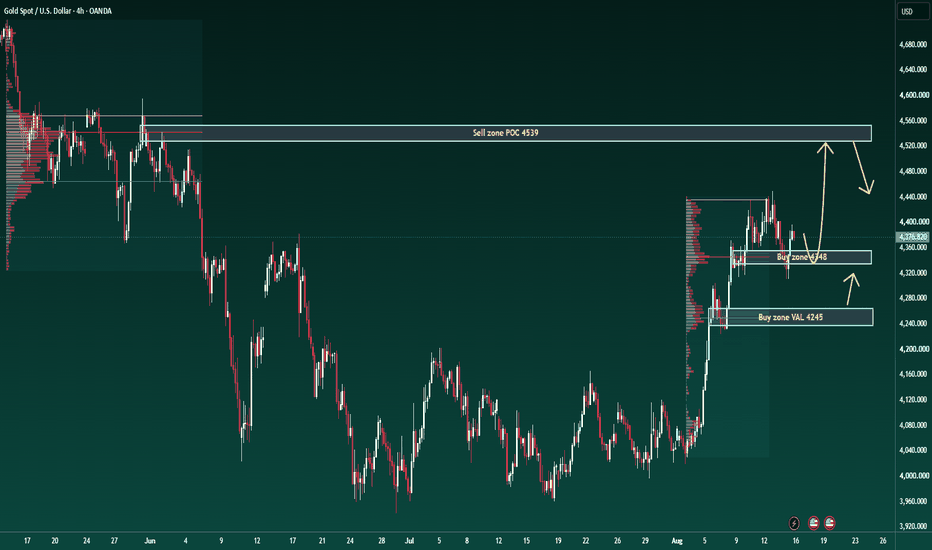
XAUUSD 4357 defense — 4450 still bait XAUUSD 4357 defense — 4450 still bait
That 4,395 push to start the week is not random.
Gold opened strong, but not clean. Price is sitting right under that small supply box around 4,388 - 4,396 after rejecting from the upper wick near 4,412. So yeah, buyers are active, but they still need to prove they can keep control.
The real zone is lower.
Buyer Control Zone around 4,357 - 4,365.
That’s where this whole setup decides itself.
Gold already had the shakeout into 4,315 last week, then CHOCH, then a fast recovery back above the old market memory zone. That was the trap. Sellers got comfortable too low, then price ripped back into the range.
Now the new week starts with gold holding near 4,395 while the macro side leans supportive. Softer US retail sales reduced Fed hike pressure. Geopolitical tension is still alive after the Iran comments. That keeps safe-haven demand in the background.
Main bias stays bullish while 4,357 holds.
But I’m not chasing the top candle.
If price sweeps back into 4,357 - 4,365 and buyers defend it, 4,412 comes first. Above that, the Premium Liquidity Magnet around 4,438 - 4,450 is still the real bait.
Trading scenario:
Buy idea only if gold holds above 4,357 - 4,365 and gives a clean reclaim above 4,396.
Entry zone: 4,357 - 4,396 after confirmation
Stop loss: below 4,315
TP1: 4,412
TP2: 4,438
TP3: 4,450
No hold in the buyer zone, no buy. Simple.
If gold closes hard below 4,315, this bullish idea gets messy. Then the whole recovery can turn into another failed squeeze.
For now, I’m reading this as Monday buyer defense, then 4,450 liquidity hunt.
You think gold sweeps 4,357 first or runs straight into 4,450?
Short 
XAUUSD — 4,373 Is the Week’s Test XAUUSD — 4,373 Is the Week’s Test
Gold is opening the new week with buyers still in the room, and the chart feels like it is trying to continue the same story from last week instead of starting from zero.
Price climbed back toward 4,395 after holding the recovery structure, and that matters because every dip so far has been defended inside the rising channel. The move from the liquidity reset base around 4,290 - 4,300 gave buyers a clean foundation, then price pushed higher again into the 4,390 area. For newer traders, this is the simple part: when price keeps forming higher lows and reacts from the same channel support, the market is not showing real bearish control yet.
My main view is bullish while gold holds above 4,373.868 and the momentum refill shelf around 4,335 - 4,345. Softer US inflation signals and weaker retail sales have reduced some Fed hike expectations, which gives gold a reason to stay supported. But I still do not want to chase the top blindly, because price is moving close to sell-zone liquidity near 4,420 - 4,440.
The cleaner idea is to let gold hunt that upper liquidity first, then watch the pullback. If price returns to 4,373.868 and holds, buyers may use that zone as a springboard for another push higher. If the pullback is deeper, 4,335 - 4,345 becomes the next area where momentum may refill.
This bullish idea becomes weak only if gold loses 4,335 and fails to recover. A stronger invalidation would be a clean close below 4,290, because that would break the base of this recovery structure.
Key price zones to watch
Current reaction area: 4,390 - 4,400
Main demand / buy scalping zone: 4,373.868
Momentum refill shelf: 4,335 - 4,345
Liquidity reset base: 4,290 - 4,300
Bullish confirmation zone: clean hold above 4,373.868
First upside liquidity target: 4,420 - 4,440
Main upside target: 4,450
Invalidation: clean close below 4,290
Do you see gold hunting the sell-zone liquidity first, or should buyers wait for a cleaner pullback into 4,373 before trusting the next push?
Short 
BTCUSDT: Bears Remain Control, Next Target PriceBitcoin is trading around 63,400 USDT, down approximately $378 (-0.59%) for the day, and continues to show a weak response below the 64K level.
The market is currently awaiting US PPI data, with forecasts of +0.2% for headline PPI and +0.3% for Core PPI; figures coming in hotter than expected could exert further downward pressure on crypto.
On the 4-hour (H4) chart, BTCUSDT is trading below the EMA34 and EMA89, while the 64,000–65,200 USDT zone has established itself as strong resistance. If the price pulls back to this area but faces rejection, I lean towards the scenario of an extended decline toward the 62,000 USDT level.
What do you think? Will BTC retest 64K before dropping further, or will it break straight down to 62K? Short 
Short 
 Long
Long
 Long
Long
APL APOLLOAPL APOLLO TUBES (NSE: APLAPOLLO) — Elliott Wave Read: Impulse (V) in Progress, But This Week's Breakdown Puts the Wave IV Count Under Stress
Larger-Degree Structure
Zooming out, the chart shows a large-degree advance where wave (III) topped around the ₹1,850–1,900 area (Sept 2023), followed by a multi-quarter wave (IV) correction that carved out a converging/triangle-like consolidation (visible in the yellow and white trendlines) bottoming near ₹1,250–1,300 (late 2024/early 2025). Since that low, price has been building what the chart's own labels identify as the impulse leg toward wave (V) — targeting the upper projection zone (~₹2,600–2,900 by the drawn yellow/cyan trendlines into 2028–29).
Internal Count of the (V) Impulse — I through V
Reading the sub-wave labels already on the chart:
Wave I: rally off the (IV) low up to ~₹1,700
Wave II: corrective pullback to ~₹1,450–1,500 — a normal, shallow retracement, no overlap issues
Wave III: extended, strongest leg of the sequence, rallying to the swing high near ~₹2,150 (consistent with Elliott's tendency for wave 3 to be the extended wave — also roughly where the 1.618 extension marker at 2,234.7 sits)
Wave IV: the labeled pivot near ~₹1,750–1,830, where the chart's Fibonacci box (0.236 / 0.786 / 1.618 retracement-extension levels at 1,752.8 / 1,831.2 / 1,949.7) was drawn as the expected support zone for this correction
Wave V: not yet underway — projected toward the ₹2,600–2,900 zone if the count completes cleanly
Where This Breaks Down — the Overlap Problem
This is the important flag for a public post: price has since fallen straight through the entire Fib support box and closed this week at ₹1,407.6 (O 1,419.3 / H 1,447.5 / L 1,398.8, -1.23%) — well below even the deepest marked level (1,752.8), and critically, below wave I's high of ~₹1,700.
In a standard Elliott impulse, wave 4 is not allowed to overlap wave 1's price territory. A wave IV low dropping to 1,407.6 — beneath wave I's ~1,700 high — breaches that rule. That leaves a few honest possibilities to present rather than one confident answer:
The impulse count is invalidated as a "clean" motive wave, and what's unfolding since wave III's top is better labeled as a deeper A-B-C correction of larger-degree wave (IV) that hasn't fully finished — i.e., the market may still be inside the bigger (IV), not yet started (V).
This is a diagonal (wedge) structure rather than a standard impulse — diagonals (leading or ending) do permit wave 4 to overlap wave 1, so the I–V labeling could still hold if reclassified as a diagonal. The converging trendlines already drawn on the chart (white channel narrowing into the (III)-(IV) zone) lend some visual support to a diagonal reading, though that structure was for the prior leg, not this one.
Simple mislabeling — the pivot marked "IV" may not be the actual wave IV low; the real wave IV low may still be forming lower than 1,407.6, which would need the whole sub-count re-anchored once a clear reversal candle appears.
RRG Cross-Check
The RRG panel shows the RS/Momentum line curling up and crossing into the green zone, tagged "LEADING" (~100.51 vs ~98.48). But as with Jubilant Foodworks earlier in this series, that tag is lagging this week's sharp breakdown in price — a "Leading" relative-strength reading printed the same week as a rule-breaking wave count and a weak close (open = near the high, close near the low) is a mismatch worth noting rather than glossing over.
Takeaway
The bullish long-term structure (heading toward wave (V) and the ₹2,600–2,900 zone) is still the chart's own working thesis, but this week's decline has technically broken the wave count's internal rules. The honest way to publish this: present the I–V labeling as the primary scenario while flagging that the wave-1/wave-4 overlap needs resolving — either via a diagonal reinterpretation or by acknowledging price may still be completing the larger wave (IV) rather than having started (V) at all.
Levels that would resolve the ambiguity: A reclaim and weekly close back above ~₹1,700 (wave I's high) would repair the standard impulse count and support the "wave IV bottoming, V still ahead" thesis. A further breakdown below this week's low (₹1,398.8) without reclaiming that level would favor the deeper-correction / count-invalidation scenario.
This is a technical/structural read for educational purposes, not investment advice — do your own due diligence before acting.
 Long
Long
NIFTY — Intraday Trading Plan (Educational) | 17-Aug-2026
Timeframe: 15m | Reference area: ~24,366
Use acceptance/rejection on 15-25m candles for confirmation.
— — —
🔑 Key Levels (from chart)
24,588 — Upper Resistance (UR): supply shelf / extension target.
24,479 — Last Intraday Resistance (LIR): prior reaction high; sellers defended.
24,406 — Opening Resistance / Pivot (OR/P): control line for early bias.
24,292 — Opening Support (OS): prior base; first demand line.
24,218–24,189 — Last Intraday Support Zone (LIS): demand shelf/liquidity pocket.
24,092 — Major Support (MS): breakdown target if LIS fails.
Bias Map
Above 24,479 → buyers in control; room to 24,588.
24,292–24,406 → rotation range; ORB + retests work best.
Below 24,218 → sellers in control; 24,092 becomes magnet.
— — —
🧭 Scenario A: Gap Up ~+100 pts (open ≈ 24,460)
Open between 24,406 and 24,479
Long continuation (preferred):
Trigger: 5–15m close and hold above 24,406, then buy retest/HL at 24,406–24,420.
Targets: 24,479 → 24,588
SL: below 24,390 (structure + buffer)
Logic: Gap holds above pivot → initiative buying continuation.
Failed gap short:
Trigger: Loss of 24,406 after early test; repeated rejection from below.
Targets: 24,292 → 24,218/24,189
SL: above 24,430
Logic: Failure to hold pivot invites gap-fill rotation.
Open above 24,479
Breakout buy:
Trigger: Accept >24,479, then buy pullback to 24,479–24,490.
Targets: 24,588, then trail
SL: below 24,445
Rejection fade short:
Trigger: Spike above 24,479 and swift close back below.
Targets: 24,406 → 24,292
SL: above 24,505
— — —
🧭 Scenario B: Gap Down ~−100 pts (open ≈ 24,266)
Open between 24,292 and 24,218
Reclaim long (gap-fill idea):
Trigger: Sweep of 24,218–24,189 and quick reclaim/close back above 24,292.
Targets: 24,406 → 24,479
SL: below 24,180
Logic: Responsive buyers defend LIS; move back to pivot and LIR.
Continuation short:
Trigger: 24,292 acts as resistance from below (multiple rejections).
Targets: 24,218 → 24,189
SL: above 24,305
Open below LIS (sustained <24,189)
Trend-down short (preferred):
Trigger: Retest of 24,189–24,218 fails; lower high forms on 5–15m.
Targets: 24,092
SL: above 24,230
Logic: Acceptance below LIS shifts control to sellers; MS becomes target.
Invalidation:
Swift reclaim >24,218 → exit shorts; bias shifts to range back to 24,292.
— — —
🧭 Scenario C: Flat Open (±25 pts of 24,366)
Range/ORB plan inside 24,292–24,406.
Bullish plan:
Trigger: 15m close >24,406, buy retest.
Targets: 24,479 → 24,588
SL: below 24,380
Bearish plan:
Trigger: 15m close <24,292, sell retest.
Targets: 24,218/24,189 → 24,092
SL: above 24,310–24,320
Fade extremes if clear rejection:
Longs near 24,218–24,189 with tight SL <24,180.
Shorts near 24,479/24,588 on rejection back inside.
— — —
📚 Why these setups?
Levels = prior battle zones. Acceptance beyond a level = initiative control and continuation.
Rejection wicks/fast returns inside range = responsive control and mean reversion.
Gaps that hold beyond pivot often trend; gaps that fail often fill.
— — —
⚙️ Execution & Risk
Confirmation: 1 strong 5–15m close beyond level + retest.
Position sizing: Risk 0.5–1% of equity per trade.
Position = (Risk per trade) / (Entry − SL).
Management:
Take partials at T1; move SL to BE after +1R.
Trail under/over last 15m swing or use VWAP band.
Max trades: 2–3. Two red trades → stop for the day.
— — —
🧠 Mindset: Beat Greed & Fear
Predefine your invalidation; never widen SL.
Greed: scale out methodically; let runner trail.
Fear: size small enough that SL is acceptable.
Process > P&L. Screenshot and journal each setup.
— — —
✅ Pre‑Open Checklist
News/data check around open and mid‑day
Mark 24,588 / 24,479 / 24,406 / 24,292 / 24,218–24,189 / 24,092
Plan scenario, triggers, SL, targets; size calculated
First 15–30 min: observe who’s in control before committing
— — —
📝 Disclaimer
This post is for educational purposes only. I am not a SEBI‑registered analyst or investment advisor. Markets involve risk. Do your own research and take trades at your own responsibility. Long 
 Long
Long
 Long
Long
The Chart That Broke Every Rule: A Warning About ChasingAll price action, candlesticks and levels shown in this chart are historical and older than three months. This post is purely educational and observational in nature and does not name or promote any specific stock. It is not a forecast or a trading recommendation.
🟢 Seven Years of Consolidation, Then a Breakout Nobody Should Have Trusted
The chart in front of us shows a stock that spent seven years in consolidation before finally producing a breakout candle above that entire zone. On paper, this looked like a textbook horizontal breakout. In practice, this is exactly the type of setup that should be approached with caution.
🟢Horizontal breakouts and all time high breakouts carry poor probability in the majority of cases. Most of the time, they convert into fakeouts.
This chart is one of those rare exceptions. Not only did the breakout hold, the stock delivered a 644% return from that zone.
🟢 Why This Chart Is Dangerous to Learn From ❌
This is precisely where many traders go wrong. They take a single exceptional outcome like this and turn it into their mental template for every future horizontal breakout they see. The brutal truth of trading is that one stock's history does not repeat itself on another stock. Every stock builds its own structure, its own levels, and its own behaviour.
🟢 What Happened Next ✅
After that extended rally, the stock corrected sharply, falling around 60% and forming a sequence of lower highs and lower lows before eventually finding a base and breaking out again. This is where a technically sound entry point could be identified, a higher low forming inside a two to three year retracement zone. Even here, valuation was already stretched, but at least price itself was lower and the technical structure was more defined.
From that base, the stock rallied again, first tapping into a nearby supply zone, then extending well beyond it. Using Fibonacci extensions in hindsight, the stock breached both the 127% and 161.8% extension levels, levels that in most cases mark an extreme, unsustainable stretch of a move, typically followed by a much deeper consolidation. That is how the majority of stocks behave once they reach this kind of extension.
This one did not follow that script. It kept climbing, higher high after higher high, in what became close to a straight line move, all while its price to earnings ratio expanded to levels many multiples above its industry average.
🔴 The Real Lesson
This entire move, from the seven year breakout to the extension driven rally, represents behavior far outside the normal range of outcomes. It is not something to anchor future decisions on. A chart like this cannot be used as a reference point for how other setups are expected to play out. The only responsible takeaway is this: study price action deeply, on its own terms, for each individual chart, rather than chasing the memory of one extraordinary move and expecting the next green candle to repeat it. FOMO built on someone else's outlier is one of the most common and costly mistakes a trader can make.
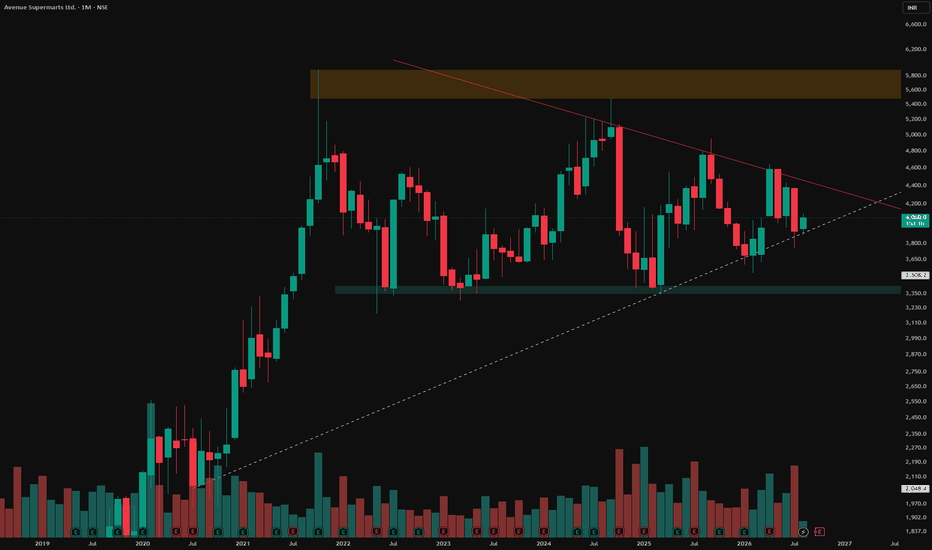
A Pure Price Action Masterclass : Respecting everythingThis post is educational and observational in nature based on historical price action. It is not a forecast or a trading recommendation
Trendline Turned Triangle Support (White Dotted Line)
This line began as a simple trendline, but over time it evolved into the bottom support boundary of a symmetrical triangle pattern, showing how a single line can serve more than one structural role as the chart develops.
Counter Trendline Turned Triangle Resistance (Red Line)
This line originated as a counter trendline, tracking a corrective phase against the prevailing trend, but it later became the upper resistance boundary of the same symmetrical triangle, once again shifting roles as price structure matured.
Supply Zone at the All Time High (Orange Zone)
Marked in orange, this is a supply zone formed at the stock's all time high, an area where sellers have historically capped price with no prior resistance above it to reference.
Consistent Support Zone (Green Zone)
Marked in green, this zone represents an area the market has repeatedly respected as support, holding price up on multiple occasions over time.
The Bigger Picture
What makes this chart worth studying isn't any single line or zone in isolation, it's how consistently every one of them has been respected. A trendline that became triangle support, a counter trendline that became triangle resistance, a supply zone at the all time high, and a support zone that has held repeatedly. Nothing here was missed by the market. This is what a pure price action read looks like when every structural element lines up and holds its role over time.  Long
Long