XAUUSD – Gold Pulls Back, But The Bullish Structure Still Looks XAUUSD – Gold Pulls Back, But The Bullish Structure Still Looks Alive
Gold is taking a short-term pause after a strong bullish run.
Price is currently trading around 4,367 after rejecting from the recent upper area near 4,420. The pullback is visible, but the bigger short-term structure has not broken yet. Buyers are still holding above the key support zones, and the market is now testing whether this decline is only a healthy correction before another push higher.
For me, the most important area on this chart is the buy zone around 4,317.
FUNDAMENTAL ANALYSIS
Gold continues to receive support from strong central bank demand and positive speculative positioning.
Recent data showed that the PBOC continued increasing gold reserves, reinforcing the longer-term demand story. At the same time, speculative long positions in gold remain strong, showing that market sentiment is still positive toward precious metals.
However, after a fast rally, short-term profit-taking is normal. If the U.S. dollar strengthens or yields recover, gold may correct deeper before buyers return.
For now, the fundamental background still supports gold, but the chart needs confirmation around support.
TECHNICAL ANALYSIS – SMC + FIBONACCI
From an SMC perspective, gold has created a strong bullish displacement from the lower accumulation area and continued forming higher highs and higher lows.
The recent push above 4,300 confirmed buyer strength. Price then moved toward the upper extension area and started to pull back after leaving a small FVG near the top.
This pullback is not automatically bearish. It may simply be a liquidity retest after a strong expansion move.
The first key support is the buy zone around 4,317. If price sweeps into this area and reacts strongly, buyers may attempt another continuation move toward 4,400 and 4,420.
Below that, the larger FVG support around 4,270 – 4,285 is the deeper area to watch. If gold loses 4,317, this zone may become the next demand area where buyers try to step in again.
The main bullish idea remains valid while gold holds above the higher-low structure. But if price breaks below 4,270 with strength, the bullish momentum becomes weaker.
KEY PRICE ZONES
Current price: 4,367
Near FVG reaction: 4,385 – 4,400
Main buy zone: 4,317
Deeper FVG support: 4,270 – 4,285
Major liquidity support: 4,060 – 4,080
Upside resistance: 4,400 – 4,420
Next bullish target: 4,450 – 4,475
Bullish structure valid: Above 4,317
Short-term weakness below: 4,317
Invalidation for bullish continuation: Below 4,270
TRADING SCENARIOS
Buy Scenario – Priority View
Buy Zone: 4,317
Entry: Bullish rejection, liquidity sweep, lower-timeframe CHoCH, or strong reaction from the buy zone
SL: Below the nearest swing low
TP1: 4,385 – 4,400
TP2: 4,420
TP3: 4,450 – 4,475 if momentum continues
Deeper Buy Scenario
Buy Zone: 4,270 – 4,285
Entry: Wait for clear bullish confirmation from the FVG support
SL: Below 4,270
TP1: 4,317
TP2: 4,400
TP3: 4,420
Sell Scenario – Only If Support Fails
Sell is not the priority while gold holds above 4,317.
Sell Condition: Clean break below 4,317, followed by a weak retest
Target: 4,270 – 4,285
Invalidation: If price quickly reclaims 4,317, the sell idea becomes weaker.
MY VIEW
Gold is pulling back, but buyers have not lost control yet.
The rally was strong, and the current correction looks more like a support retest than a full reversal. The most important level is 4,317. If buyers defend this zone, gold may continue toward 4,400 – 4,420 again.
If 4,317 fails, I will watch the deeper FVG around 4,270 – 4,285 before judging the next move.
For now, gold is still bullish, but I prefer waiting for a clean reaction from support instead of chasing price in the middle.
Do you think gold will defend 4,317 and continue toward 4,420, or will the market retest the deeper FVG first?
 Short
Short
Why Liquidity Is the Fuel Behind Every BreakoutBreakouts are some of the most exciting moments on a chart.
Price has been stuck below resistance for days or weeks. Then suddenly, buyers push through the level and the market starts moving quickly.
Many traders see the breakout and immediately think:
“The resistance is broken. Price is going higher.”
Sometimes they're right.
But there is another question worth asking:
Where did all that buying and selling come from?
The answer often involves liquidity.
Liquidity is one of the reasons markets can move quickly once an important level is broken. It helps explain why some breakouts continue strongly while others turn into frustrating traps.
What Is Liquidity?
In simple terms, liquidity refers to the availability of orders that allow buyers and sellers to transact.
Imagine a stock trading around ₹500.
There may be:
Buy orders below ₹500
Sell orders above ₹500
Stop-loss orders around important levels
Breakout orders waiting above resistance
Short sellers protecting their positions
All of these orders can contribute to activity around the price.
The more orders available, the easier it is for large participants to enter or exit positions without dramatically moving the market.
This is why certain areas on a chart become important.
Why Breakouts Need Liquidity
A breakout doesn't happen simply because a line is drawn on a chart.
Something has to change in the balance between buyers and sellers.
Suppose a stock has been trading between ₹480 and ₹500.
₹500 becomes obvious resistance.
Traders start watching it closely.
Some place buy-stop orders above ₹500, expecting a breakout.
Short sellers who entered near resistance may place stop losses above ₹500.
Now imagine price finally moves above ₹500.
Those orders can begin triggering.
Breakout buyers enter.
Short sellers are forced to close positions.
The additional buying can push price even higher.
This can create the strong acceleration we often see during genuine breakouts.
Equal Highs Can Become Liquidity Zones
Equal highs are a good example.
Suppose price reaches ₹500 three times but fails each time.
You now have a clear resistance area.
Traders see it.
Short sellers may enter around ₹500.
Breakout traders may wait above it.
Short sellers may place stops above the same level.
A large collection of orders can develop around the highs.
This makes the area interesting from a liquidity perspective.
When price finally moves above those highs, the market can become very active.
But there is an important catch.
Not every move above equal highs is a real breakout.
The Breakout Trap
This is where many traders get caught.
Price breaks above resistance.
A large bullish candle appears.
Traders rush in because they don't want to miss the move.
Then price suddenly reverses.
The stock falls back below the resistance.
What happened?
The breakout may have triggered a large amount of buying and stop-loss activity, but there wasn't enough sustained demand to keep price above the level.
The market rejected the higher prices.
This is commonly called a false breakout or liquidity trap.
The lesson isn't to avoid breakouts.
It's to avoid assuming that the first move is automatically the real move.
What Happens After the Breakout Matters
Instead of focusing only on the breakout candle, watch what happens afterward.
A stronger breakout often shows some form of acceptance above the previous resistance.
For example:
Price breaks ₹500.
It moves toward ₹510.
Then it pulls back toward ₹500.
If buyers defend that area and price starts moving higher again, the old resistance may have become new support.
That retest can provide much more information than the initial breakout.
It tells you that buyers are willing to continue accepting prices above the old range.
Liquidity Is Not a Magical Target
You'll often hear traders say:
“Price is going to take the liquidity.”
It's useful language, but it shouldn't be taken too literally.
Markets don't have intentions.
Price responds to orders, liquidity, positioning, information, and the decisions of participants.
A large institution isn't necessarily sitting there thinking, “I want to hunt retail stop losses.”
Instead, large orders require counterparties.
Areas containing many orders can therefore become important simply because they provide the liquidity needed for transactions.
Understanding this distinction helps keep liquidity analysis grounded in actual market behavior.
Stop Losses Can Add Fuel
Stop losses are an important part of the story.
Imagine many traders are short near ₹500.
They don't want to risk unlimited losses, so they place stops above the level.
If price rises through ₹500, those stops can become market-buy orders.
At the same time, breakout traders may also be buying.
Now two groups are adding buying pressure at roughly the same time.
This can accelerate the move.
The same principle works in reverse.
If many traders are long and their stops sit below support, a sharp decline can trigger additional selling.
This is one reason markets can move very quickly once an important level breaks.
Why Some Breakouts Move Further Than Others
Not all breakouts have the same strength.
A breakout from a small, quiet range may produce only a modest move.
A breakout from a major multi-week consolidation can attract much more attention.
The difference can come from the amount of positioning and liquidity surrounding the level.
The more traders watching a level, the more significant the reaction can become when that level finally breaks.
But again, volume, market structure, broader trend, and overall conditions matter.
Liquidity is one piece of the puzzle—not a standalone trading signal.
Liquidity and Market Structure
Liquidity becomes even more useful when combined with market structure.
Suppose an uptrend has been creating higher highs and higher lows.
Price consolidates beneath a previous high.
Then it breaks above that high and holds.
The breakout is occurring in the direction of the existing structure.
That can make the move more convincing.
Now imagine the opposite situation.
Price is in a weak uptrend, reaches a major resistance level, briefly breaks the high, and immediately collapses.
The same liquidity concept is present, but the context is very different.
Context determines how you interpret the move.
Don't Chase Every Breakout
One of the biggest mistakes traders make is buying simply because price has crossed a line.
The excitement of a breakout can create FOMO.
Traders fear missing the next big move.
They enter late.
Then the market pulls back.
Sometimes the better opportunity comes from waiting for confirmation or a retest.
You don't need to catch the first few points of a move.
You need a setup where the potential reward justifies the risk.
A Simple Way to Read Breakouts
When price approaches an important level, ask yourself:
1. Where is the liquidity?
Look around previous highs, lows, equal highs, equal lows, and obvious support or resistance.
2. What happens when price reaches it?
Does price break and hold, or break and immediately reject?
3. Is there strong participation?
Volume and the size of the move can provide useful context.
4. Does market structure support the breakout?
A breakout aligned with the broader trend may behave differently from one fighting it.
5. Can the level be successfully retested?
A retest can show whether the market has accepted the new price area.
These questions can help you move from simply seeing a breakout to understanding the behavior behind it.
Final Thoughts
Liquidity is one of the hidden forces behind many powerful market moves.
It helps explain why price often reacts around obvious highs and lows.
It helps explain why stop losses can accelerate a move.
And it helps explain why some breakouts become strong trends while others quickly turn into traps.
But liquidity isn't a crystal ball.
It doesn't tell you exactly where price will go next.
Instead, it gives you another way to understand why certain areas matter.
The next time you see price approaching a major resistance level, don't just ask:
“Will it break?”
Ask:
“Who is positioned here?”
“Where are the orders?”
“What happens if this level breaks?”
And most importantly:
“Does the market accept the breakout or reject it?”
Because a breakout is not simply price crossing a line.
It's a shift in the balance between buyers, sellers, and liquidity. Education 
XAUUSD: Gold Eyes 4,500 as Buyers Face the Biggest Test of the XAUUSD: Gold Eyes 4,500 as Buyers Face the Biggest Test of the Rally
Market Context
Gold is trading around 4,413 after a strong push to a fresh multi-week high. Buyers are still in control, but the pace of momentum is starting to slow as price approaches a major decision zone.
The US Dollar recovery is losing strength, while expectations for aggressive Fed tightening continue to fade. This is still supportive for gold in the bigger picture.
At the same time, US CPI is the key catalyst ahead. A softer inflation print would likely fuel another leg higher. But geopolitical tension, especially the US–Iran situation, keeps risk sentiment unstable and can trigger sharp reactions near resistance.
Bottom line: trend is bullish, but price is now entering a premium zone where execution matters more than bias.
Technical Structure
Gold has completed a strong bullish expansion from the lower demand base and is now pressing directly into the main supply area.
The market structure remains bullish with clear CHOCH and BOS confirmations. Price is holding above the previous breakout region, showing that buyers are still defending control.
However, momentum is no longer impulsive — it is transitioning into a distribution phase near resistance.
The key support to watch is the First Pullback Zone at 4,320 - 4,340. As long as this area holds, the bullish structure remains intact and buyers can still aim for continuation.
Above price, the Main Supply / Premium Zone at 4,460 - 4,520 is the real battlefield. This is where profit-taking, rejection, or breakout expansion will be decided.
If buyers manage to break and hold above 4,520, the next liquidity objective sits at 4,592.
Key Levels
Current Price: 4,413
First Pullback Support: 4,320 - 4,340
Secondary Demand: 4,230 - 4,270
Main Demand: 4,040 - 4,070
Deep Demand / Last Line: 3,960 - 4,000
Main Supply / Premium Zone: 4,460 - 4,520
Major Liquidity Target: 4,592
Bullish Continuation Trigger: Above 4,520
Bearish Shift Trigger: Below 4,320
Trading Plan
Buy Pullback
Entry: 4,320 - 4,340
SL: Below 4,270
TP: 4,413 / 4,460 / 4,500
Condition: Wait for price to return into support and show clear rejection. This is the “defend the trend” setup — buyers must step in here to keep momentum alive.
Buy Continuation
Entry: Above 4,520 (after breakout + retest)
SL: Below 4,460
TP: 4,560 / 4,592 / 4,620
Condition: Only take this if price breaks cleanly, retests the zone, and holds. No chasing breakout candles — confirmation is mandatory.
Sell Reaction
Entry: 4,460 - 4,520
SL: Above 4,540
TP: 4,413 / 4,340 / 4,320
Condition: If price taps into supply and shows rejection, a short-term pullback is expected. This is counter-trend and purely reactive unless structure breaks.
Deep Pullback Buy
Entry: 4,230 - 4,270
SL: Below 4,200
TP: 4,320 / 4,413 / 4,460
Condition: If the market corrects deeper, this becomes the cleaner re-entry zone. Look for strong bullish reaction before engaging.
Breakdown Sell
Entry: Below 4,320 (break + retest)
SL: Above 4,360
TP: 4,270 / 4,230 / 4,200
Condition: Only valid if support fails and retest confirms rejection. This would signal a shift from bullish continuation to deeper correction.
Overall Bias
Gold remains bullish as long as price holds above 4,320. The structure is still healthy, but the market is now approaching a critical supply zone where reactions are expected.
If 4,320 - 4,340 holds, continuation toward 4,460 - 4,520 remains the base case. A clean breakout above 4,520 opens the path toward 4,592.
If supply holds, a pullback toward 4,340 or even 4,270 is likely before the next expansion.
The key now is patience — not prediction. Let price show its hand at the premium zone.
Final question:
Will buyers have enough strength to break 4,520 and unlock 4,592, or is this where the market finally pauses and resets? Long 
The Hidden Logic of Market Trends: Understanding Why Price KeepsLook at any strong trend on a chart and it can seem obvious in hindsight.
The stock keeps making higher highs. Pullbacks are shallow. Buyers step in again and again.
Then, somewhere along the way, the trend slows down.
The question is:
Why?
Markets don't move in trends simply because a chart pattern says they should. Trends develop because buyers or sellers repeatedly gain enough control to push price toward new levels.
Behind every trend is a continuous battle between demand and supply, confidence and fear, participation and hesitation.
Once you understand that, market trends become much easier to read.
A Trend Starts With Imbalance
Markets are usually moving between periods of balance and imbalance.
When buyers and sellers are relatively evenly matched, price tends to move sideways.
But when one side becomes more aggressive, the balance changes.
If buyers are willing to keep accepting higher prices, price begins moving upward.
If sellers become increasingly aggressive, price starts moving lower.
This imbalance is where a trend begins.
The interesting part is that trends don't need everyone to agree.
They only need one side to be consistently stronger.
Why Uptrends Create Higher Highs
An uptrend is more than a series of green candles.
It represents a repeated willingness from buyers to accept higher prices.
Imagine a stock moves from ₹100 to ₹110.
It then pulls back to ₹105.
Instead of collapsing, buyers return.
Price moves to ₹115.
It pulls back again, but buyers defend the previous area.
Price moves toward ₹120.
The pattern is telling us something:
Demand continues to appear at increasingly higher prices.
That's the hidden logic behind higher highs and higher lows.
Downtrends Work the Same Way
A downtrend is simply the opposite battle.
Sellers repeatedly become active at lower prices.
Price falls from ₹200 to ₹185.
A temporary recovery takes it to ₹192.
Sellers return.
Price falls toward ₹175.
Another bounce occurs, but buyers cannot regain the previous high.
Eventually, lower highs and lower lows begin forming.
The market is showing that supply is consistently stronger than demand.
Pullbacks Are Part of the Trend
Many new traders see a pullback and immediately assume the trend is over.
But healthy trends rarely move in a straight line.
Some traders take profits.
Others enter in the opposite direction.
New participants wait for better prices.
This creates temporary counter-moves.
In an uptrend, a pullback can simply be the market taking a pause before buyers regain control.
The important question isn't:
"Did price pull back?"
It's:
"How did price behave during the pullback?"
A shallow pullback followed by strong buying tells a very different story from a deep decline that breaks important market structure.
Momentum Doesn't Stay Constant
Trends have different phases.
Early in a move, very few traders may believe it.
As price continues moving in the same direction, more participants notice.
Momentum increases.
Eventually, the trend becomes obvious to almost everyone.
This is where emotions can become extreme.
FOMO attracts late buyers during strong rallies.
Fear can bring aggressive selling during sharp declines.
Ironically, the strongest emotional participation can sometimes appear close to major turning points.
That's why experienced traders pay attention not only to direction, but also to how the market is behaving.
Trends Need Participation
A trend cannot continue indefinitely without enough participation.
Think about a market moving higher.
Early buyers are profitable.
More traders notice the move.
New buyers enter.
But eventually, some early participants start taking profits.
If new demand continues to absorb that selling, the trend can continue.
If new demand begins disappearing, momentum may slow.
This is why volume can be useful when studying trends.
It doesn't tell you exactly what will happen next, but it can provide clues about the level of participation behind a move.
Support and Resistance Tell Part of the Story
Previous highs and lows often become important because traders remember them.
A previous high may attract sellers who are looking to exit.
It may also attract breakout traders waiting for price to move above it.
A previous low can attract buyers and stop-loss orders from traders holding long positions.
As price approaches these areas, the battle between buyers and sellers becomes more intense.
A trend becomes especially interesting when it breaks through an important level and then holds above or below it.
That can show that the market has accepted a new price range.
The Role of Liquidity
Liquidity is another important part of market trends.
Orders often accumulate around obvious highs, lows, support, resistance, and psychological price levels.
When price approaches these areas, activity can increase.
Sometimes price briefly moves beyond an obvious level before reversing.
Other times, the move continues because enough buying or selling pressure exists to push the market into a new range.
This is why a breakout should not be judged by the first candle alone.
The reaction afterward often tells you much more.
When a Trend Starts Losing Its Logic
Trends don't usually reverse because of one random candle.
Often, the behavior starts changing first.
An uptrend may begin showing:
Smaller bullish moves
Deeper pullbacks
More upper wicks
Failed breakouts
Lower highs
A break of important support
Individually, these signs don't guarantee a reversal.
But together, they can suggest that buyers are losing control.
The same logic applies to downtrends.
The key is to notice when the market stops behaving the way it did earlier.
Consolidation Is Not a Waste of Time
Some of the most important periods on a chart look boring.
Price moves sideways.
Volatility contracts.
Candles overlap.
Nothing seems to happen.
But consolidation is often the market searching for balance.
Buyers aren't strong enough to push significantly higher.
Sellers aren't strong enough to push significantly lower.
Eventually, something changes.
A new wave of buying or selling enters the market.
The balance breaks.
A new trend may begin.
The quiet period was simply preparation for the next decision.
Don't Confuse Direction With Strength
A market can still be moving higher while becoming weaker.
This is an important distinction.
Price direction tells you where the market is moving.
Price behavior can tell you how strongly it is moving.
For example, a stock may continue making new highs while each rally becomes smaller and pullbacks become deeper.
The trend is technically still bullish.
But its character is changing.
That's the kind of detail that can be missed when traders focus only on whether price is above or below a moving average.
The Market Is Constantly Repricing
At its core, every trend is a process of repricing.
Buyers and sellers constantly reassess what an asset is worth.
New information appears.
Expectations change.
Positions are opened and closed.
Risk appetite changes.
As these decisions change, the price changes with them.
That's why a market that was considered attractive at ₹100 may suddenly look expensive at ₹150.
And a stock that nobody wanted at ₹80 may become attractive at ₹60.
Price is constantly searching for a new level where enough participants are willing to trade.
Final Thoughts
Market trends may look simple on a chart, but the psychology behind them is anything but simple.
An uptrend reflects repeated demand.
A downtrend reflects persistent supply.
Pullbacks show temporary disagreement.
Breakouts show a shift in balance.
Consolidations show uncertainty.
And reversals begin when the old trend can no longer maintain control.
Instead of asking only:
"Is the market bullish or bearish?"
Try asking better questions:
Who is in control?
Are buyers becoming more aggressive or less aggressive?
Are pullbacks being absorbed?
Is price accepting a new level or rejecting it?
Is the trend getting stronger—or quietly losing momentum?
These questions help you move beyond simply identifying trends.
They help you understand why the trend exists in the first place.
Because a market trend is not just a line moving from left to right.
It is the visible result of millions of decisions being made by buyers and sellers. Education 
GOLD JUST BROKE $4400 — NOW THE REAL TRAP BEGINS!So guys, at this point, there is no doubt that the sellers in Gold have been trapped badly. Yesterday was basically the last hope for the sellers because, as I mentioned in yesterday’s analysis, the $4380 level was extremely important. As long as Gold remained below $4380, many traders were expecting selling pressure from this area because previously, we had seen a strong one-sided fall from around this level.
Because of that previous reaction, a lot of retail traders were considering $4380 a major resistance and were expecting Gold to get rejected from here once again. But as I clearly mentioned in yesterday’s analysis, we should not ignore the buying pressure that came into the market last week. The bulls were strong.
And whenever buyers become this strong, the market doesn't necessarily respect resistance — instead, it starts respecting support. And that's exactly what we saw yesterday.
The upside momentum we were expecting finally arrived, and Gold delivered a strong breakout above the $4380 resistance. At the same time, the market also broke above the major psychological level of $4400.
Now, this is where things become extremely interesting. Once Gold broke above $4380, many traders who were previously selling had to change their bias and started buying instead. Then, when Gold pushed above $4400, another wave of breakout buyers entered the market.
So now we potentially have a large number of buyers positioned around the $4380–$4400 area, with many of them likely keeping their stop losses below $4380 or below today's low. And this is exactly why I am becoming cautious at the current price.
Currently, Gold has taken resistance around $4430, and in my view, this is an important area to watch. If Gold continues consolidating below $4430, I would not be surprised if the market first moves toward the downside and potentially breaks today's low.
The objective behind this move could be to trap the buyers who entered around $4380–$4400.
Think about the psychology. Someone buys the $4380 breakout, then Gold moves above $4400, and they become confident that the previous resistance has now turned into support.
But suddenly, Gold drops back below $4400 and eventually breaks $4380. Their stop losses start getting triggered, and retail traders begin thinking that the breakout was fake and sellers are back in control.
But what if that downside move is actually the liquidity hunt?
What if Gold simply sweeps those early buyers, collects liquidity around $4387–$4380, and then starts buying aggressively again from that area?
That's where I believe the real opportunity could potentially appear.
So, for today, my plan is relatively simple. I am not interested in chasing Gold at the current levels. As long as Gold remains below the $4430 resistance area, I am watching for downside momentum.
I expect the market could potentially move back below $4400 and eventually test the $4387–$4380 zone. However, I don't want to blindly buy from that area.
I will wait for confirmation after the downside liquidity sweep. If Gold breaks the Tuesday low, sweeps the liquidity around $4387–$4380, and then gives me the confirmation I'm looking for, that's where I would prefer to look for a fresh long position.
From there, my initial upside target would be around $4450.
And remember one very important thing: CPI is tomorrow. So tomorrow could become a completely different game, and we could potentially see a major liquidity hunt before the actual directional move begins.
That's another reason why I don't want to chase Gold after such a strong upside move. The market has already seen huge buying pressure, and price action is looking quite stretched.
Sometimes, when everyone suddenly becomes bullish after a breakout, that's exactly when you need to become more patient. The goal isn't to predict every single move in the market. The goal is to understand where liquidity is sitting, wait for the market to reveal its intention, and then react accordingly.
So guys, please don't randomly start buying Gold just because it has broken $4380 and $4400. The move has already been quite aggressive, so let the market come to you.
If the buyers get trapped first and Gold gives us the confirmation around $4387–$4380, then I'll be much more interested in looking for the next upside move.
Until then, patience is more important than FOMO. Trade with proper money management and risk management, and don't let a strong bullish move force you into a late entry.
Good luck, everyone. I hope you enjoyed today's short and psychological Gold analysis.
And now I'm curious — what is your view on Gold today? Are we going to see a buyer trap first, or will Gold continue directly toward the upside?
Let me know in the comments. 👇
XAUUSD — 4,317 Is the Reload Zone XAUUSD — 4,317 Is the Reload Zone
Gold finally did what buyers had been waiting for all week — it stopped hesitating around the old resistance and pushed hard above 4,400.
Compared with yesterday, this was a very different candle story. Price did not just bounce quietly; it expanded with strength, broke above the previous structure, and moved into the highest area in almost two months. That tells me buyers are no longer only defending pullbacks. They are now actively pushing the market into new liquidity.
For newer traders, this is the important part: after a strong breakout, the best read is not always to chase the top. The market often breathes back into the zone it broke from, checks whether buyers are still waiting there, and then decides if the next leg can continue. On this chart, that “reload” area is around 4,280 - 4,317.985.
My main view is bullish while gold holds above this zone. The reclaim above 4,160 was already a big clue, and now the push beyond 4,400 adds more weight to the bullish structure. With the USD softer, Fed hike expectations cooling, and daily RSI still not looking exhausted, gold may still have room to hunt higher liquidity toward 4,500.
The move becomes weaker only if gold loses 4,317.985 and fails to recover. A deeper break below 4,280 would tell me the breakout is cooling too much, and price may need to revisit 4,233.820 before buyers can reset again.
Key price zones to watch
Current reaction area: 4,400 - 4,412.770
Main demand / reload zone: 4,280 - 4,317.985
Bullish confirmation zone: clean hold above 4,317.985
First upside liquidity target: 4,450
Main upside target: 4,500
Lower support if buyers fail: 4,233.820
Major lower liquidity: 4,106.750
Invalidation: clean close below 4,280
Do you think gold needs to retest 4,317 before continuing higher, or can buyers keep pushing straight toward 4,500?
Short 
Bitcoin H2 - Bears Continue, Correction SignalBitcoin is trading around 64,900 USD, up slightly by about 106 USD on the day, but has not yet made a clear breakthrough.
Today's fluctuation range is only in the range of 64,696–65,348 USD, showing that BTC is inclined to accumulate rather than extend the trend.
On H2, Bitcoin recovered well from the $62,400–62,800 zone, but is now repeatedly blocked below the $65,300–65,500 resistance zone. The price continuously tried to break out but could not maintain above, while RSI also turned to cool down.
To me, this is a signal that short-term upward momentum is weakening.
If $65,500 continues to be defended, BTCUSD is likely to enter a correction back to the $63,200–$63,600 range before the market finds new momentum.
The notable thing this week is still the US CPI on August 12; Before this important data, the sideway state under resistance may continue.  Short
Short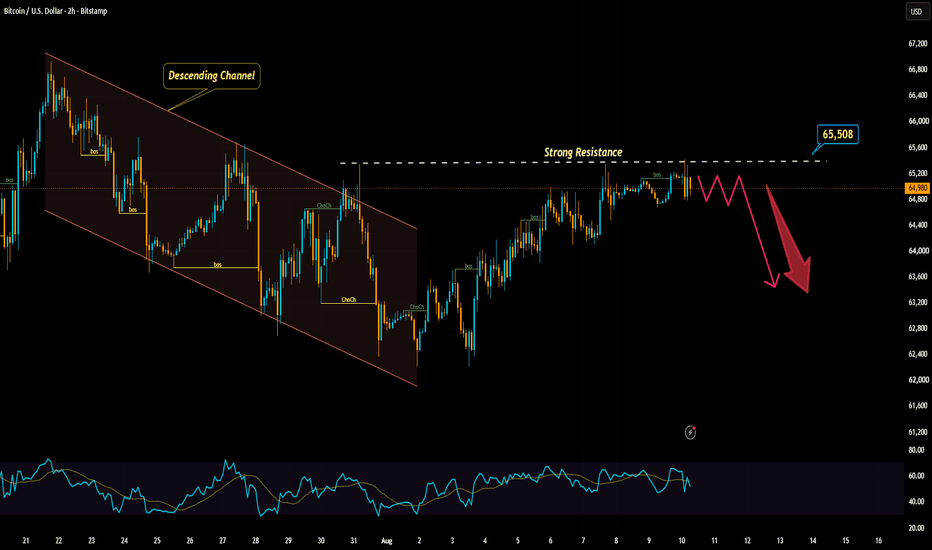
BTCUSDT: FED pressures the USD, Bulls keep pushing!Bitcoin is currently trading around 65,042 USDT. The current 8-hour (H8) candle shows a gain of approximately 140 USDT (+0.22%), indicating that buying pressure persists but lacks the strength to trigger a clear breakout. Prices are consolidating after recovering from the lows seen earlier this month.
The macroeconomic backdrop remains relatively favorable for Bitcoin this morning. Weak US labor data has dampened expectations of a Fed rate hike, thereby exerting downward pressure on the USD and bond yields—an environment that typically supports risk assets.
On the H8 timeframe, the short-term structure is improving as the price holds above both the EMA34 (around 64,445) and the EMA89 (around 64,243). I am keeping a close watch on the 62,500–63,800 USDT support zone.
In this scenario, strong buying interest from the support zone could drive BTCUSDT back to the 66,000–66,900 USDT range, with the 66,911 level serving as a key target on the chart.
Conversely, if the price breaks decisively below 62,500 and fails to recover, the bullish outlook will need to be re-evaluated.
Are you waiting for a BTC pullback to buy, or do you expect a direct breakout to 66,900? Long 
XAUUSD: Pullback Sets Stage for Bulls!Gold is undergoing a correction during the week's opening session following a strong rally late last week. Spot gold has dipped approximately 0.5%—a drop of over $20/oz—to hover around $4,322, placing it very close to the $4,320 level visible on the chart.
Nevertheless, the macroeconomic backdrop remains supportive of gold. Weak US labor data has lowered expectations for a Federal Reserve rate hike in September from roughly 67% to 44%, while the US Dollar remains near a two-month low. These factors continue to limit the potential for a sharp decline in XAUUSD.
On the 4-hour (H4) chart, a notable development is that the price has broken out of the previous downtrend channel and is holding above the EMA34 and EMA89, indicating that the bullish structure remains intact. I am keeping a close watch on the $4,200–$4,250 zone—specifically around $4,250—as it serves as both a technical support level and aligns closely with the EMA34.
A pullback to this area would be consistent with a standard retracement within an uptrend, rather than signaling a trend reversal.
If XAUUSD shows a clear bullish response around the $4,200–$4,250 range, I lean towards the scenario where the price regains momentum and targets the $4,440–$4,480 zone.
Conversely, a decisive H4 close below the $4,200 level would significantly weaken this bullish outlook.
What do you think? Will gold retest $4,250 before resuming its rise, or will buyers step in sooner? Long 
 Long
Long
Short 
XAUUSD: Uptrend Continues After BreakoutGold is showing a strong bullish continuation after breaking away from the previous downtrend structure. From Kelly’s view, the chart suggests that XAUUSD has already formed a clean 5-wave recovery pattern on the H4 timeframe, and the market may continue higher if the next correction stays controlled.
The key idea is simple: gold is bullish, but after a strong rally, a short-term ABC pullback may create a cleaner continuation setup.
⟡ Market structure
The chart shows gold broke above the downtrend line and pushed strongly into the 4,346 area. This breakout is important because it confirms that sellers are no longer controlling the short-term structure.
Price is now trading near the end point of the bullish wave structure around 4,358. This area may create short-term hesitation, so a correction from here would be normal.
The main support to watch is 4,235. This is marked as the short-term ABC correction zone. If gold pulls back into this area and buyers defend it, the next bullish wave may continue towards the weekly liquidity resistance around 4,455.
➤ Key levels
◌ 4,346: current price reaction area
◌ 4,358: end point of current bullish wave structure
◌ 4,235: short-term ABC correction / main buy reaction zone
◌ 4,162: contested price acceptance zone
◌ 4,455: weekly resistance and liquidity target
◌ Below 4,162: area where the bullish setup starts to weaken
⌁ Elliott Wave view
From an Elliott Wave perspective, gold appears to have completed a strong bullish 5-wave move after breaking the old downtrend.
Wave 1 started the first recovery from the lower base.
Wave 2 created a controlled correction.
Wave 3 pushed strongly higher and confirmed bullish momentum.
Wave 4 held structure before the next expansion.
Wave 5 is now reaching the 4,346–4,358 area.
After wave 5, an ABC correction is normal. If wave C finishes around 4,235 and buyers protect this area, gold may prepare for another bullish continuation towards 4,455.
▸ Trading scenario
Preferred scenario: wait for gold to correct into support and show bullish confirmation.
Entry zone: 4,235–4,250 if bullish confirmation appears
Stop loss: below the confirmed ABC low or below 4,162
Take profit 1: 4,346–4,358
Take profit 2: 4,400
Take profit 3: 4,455
Alternative scenario: if gold breaks above 4,358 without a deep pullback and holds strongly, price may continue directly towards 4,455. In that case, waiting for a retest of 4,358 as support would be the cleaner continuation setup.
⌁ Kelly’s view
For Kelly, the main trend is still bullish after the downtrend breakout. Gold has already shown strong buying pressure, but the market is now near an important reaction zone.
The best plan is patience. If gold corrects into 4,235 and buyers defend the zone, the next bullish move may continue towards the weekly liquidity target.
Gold remains in a bullish continuation structure.
If the ABC correction holds, the next upside target is 4,455. Long 
 Education

 Education

 Long
Long
JUBLFOOD: Adam & Eve Pattern Near a Key Breakout ZoneJUBLFOOD has been showing an interesting change in structure on the daily chart.
After falling toward the ₹405–₹410 area, the stock started recovering. The first bottom was sharp, while the second bottom developed more gradually around ₹410–₹425.
This creates a potential Adam & Eve double-bottom pattern.
The most important part of the setup is now the neckline.
The ₹495–₹500 Zone Matters
Price has climbed strongly back toward the ₹495–₹500 area, where the previous recovery attempt failed.
This makes the current zone extremely important.
If buyers can push price above ₹500 and sustain it, the pattern could receive confirmation.
But simply touching or briefly crossing ₹500 isn't enough.
I'd want to see a strong daily close above the neckline, ideally supported by healthy volume.
Why the Pattern Is Interesting
There are several positive signs on the chart:
Price has moved sharply higher from the ₹410–₹420 zone.
The short-term moving averages have turned upward.
Price is trading above the moving averages.
Recent buying candles show improving momentum.
Volume has picked up during the latest advance.
The structure has started forming higher highs and higher lows
.
Together, these signs suggest that buyers have become much more active than they were during the earlier decline.
The Breakout Is Still the Key
This is where patience becomes important.
If JUBLFOOD breaks above ₹500, holds above it, and successfully retests the area, the breakout would look much stronger.
On the other hand, if price moves above ₹500 and quickly falls back below it, that could become a false breakout.
In that situation, traders should be careful about chasing the move.
What About the Pattern Target?
The traditional Adam & Eve measurement uses the depth of the pattern and projects it upward from the neckline.
With the neckline around ₹500 and the pattern low around ₹405–₹410, the theoretical projection comes roughly toward the ₹590–₹595 region.
But this should be treated as a measured pattern objective, not a guaranteed target.
Price can face resistance well before reaching that level.
What I'm Watching Next
For me, the chart comes down to one simple question:
Can JUBLFOOD turn ₹500 from resistance into support?
If yes, the bullish structure becomes much more convincing.
If the stock gets rejected and falls back into the previous range, the breakout thesis needs to be reconsidered.
The setup is interesting, but the market still has to confirm it.
Final View
JUBLFOOD is approaching a major decision zone around ₹495–₹500.
The Adam & Eve structure is visible, momentum has improved, and buyers have pushed price back to the neckline.
Now the important part is not predicting the breakout.
It's watching how price behaves when it gets there.
A pattern creates the opportunity. Price action provides the confirmation. The Quiet Phase Before Every Explosive MoveThe Market Gets Quiet Before It Gets Aggressive:
Markets do not always make a big move out of nowhere. Before many explosive moves, price goes through a quiet phase in which candles become smaller, volatility decreases, and price moves within a narrow range. This phase can look boring, but it can also be a sign that the market is becoming compressed. Instead of trying to predict the next move, I prefer to observe how price behaves during this period.
Small Candles Can Show Increasing Pressure:
When candle sizes start to decrease, it does not always mean the market has lost interest. Sometimes it means buyers and sellers are becoming more balanced. Neither side can move price very far, so the trading range becomes tighter. The important part is not the small candles themselves, but the fact that price is struggling to move away from the same area.
Low Volatility Does Not Tell You the Direction:
A quiet market can eventually move strongly, but the quiet phase alone cannot tell us whether the next move will be bullish or bearish. This is an important distinction. Low volatility is not a buy or sell signal. It simply tells me that the market is becoming compressed. For direction, I still look at the higher-timeframe trend, important levels, market structure, and how price reacts when it finally leaves the range.
The Breakout Is Only Part of the Story:
Most traders focus on the candle that breaks out of the range. I think the behaviour before that breakout is equally important. If price has spent hours or days moving inside a tight area, the breakout is coming after a period of compression. That gives the move more context. Instead of asking only, “Did price break out?”, I want to know, “What was price doing before the breakout?”
The First Breakout Can Be Misleading:
A quiet range can produce a false breakout before the real move begins. Price may briefly move above resistance, attract buyers, and then fall back into the range. The same thing can happen below support. This is why I don't automatically chase the first breakout. I want to see whether price can hold outside the range and whether the market is actually accepting the new price area.
Failed Attempts Can Reveal Strength:
One of the most useful things to watch is what price repeatedly tries to do but cannot accomplish. If sellers keep pushing toward support but fail to create meaningful downside movement, sellers may not be as strong as they appear. If buyers repeatedly attack resistance but cannot hold higher prices, buyers may be struggling. These failed attempts can provide useful information about the balance between buyers and sellers.
Not Every Quiet Market Will Explode:
This is where traders often make a mistake. They see a tight range and immediately expect a huge move. That is not how I approach it. A market can remain quiet for a long time, and sometimes the eventual move is not particularly large. The quiet phase should therefore be treated as something to observe, not as an automatic trading signal.
The Real Opportunity Is in the Preparation:
The explosive candle usually gets all the attention because it is easy to see. But the preparation happens before it. The tightening range, decreasing volatility, repeated tests of important levels, and failed attempts to move away from the area can all provide clues. By the time the large candle appears, the market may have already been preparing for that move for quite some time.
Sometimes the Market Whispers Before It Shouts:
The main lesson I take from this behaviour is simple: the market can become most interesting when it looks least interesting. A quiet phase does not tell us exactly when or where the next explosive move will happen, but it can tell us that price is becoming compressed. Instead of trying to predict the explosion, I would rather identify the compression, mark the important levels, and wait for price to show which side has actually taken control.
Conclusion:
The quiet phase is not something I see as a period where nothing is happening. It is often where the market is preparing for its next important move. Small candles, falling volatility, repeated tests, and failed attempts can all show that price is becoming compressed. But compression alone is not a signal to enter a trade. The real opportunity comes when price finally breaks out and proves that one side has taken control. Instead of chasing the explosive move after everyone notices it, studying the quiet phase can help us understand where that move may have started.
By @BrightRally_Research on @TradingView  Education
Gold 2H - Bears Take Control, Next Pressure!Gold opened the new week quite cautiously. From the opening range of around 4,340 USD, XAUUSD has retreated to about 4,324 USD on the chart, equivalent to a decrease of nearly 18 USD.
Compared to the latest peak at 4,370.6 USD, the price has now adjusted about 46 USD after a week of increase of more than 7%. The previous strong rally was fueled by a US jobs report that was much weaker than expected, causing expectations for the Fed to raise interest rates to decrease significantly.
Looking at H2, the large structure is still positive after the price successfully broke the neckline around 4,170.9 USD. However, the recent increase has been quite rapid and is facing clear selling pressure at 4,370.6 USD.
Prices have not yet been able to hold the peak area, while RSI also began to cool down after entering the high area - a sign that short-term buying momentum is no longer as strong as before.
Notably, there was no major US economic data today that could immediately change the story of gold. Therefore, I am inclined to the possibility that the current decline is profit-taking and a technical retest.
If $4,370 continues to hold as resistance, XAUUSD could extend the correction and gradually return to test the old breakout zone around $4,170–4,200.
This is also an important neckline area on the chart and will be a notable area if profit-taking pressure continues to increase. Short 
RELIANCE INDUSTRIES Reliance Industries operates as a conglomerate across four core growth drivers:
Oil-to-Chemicals (O2C): Refining, petrochemicals, and fuel retailing (joint venture with BP). Forms the traditional cash-flow backbone of the group.
Jio Platforms: India's largest telecom and digital infrastructure provider, driving 5G expansion, cloud services, and digital media.
Reliance Retail: The country's largest retail operator across grocery, electronics, fashion, and e-commerce (Jiomart).
Green Energy & New Materials: Strategic multi-billion dollar expansion into solar gigafactories, energy storage, green hydrogen, and fuel cell manufacturing.  Long
Long