Long
Long
 Education
 Long
Long
NIFTY : Trading levels and plan for 20-Jul-2026Reference Close: 24,343.65 | O: 24,328.75 | H: 24,352.65 | L: 24,320.30
Namaste Traders! 🙏 Here's the structured plan for tomorrow's session covering all three opening scenarios — Gap Up, Flat, and Gap Down — considering a gap threshold of 100+ points. Please go through the chart legend before trading. ⬇️
🗺️ Chart Legend (Important!)
• 🟠 Orange Line/Zone (No Trade Zone) — Sideways/consolidation area acting as both support & resistance. Avoid fresh positions here; market is undecided.
• 🟢 Green Line — Bullish structure / Long bias confirmed once broken with strength.
• 🔴 Red Line — Bearish structure / Short bias confirmed once broken with weakness.
• ➖ Dashed Lines (Green/Red) — "Maybe" zones — trend may or may not continue here. Treat as extended targets, not guaranteed moves. Trail SL and book partial profits.
🔑 Key Levels for 20-Jul-2026
• 🟠 No Trade Zone (Support/Resistance): 24,286 – 24,332
• 🟢 Last Intraday Resistance Zone: 24,464 – 24,510
• 🟢 Opening Support (Gap Down Open Case): 24,245
• 🟢 Last Intraday Support: 24,169
• 🟢 Deeper Support: 24,086
🟢 SCENARIO 1: GAP UP OPENING (100+ points, i.e., open above ~24,432)
📘 Explanation: A gap up of 100+ points takes the market well above the No Trade Zone (24,286–24,332), landing it directly near or inside the Last Intraday Resistance zone (24,464–24,510). This reflects strong positive momentum carried from global cues or overnight news flow.
📌 Plan of Action:
• If Nifty opens above 24,432 and sustains above 24,464–24,510 on 15-min candle close basis → Bullish continuation confirmed (green breakout).
• 🎯 Enter long only on a retest & hold of 24,464–24,510 as support — avoid chasing the first green candle.
• Target 1: 24,560 | Target 2: dashed green extension zone (trend "may" extend further — trail SL and book partials as momentum can fade near round figures).
• Stop Loss: Below 24,464 (zone breakdown invalidates the bullish setup).
• ⚠️ If price gaps up but slips back into the No Trade Zone (24,286–24,332), treat it as a gap-fill trap — wait for fresh confirmation before re-entering.
• For Options: Prefer Bull Call Spread or slightly OTM Calls with strict SL; avoid aggressive naked buying right at open due to IV crush risk after a gap.
📌 📌 📌
🟠 SCENARIO 2: FLAT OPENING (Within ±100 points, inside/near No Trade Zone 24,286–24,332)
📘 Explanation: A flat opening means the gap is under 100 points and price opens within or close to the No Trade Zone. This zone acts as a pivot battle area between bulls and bears — as seen in the orange zig-zag pattern on the chart, expect choppy price action until a clear breakout.
📌 Plan of Action:
• 🚫 Avoid trading immediately at open — this is a "No Trade Zone." Allow the first 15–30 minutes to establish direction.
• If price breaks above 24,332 and sustains → shift bias to bullish, follow Gap Up scenario targets (24,464 → 24,510 → 24,560).
• If price breaks below 24,286 and sustains → shift bias to bearish, follow Gap Down scenario targets (24,245 → 24,169 → 24,086).
• 🎯 Best approach: Wait for a breakout + retest on either side of the No Trade Zone before committing capital.
• For Options: This is the ideal zone for Option Sellers (Iron Condor / Short Straddle with hedge) since range-bound moves favor time decay. Directional traders should stay patient until breakout confirmation.
📌 📌 📌
🔴 SCENARIO 3: GAP DOWN OPENING (100+ points, i.e., open below ~24,186)
📘 Explanation: A gap down of 100+ points pushes the market below the No Trade Zone toward the Opening Support (24,245) and further down to Last Intraday Support (24,169). This suggests weak overnight sentiment with sellers dictating the early move.
📌 Plan of Action:
• If Nifty opens below 24,186 and sustains below 24,245 on 15-min candle close basis → Bearish continuation confirmed (red breakdown).
• 🎯 Enter short only on a pullback/retest of 24,245–24,169 zone turning into resistance — don't short blindly on the opening candle.
• Target 1: 24,169 | Target 2: 24,086 (dashed red extension zone — trend "may" extend further, book partial profits and trail SL as this is a deeper support cluster).
• Stop Loss: Above 24,245 (reclaim of this level invalidates the bearish setup).
• ⚠️ Watch for a sharp V-shape recovery back into the No Trade Zone — if 24,286 is reclaimed intraday, exit shorts immediately.
• For Options: Prefer Bear Put Spread or slightly OTM Puts with a defined SL; avoid over-leveraging on gap-down panic since sharp pullback rallies are common after such gaps.
📌 📌 📌
⚙️ RISK MANAGEMENT TIPS FOR OPTIONS TRADING 🛡️
• 💰 Never risk more than 1–2% of total capital on a single options trade.
• 📉 Always use a hard Stop Loss — options decay fast; don't rely on mental SL.
• ⏱️ Avoid buying options right at market open during high volatility — let IV settle for the first 10-15 minutes.
• 🎯 Book partial profits at Target 1, trail SL to cost for the remaining position at Target 2.
• 🚫 Avoid overtrading in the No Trade Zone — capital preservation is a win too.
• 📊 Always align option strikes with liquidity (tight bid-ask spread) to avoid slippage.
• 🧘 Avoid revenge trading after a SL hit — stick to the plan, not emotions.
• 📅 Be mindful of time decay (Theta) — avoid holding weekly options overnight without strong conviction.
• 🔄 On gap openings, wait for the first candle to close before deciding entry — gap opens often see immediate reversal (gap-fill) moves.
📝 SUMMARY & CONCLUSION
Tomorrow's session revolves around the No Trade Zone (24,286–24,332), which is acting as a key pivot. A Gap Up (100+) opens the path toward 24,464–24,510 and further to 24,560 (bullish path 🟢). A Gap Down (100+) opens the path toward 24,245 → 24,169 → 24,086 (bearish path 🔴). A Flat opening keeps the market range-bound until a decisive breakout occurs — patience is essential here 🟠. Always wait for confirmation candles, respect stop losses, and manage position sizing carefully. Trade the plan, not your emotions! 🎯
⚠️ Disclaimer: I am not a SEBI registered analyst. This post is for educational purposes only and should not be considered as investment/trading advice. Please consult your financial advisor and do your own research before making any trading/investment decisions. Trading in equities/options/derivatives is subject to market risk. 🙏  Long
Long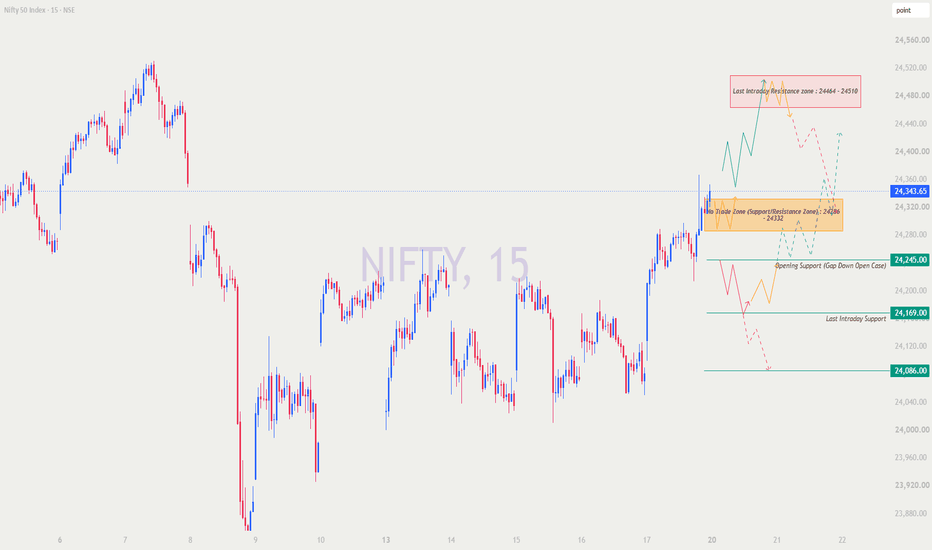
 Short
Short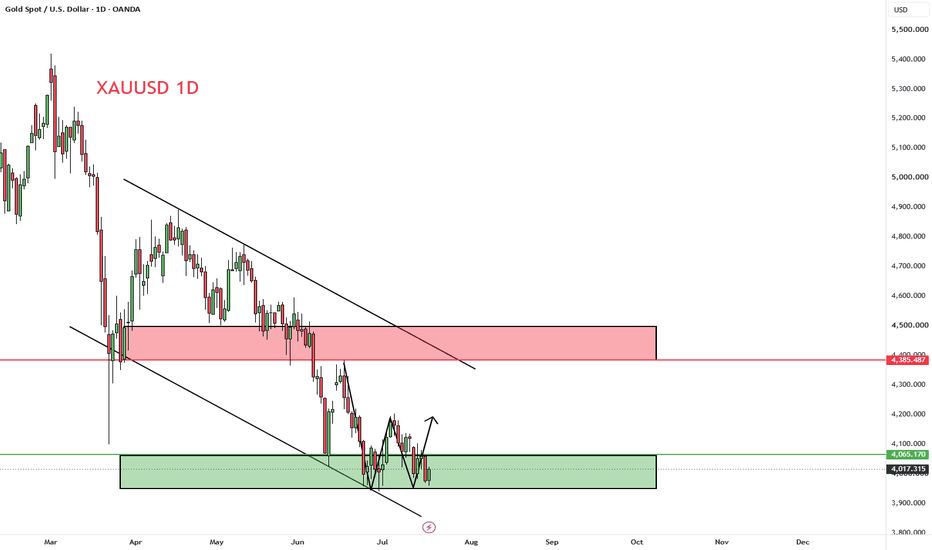
Long 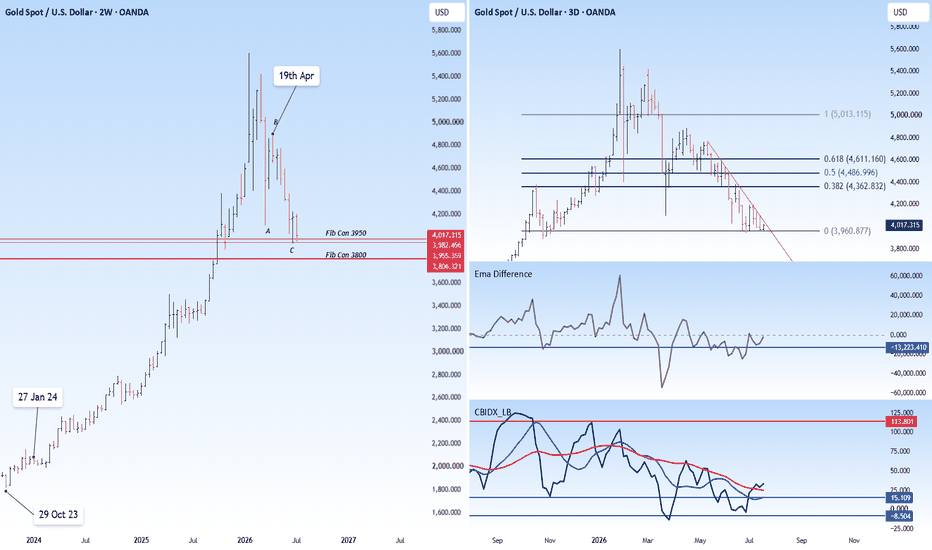
Eternal/Zomato can be exceptional stock for next 5 years Based on my Elliott Wave analysis, Eternal (formerly Zomato) appears to have completed a larger Wave 2 correction and may now be forming multiple nested 1–2 wave structures. If this interpretation is correct, the stock could be preparing for a strong Wave 3 advance, which is typically the most powerful phase in an Elliott Wave cycle.
From a business perspective, the investment thesis also looks compelling. Eternal provides exposure to multiple long-term growth segments through its food delivery business and Blinkit, giving investors participation in both online food delivery and the rapidly expanding quick-commerce market.
If execution remains strong, profitability continues to improve, and the Wave 3 scenario plays out as expected, the stock has the potential to become a multibagger over the long term. That said, Elliott Wave analysis is a probabilistic framework rather than a certainty, so risk management and monitoring business fundamentals remain important.  Long
Long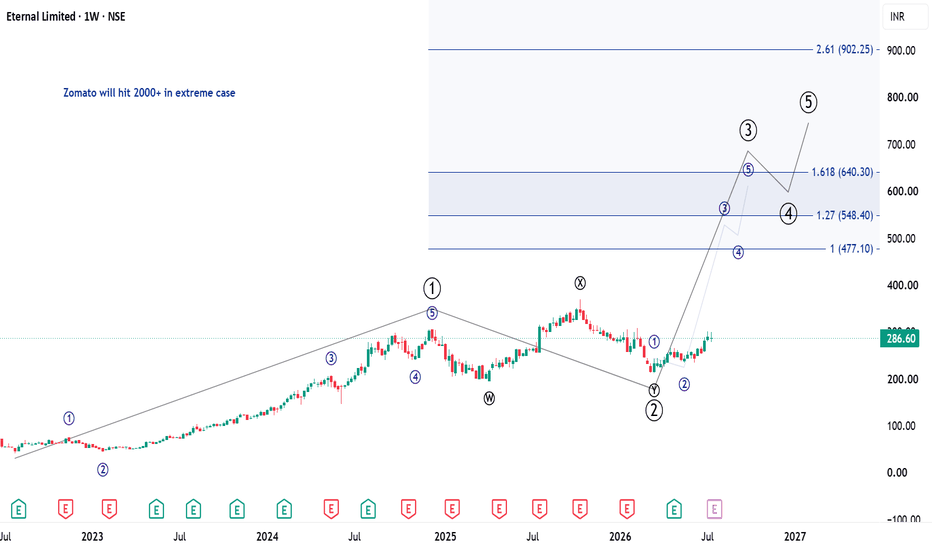
Technical AnalysisCore of Technical Analysis
Technical Analysis is the study of past price movements, volume, and market trends to predict future price direction.
3 Main Principles:
Market Discounts Everything
All news, emotions, and fundamentals are already reflected in price.
Prices Move in Trends
Markets usually move in uptrend, downtrend, or sideways trends.
History Repeats Itself
Human psychology creates repeating chart patterns.
Key Tools:
Charts (Candlestick, Line, Bar)
Support & Resistance
Trendlines
Indicators (RSI, MACD, Moving Averages)
Volume Analysis  Education

How Monthly Structure Shapes Weekly Behavior🟢 This post is educational and observational in nature based on historical price action across multiple timeframes. It is not a forecast or a trading recommendation.
📈 Higher Timeframe
A higher timeframe refers to a chart view that compresses more time into each candle, such as monthly or weekly charts compared to daily or hourly ones. Higher timeframes tend to filter out short term noise and reveal the broader structural context a stock is trading within.
📏 Monthly Trendline
Marked in green, this trendline is drawn purely on the monthly timeframe. A trendline connects a series of highs or lows to reflect the underlying direction of price over a longer horizon, and because it originates from the monthly chart, it carries more structural weight than a trendline drawn on a lower timeframe.
📉 Bringing the Monthly Into the Weekly
On the right side of this post, the same monthly trendline has been carried over and overlaid onto the weekly timeframe. This is a deliberate multi timeframe approach, since a line drawn on a higher timeframe often continues to act as a relevant reference point even when viewed on a lower one.
🔄 The Flip Zone on the Weekly
Once overlaid, this level shows a clear flip zone on the weekly chart. What was previously acting as resistance on the weekly timeframe has, after being broken, converted into support
↩️ The Counter Trendline
Marked in white is a counter trendline, drawn against the direction of the primary trend. It is used to track corrective or pullback phases  Long
Long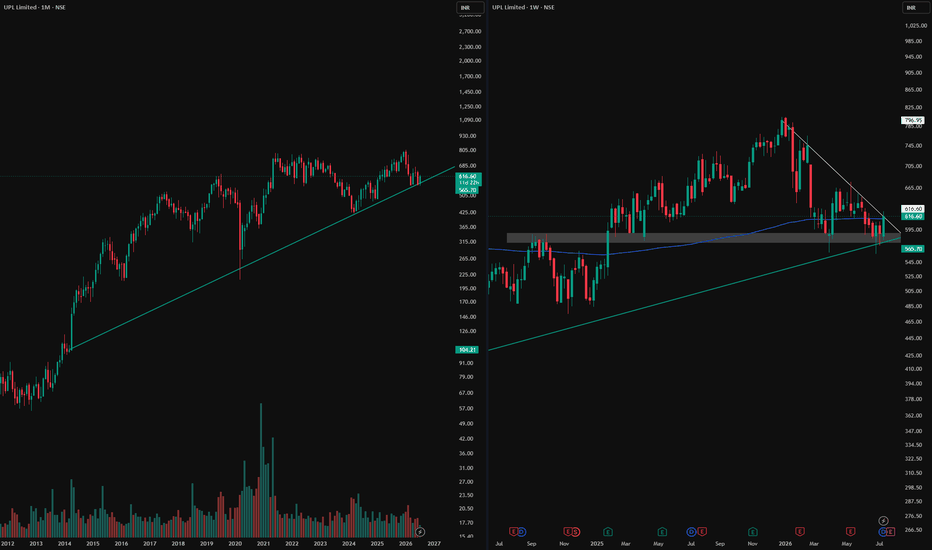
Short 
Short 
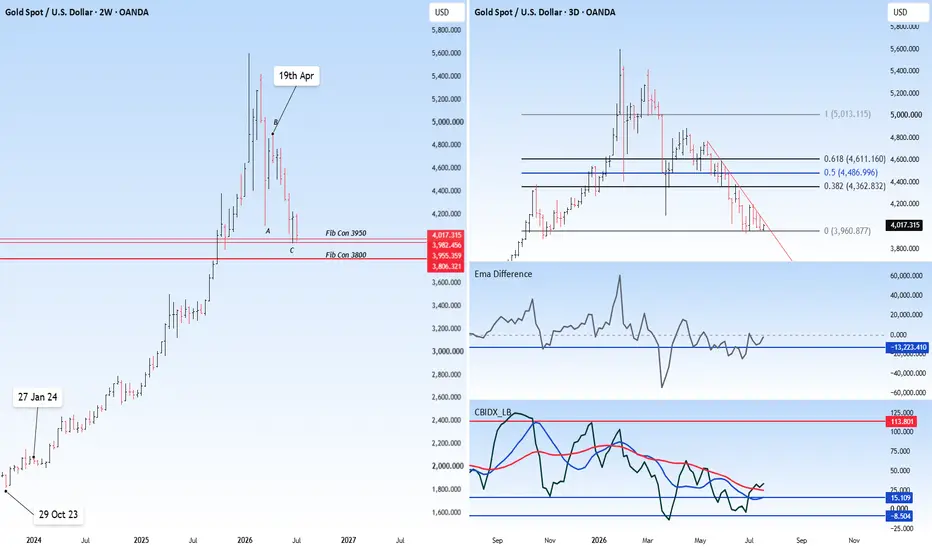
XAUUSD: Weekly bearish aims for final wave 5 zoneGold is still trading inside a broader bearish structure, and the weekly outlook continues to favor downside continuation. From Kelly’s view, the latest recovery looks more like a corrective rebound into resistance, while the main Elliott structure still suggests that wave 5 may extend lower.
The key idea is simple: as long as gold remains below the descending trendline and the sell wave B zone, the bearish weekly scenario stays active.
⟡ Market structure
The chart shows gold has been respecting a clear descending trendline, with repeated lower highs forming across the structure. Each recovery attempt has been capped under resistance, showing that buyers still lack strong control.
Price recently tested the lower support around 3,955–3,970 and bounced slightly, but the rebound is still weak. The nearest sell area is around 4,017–4,025, where the chart marks the sell wave B zone.
If gold retests this zone and fails to break above it, sellers may continue pushing price lower towards the final Elliott wave target near 3,845–3,855.
➤ Key levels
◌ 3,955–3,970: recent low and done test area
◌ 4,017–4,025: sell wave B zone and short-term resistance
◌ 4,050–4,075: higher resistance if the rebound expands
◌ 3,845–3,855: final wave 5 target area
◌ Above 4,075: area where the bearish weekly setup starts to weaken
⌁ Elliott Wave view
From an Elliott Wave perspective, gold appears to be developing the final bearish phase of a larger 5-wave decline.
Wave 1 started from the upper structure.
Wave 2 formed a corrective rebound but failed below trendline resistance.
Wave 3 pushed price lower with stronger bearish pressure.
Wave 4 may now be forming as a small recovery into the sell wave B zone.
If this resistance holds, wave 5 may continue lower towards the 1.618 Fibonacci extension area near 3,845–3,855.
This is why Kelly would not treat the current bounce as a full reversal yet. The market is still below the descending trendline, and the structure continues to favor sell reactions from resistance.
▸ Trading scenario
Preferred scenario: wait for gold to retest the 4,017–4,025 sell zone and show bearish confirmation.
Sell zone: 4,017–4,025 if rejection appears
Stop loss: above the confirmed rejection high or above 4,075
Take profit 1: 3,955–3,970
Take profit 2: 3,900
Take profit 3: 3,845–3,855
Alternative scenario: if gold breaks above 4,075 and holds with strong acceptance, the bearish wave 5 setup weakens. In that case, the market may shift into a larger corrective recovery before the next weekly direction becomes clear.
⌁ Kelly’s view
For Kelly, the weekly structure still favors selling the rebound. Gold has reacted from support, but the bounce remains corrective while price stays below the sell wave B zone and the descending trendline.
The cleaner plan is not to chase the low. Wait for price to retest resistance, then watch whether sellers defend the structure.
Gold may still have one more bearish leg ahead.
If the sell zone holds, the final wave 5 target remains open for next week.
Share your view below. Short 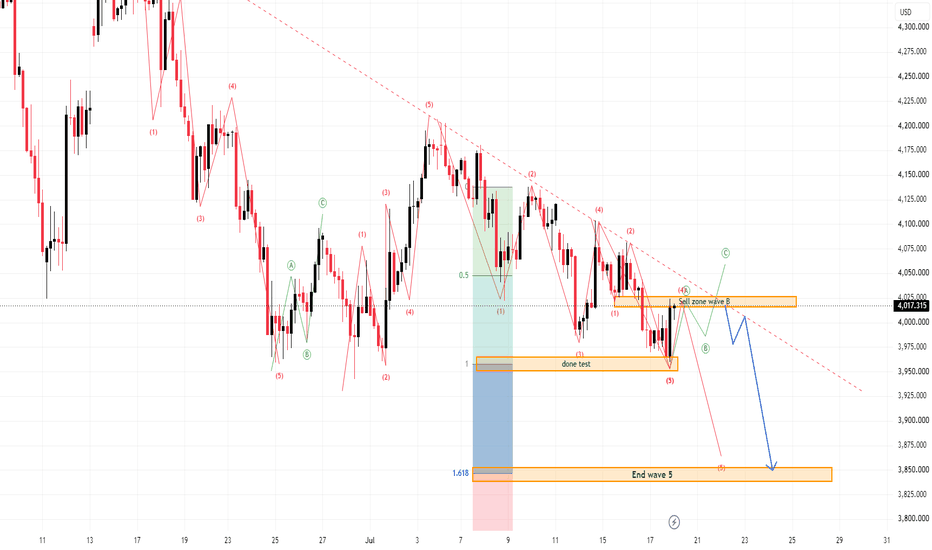
 Long
Long
XAUUSD — 3,960 Is the Liquidity Pool XAUUSD — 3,960 Is the Liquidity Pool
Gold is sitting in a very important part of the chart now, and this is the kind of area where the market usually tries to confuse both sides before the real move appears.
Price has been moving lower for several weeks, printing weaker structure after each recovery. Every time buyers tried to push back, gold failed to reclaim the higher liquidity zones around 4,180 - 4,200, then slowly drifted back toward the lower range. That tells me the bigger pressure is still heavy, but the current location is not a place where I want to chase the sell too late.
The main story here is the liquidity pool around 3,940 - 3,970. Price has already travelled deep into discount, and this lower zone is where sell-side liquidity has been building for a long time. For newer traders, think of it like a pool under the market: once price comes close, it often wants to dip into it, collect liquidity, and then breathe back upward before deciding the next bigger direction.
That is why my short-term view is leaning bullish from the liquidity pool, as long as gold holds above 3,940 - 3,960. If buyers can defend this zone, the next area price may try to revisit is the POI around 4,080 - 4,110. That is where I would expect the real test. If gold reaches that zone and reacts weakly, sellers may step back in again.
This recovery idea becomes weak if gold breaks below 3,940 and cannot recover. In that case, the liquidity pool fails, and the market may continue searching for deeper downside.
Key price zones to watch
Current reaction area: 3,960 - 4,020
Main demand / liquidity pool: 3,940 - 3,970
Bullish confirmation zone: clean hold above 4,020
Main upside POI target: 4,080 - 4,110
Next upside liquidity zone: 4,180 - 4,210
Buy-side liquidity: 4,320 - 4,360
Lower support if buyers fail: 3,940
Invalidation: clean close below 3,940
Do you see this 3,960 area as the place where gold starts a recovery, or do you think the market still needs one deeper sweep first?
Short 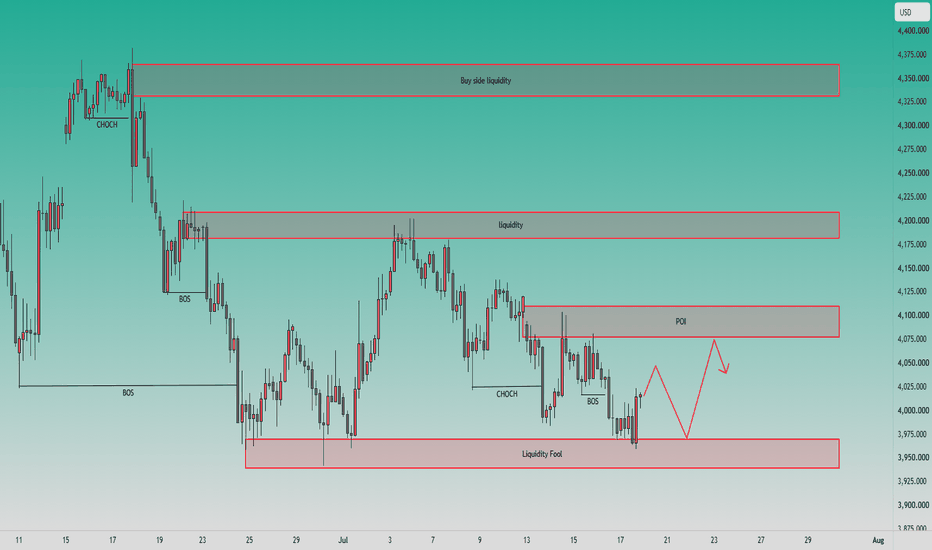
XAUUSD — Bearish Continuation Toward Fibonacci Target
Fundamental Analysis
Gold remains sensitive to USD momentum, Treasury yields, and upcoming U.S. macro data. For next week, the technical bias still leans bearish while price stays below the major descending structure.
Technical Analysis
On the 4H chart, XAUUSD is trading around 4,017 after losing momentum under the downtrend trendline. The nearest sell reaction zone is around 4,050 - 4,070, where price may retest the Fibonacci sell area before another downside move. If this zone rejects price, sellers may continue to push gold toward the lower Fibonacci psychological target around 3,755. A stronger recovery toward 4,203 or 4,300 - 4,384 would only be a deeper bearish retest unless price breaks the major downtrend.
Important Key Levels
Current price: 4,017
Nearest sell zone: 4,050 - 4,070
Strong resistance: 4,203
Fibonacci liquidity zone: 4,290 - 4,310
Major Fibonacci sell zone: 4,380 - 4,384
Main downside target: 3,755 - 3,740
Invalidation: above 4,203
Trading Scenario
Main Sell Setup
Entry: 4,050 - 4,070
Stop Loss: 4,203
Take Profit 1: 3,950
Take Profit 2: 3,850
Take Profit 3: 3,755 - 3,740
Sell Condition
Wait for gold to recover into the 4,050 - 4,070 Fibonacci sell zone and show bearish rejection. A failed reclaim, long upper wick, bearish engulfing candle, or close back below the zone would confirm seller pressure. If price breaks below the recent low, the bearish continuation setup becomes stronger. If gold breaks and holds above 4,203, this sell setup should be invalidated.
Overall View
The main view for next week remains bearish while XAUUSD trades below the downtrend structure. A short-term recovery can happen, but the preferred plan is to wait for price to retest the Fibonacci sell zone before looking for continuation toward the 3,755 - 3,740 target area.
Do you share the same bearish view on gold for next week, or are you waiting for a deeper retest near 4,203 first?
Short 
 Long
Long
 Long
Long
Risk Management Determines Long-Term SuccessEvery trader dreams of finding the perfect strategy.
Some spend years searching for the best indicator.
Others constantly switch between chart patterns, timeframes, or trading systems, believing the next one will finally unlock consistent profits.
Yet many of these traders continue to lose money.
Not because their analysis is poor.
But because they ignore the one skill that matters more than any entry signal:
Risk management.
In trading, success isn't determined by how much you make on your best trade.
It's determined by how well you protect yourself during your worst ones.
Every Trader Will Experience Losses
One of the biggest misconceptions in trading is the belief that successful traders rarely lose.
The reality is very different.
Even the most experienced professionals have losing trades, losing weeks, and sometimes even losing months.
The difference is not that they avoid losses.
The difference is that they control them.
They understand that losses are a normal part of a probability-based business.
Instead of trying to eliminate risk, they focus on managing it.
Capital Is Your Greatest Asset
Without capital, there is no trading.
Every opportunity in the market requires one thing:
The ability to participate.
A trader who loses half of their account doesn't just lose money.
They lose flexibility, confidence, and future opportunities.
Recovering from large losses is far more difficult than most people realize.
A 50% loss requires a 100% gain just to return to break-even.
That is why protecting capital should always come before chasing profits.
Small Losses Keep You in the Game
Many beginners view losing trades as failures.
Professional traders see them as operating costs.
Every business has expenses.
For a trader, controlled losses are simply part of doing business.
The goal is not to avoid every losing trade.
The goal is to ensure that no single trade causes significant damage.
A series of small losses is manageable.
One uncontrolled loss can erase months of steady progress.
Position Size Matters More Than Confidence
Confidence can be dangerous.
A trader may believe they have found the perfect setup and decide to risk a large portion of their account.
But the market doesn't reward confidence.
It rewards discipline.
Professional traders often risk only a small percentage of their capital on any single trade.
This approach allows them to survive unexpected events and continue trading with a clear mind.
Long-term consistency comes from controlled position sizing, not oversized bets.
Winning Isn't Everything
Many traders judge themselves by their win rate.
But winning frequently does not automatically lead to profitability.
Imagine two traders.
One wins 80% of their trades but allows losses to become much larger than gains.
Another wins only half of the time but keeps losses small and lets profitable trades grow.
Over hundreds of trades, the second trader may produce much stronger results.
Long-term success depends on the relationship between risk and reward, not simply how often you are right.
Risk Management Supports Emotional Control
Large financial risk creates emotional pressure.
Fear encourages traders to exit winning trades too early.
Hope convinces them to hold losing positions for too long.
Greed tempts them to increase position size after a few successful trades.
When risk is controlled, emotions become easier to manage.
Smaller exposure allows traders to follow their plans instead of reacting impulsively.
Discipline becomes far easier when survival is never threatened by a single decision.
Think in Years, Not Trades
The market will always provide another opportunity.
Missing one trade is rarely important.
Protecting your ability to take the next hundred trades is.
Professional traders measure success over hundreds of trades, not individual outcomes.
They understand that consistency compounds over time.
One exceptional trade rarely builds a successful trading career.
Thousands of disciplined decisions do.
Final words:words:
Every trader wants better entries, stronger trends, and higher profits.
But none of those matter if poor risk management removes you from the market.
Long-term success belongs to traders who protect their capital, accept uncertainty, and remain disciplined through both winning and losing periods.
Strategies may change.
Markets may evolve.
Volatility may increase or decrease.
But one principle remains constant:
The traders who survive the longest are usually the ones who manage risk the best.
Because in trading, longevity is not an accident.
It is the direct result of disciplined risk management.
Education 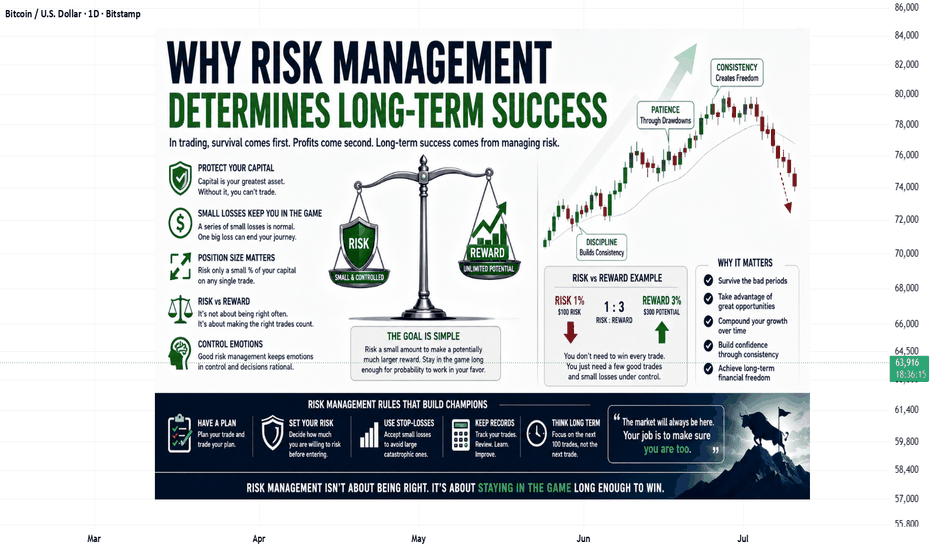
XAUUSD: Weak Bounce, Strong Sellers Above XAUUSD: Weak Bounce, Strong Sellers Above
Market Context
Gold is trading around 4,017 after a small rebound from the monthly low area. Buyers are reacting from demand, but the upside still looks limited.
US-Iran tensions and inflation concerns are keeping the USD supported, while the market is still pricing the possibility of a restrictive Fed stance. This creates pressure on gold whenever price rebounds into higher resistance.
Key point: gold is bouncing, but sellers are still waiting above. This is not a confirmed bullish reversal yet.
Technical Structure
Gold is rebounding from the Demand / Buy Reaction Zone around 3,960 - 4,000. This area is holding for now and may support a short-term bounce.
The first important resistance is 4,030 - 4,080. This is the Sell Reaction Zone. If price rebounds into this area and fails, selling pressure may return quickly.
Above that, the Major Supply Zone remains around 4,115 - 4,135. As long as gold stays below this zone, the broader structure still favors sellers.
If demand is lost, price may fall back toward 3,960 and possibly lower.
Key Levels
Current Price: 4,017
Demand / Buy Reaction Zone: 3,960 - 4,000
Sell Reaction Zone: 4,030 - 4,080
Major Supply Zone: 4,115 - 4,135
Bullish Confirmation: Above 4,080
Bearish Continuation: Below 3,960
Trading Plan
Buy Scenario
Entry: 3,960 - 4,000
SL: Below 3,940
TP: 4,030 / 4,060 / 4,080
Condition: Price holds demand and shows bullish confirmation. This is only a short-term rebound setup, not a full reversal.
Sell Scenario Priority
Entry: 4,030 - 4,080
SL: Above 4,100
TP: 4,017 / 4,000 / 3,960
Condition: Price rebounds into the Sell Reaction Zone and gets rejected. Sellers regain control if buyers fail to hold above 4,080.
Sell at Major Supply
Entry: 4,115 - 4,135
SL: Above 4,155
TP: 4,080 / 4,030 / 4,000
Condition: Price sweeps higher into major supply and fails to continue. This is the stronger sell area if the rebound extends.
Breakdown Sell
Entry: Below 3,960
SL: Above 4,000
TP: 3,940 / 3,920 / 3,900
Condition: Demand fails, retest is rejected, and bearish momentum continues.
Overall Bias
Gold is still not bullish yet. The rebound from demand is valid, but the structure remains weak below 4,030 - 4,080.
If buyers reclaim 4,080, gold may extend toward 4,115 - 4,135. If price rejects from the sell zone, sellers may push gold back toward 4,000 and 3,960.
Best approach: wait for confirmation at demand or resistance. Do not chase the bounce while gold is still below the sell zone.
Will gold break 4,080, or will sellers use this rebound to push price back into demand?
Short 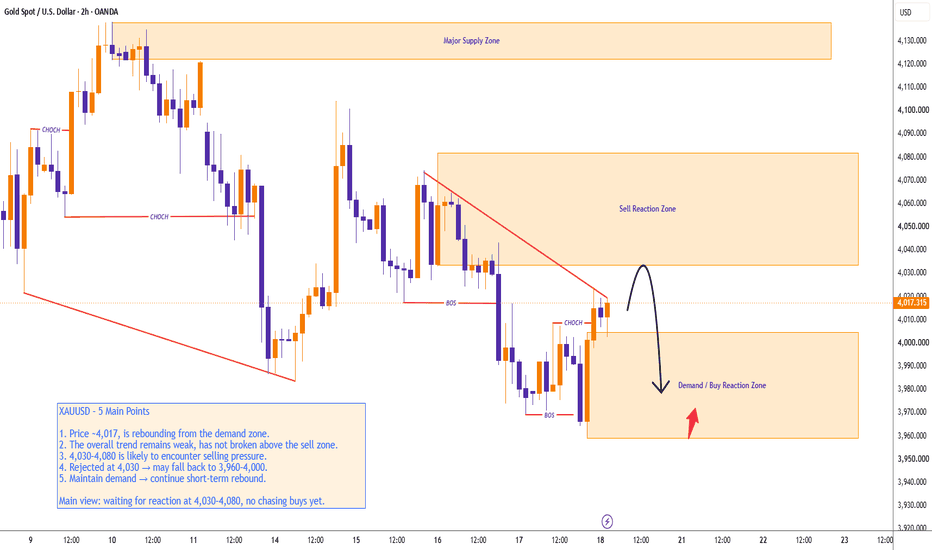
Education 
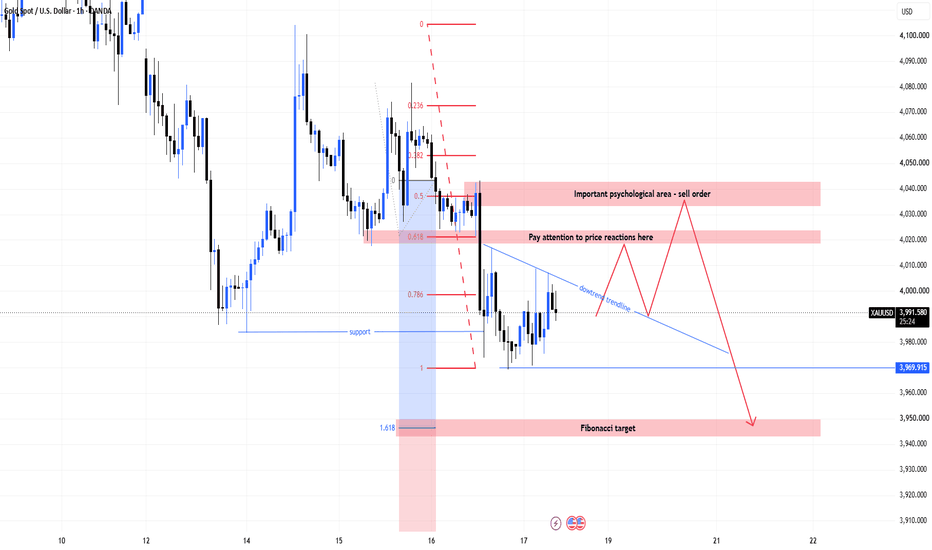
XAUUSD – Bearish Continuation Toward Fibonacci TargetXAUUSD is trading around 3,990 after failing to recover above the short-term downtrend structure. Price remains below the previous support area, and the current reaction still looks like a weak correction inside the bearish trend.
The priority view remains sell with the trend, especially if gold retests the 4,020–4,040 reaction zone and fails to break above the psychological sell order area.
Technical View
Gold is still moving under bearish pressure after the strong breakdown from the previous consolidation zone. The market failed to hold above the old support, and price is now trading below the short-term downtrend trendline.
The 4,020 area is the first reaction zone to watch. This level was marked on the chart as an important area for price reaction. If gold pulls back into this zone and shows rejection, it may confirm that buyers are still weak.
The 4,035–4,040 area is the main psychological sell order zone. This zone is important because it aligns with the Fibonacci reaction area and the previous breakdown structure. If price reaches this area and fails to continue higher, it may confirm another lower high before the next bearish leg.
The 3,969 support is the nearest downside level. If gold breaks below this area, the bearish structure may continue toward the Fibonacci 1.618 target around 3,945–3,950.
The main idea is simple: as long as gold stays below 4,020–4,040, the market remains under selling pressure, and recovery attempts should be treated as corrective.
Key Zones
Current price: 3,990
Price reaction zone: 4,020–4,025
Psychological sell order zone: 4,035–4,040
Downtrend resistance: 4,000–4,020
Nearest support: 3,969
Fibonacci 1.618 target: 3,945–3,950
Invalidation: above 4,045
Trading Plan
Sell Priority: 4,020–4,040
Condition: wait for bearish rejection, failed recovery above the downtrend trendline, or price staying below the psychological sell order zone.
SL: above 4,045
TP1: 3,969
TP2: 3,945–3,950
TP3: 3,920–3,930
Alternative Scenario
If gold breaks below 3,969 directly, wait for a retest of this level as resistance before looking for sell continuation toward the Fibonacci 1.618 target around 3,945–3,950.
Buy View
Buy is not the priority while price remains below the downtrend trendline and below the 4,020–4,040 resistance area. A short-term buy reaction may appear near 3,945–3,950, but it needs clear bullish confirmation first.
Final View
Overall, gold remains in a bearish continuation structure. The cleaner plan is to wait for price to retest the 4,020–4,040 sell zone and watch for rejection. As long as this area holds as resistance, the downside path toward 3,969 and the Fibonacci target around 3,945 remains in focus.
Will gold reject from the psychological sell zone first, or break below 3,969 directly toward the Fibonacci target?
Short