XAUUSD — Is 4,034 the Bull Trap?
Gold is now standing at a very important reaction area.
After moving inside the descending price channel, price has recovered back into the 4,028 - 4,034 zone.
This is not a random area.
It is the short zone on the chart, and it also lines up with the Fibonacci reaction area around 0.5 - 0.618.
That means one thing:
Gold is testing resistance, not confirming a reversal yet.
The simple read
Gold remains inside a descending channel.
The short-term pressure is still bearish while price stays below 4,034 and below the middle structure of the channel.
The current bounce may only be a retest before another downside move.
If gold rejects from 4,028 - 4,034, sellers may try to push price back toward 3,992 first.
If 3,992 breaks, the next reaction area is 3,969.
Below that, the key support zone around 3,945 becomes the main area to watch.
Key price zones
Current price area: 4,025 - 4,030
Short reaction zone: 4,028 - 4,034
Fibo reaction area: 4,031 - 4,026
First support: 3,992
Secondary reaction zone: 3,969
Key support zone: 3,945
Bearish pressure weakens above: 4,034
Trading plan
📉 Sell reaction scenario
If gold rejects from 4,028 - 4,034:
The descending channel structure remains active.
Sellers may try to push price toward 3,992.
If 3,992 fails, price may continue toward 3,969 and later 3,945.
For me, this scenario needs rejection confirmation first.
No rejection = no sell.
📈 Breakout scenario
If gold breaks and holds above 4,034:
The short setup becomes weaker.
Gold may try to escape the short reaction zone and build a stronger recovery.
A buy idea only becomes cleaner if price holds above 4,034 and confirms with a retest.
No confirmation = no trade.
📉 Deeper support scenario
If gold loses 3,992:
The correction may extend lower.
3,969 becomes the next reaction level.
If buyers still fail to defend that area, the key support zone around 3,945 becomes the main downside target.
Tiara’s View
Gold is bouncing, but the bounce is happening inside resistance.
That is why I do not want to call this bullish too early.
A recovery inside a descending channel can easily become a trap if buyers cannot reclaim the short zone.
For today, 4,028 - 4,034 is the key decision area.
If sellers defend it, the next move may be lower.
If buyers break it cleanly, the chart needs to be re-read.
Main view:
Gold stays cautious below 4,034.
4,028 - 4,034 is the trap zone to watch.
3,992, 3,969 and 3,945 are the downside reaction zones.
Reaction first.
Confirmation second.
Trade last.
No confirmation = no trade.
Do you think gold will reject from 4,034, or break out of this short zone?
━━━━━━━━━━━━━━━━━━━━━━━━━━━━━━
🌸 Tiara PrimeGold · XAUUSD · Price Action made simple
⚠️ Personal analysis only — not financial advice
━━━━━━━━━━━━━━━━━━━━━━━━━━━━━━
Tags:
Gold, XAUUSD, Price Action, Support and Resistance, Fibonacci, Descending Channel, Technical Analysis, Gold Analysis, Trading Plan
 Short
Short
XAUUSD: ABC Recovery Forming After Elliott DropGold is trying to recover after completing a sharp bearish Elliott wave sequence near the lower price area. From Kelly’s view, the market has already reacted from the recent low, but the current move still looks more like an ABC corrective recovery rather than a confirmed bullish reversal.
The key idea is simple: gold may continue to rebound in the short term, but the reaction around each resistance zone will decide whether buyers can keep control.
⟡ Market structure
The chart shows gold previously moved in a strong bearish sequence, creating lower highs and lower lows before reaching the final wave 5 area near the lower base. After that, price started to recover and is now forming a short-term ABC structure.
Price is currently trading around 4,027, close to the small sell zone near 4,038. If gold can hold above the buy wave C area around 4,011, the recovery may continue towards the higher reaction zones.
The important resistance above is the Elliott wave completed sell zone around 4,060–4,070. This is where buyers need to prove strength, because rejection from this area may bring another pullback.
➤ Key levels
◌ 4,011: buy wave C zone and short-term support
◌ 4,027: current reaction area
◌ 4,038: nearest sell zone
◌ 4,060–4,070: Elliott completed zone and main resistance
◌ 3,985–3,990: lower support if wave C fails
◌ Above 4,070: area where recovery gains stronger quality
⌁ Elliott Wave view
From an Elliott Wave perspective, gold appears to have completed a bearish 5-wave move near the lower low. After that, the market is now building an ABC correction.
Wave A created the first rebound from the low.
Wave B pulled back into the current structure.
Wave C may develop from the 4,011 area if buyers defend support.
If wave C holds and price breaks above 4,038, gold may continue towards 4,060–4,070. However, if price fails to hold 4,011, the ABC recovery weakens and gold may retest the lower base again.
▸ Trading scenario
Preferred scenario: wait for price to hold the buy wave C zone and show bullish confirmation.
Entry zone: 4,011–4,020 if bullish confirmation appears
Stop loss: below the confirmed wave C low
Take profit 1: 4,038
Take profit 2: 4,060–4,070
Take profit 3: 4,090 if momentum expands
Alternative scenario: if gold breaks below 4,011 and fails to reclaim this area, the ABC structure loses quality. In that case, price may return towards 3,985–3,990 before forming a new base.
⌁ Kelly’s view
For Kelly, this is a short-term ABC recovery setup after a completed bearish Elliott wave. The market is no longer in clean sell momentum at the low, but buyers still need to confirm strength through resistance.
The cleaner plan is to watch the reaction around 4,011 first. If buyers defend this zone, gold may continue recovering towards the sell zones above.
Gold is forming an ABC rebound.
If wave C holds, the next move may continue towards 4,038 and 4,060.
Share your view below. Long 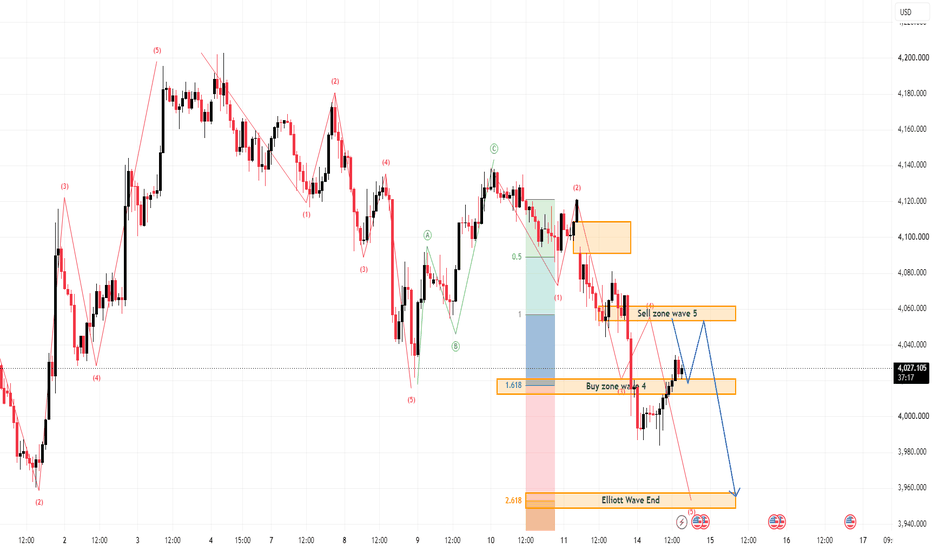
XAUUSD — Bearish Pressure Below Liquidity Sell Zone
Fundamental Analysis
Gold remains sensitive to USD momentum, Treasury yields, and upcoming U.S. macro data. For now, the market is still showing defensive price action, with sellers controlling the structure after price failed to hold above the previous trendline.
Technical Analysis
On the 1H chart, XAUUSD is trading around 4,026 after breaking below the short-term uptrend structure. The nearest reaction area is the liquidity buy scalping zone at 3,998 - 4,004, where price may create a short bounce. However, the main area to watch is 4,074 - 4,080. This zone aligns with previous liquidity, Fibonacci reaction, and the broken trendline retest. If gold recovers into this area and rejects, the bearish continuation setup remains valid toward the lower target around 3,890.
Important Key Levels
Current price: 4,026
Buy scalping zone: 3,998 - 4,004
Liquidity sell test zone: 4,074 - 4,080
Short-term resistance: 4,040 - 4,050
Main downside target: 3,890 - 3,885
Invalidation: above 4,080
Trading Scenario
Main Sell Setup
Entry: 4,074 - 4,080
Stop Loss: 4,105
Take Profit 1: 4,004
Take Profit 2: 3,950
Take Profit 3: 3,890 - 3,885
Sell Condition
Wait for gold to recover into the 4,074 - 4,080 liquidity sell test zone. A valid sell setup needs bearish rejection, such as a long upper wick, failed reclaim, bearish engulfing candle, or price closing back below the zone. If price rejects and breaks below 3,998 - 4,004, downside momentum may expand toward 3,950 and 3,890. If price breaks and holds above 4,080, the sell setup becomes weaker.
Overall View
The main view remains bearish while XAUUSD trades below the broken trendline and under the liquidity sell test zone. Gold may bounce first from 3,998 - 4,004, but the preferred plan is to wait for a cleaner sell reaction around 4,074 - 4,080 before looking for continuation toward the lower Fibonacci target.
Do you share the same bearish view on gold, or are you waiting for a stronger rejection from the 4,074 - 4,080 zone?
Short 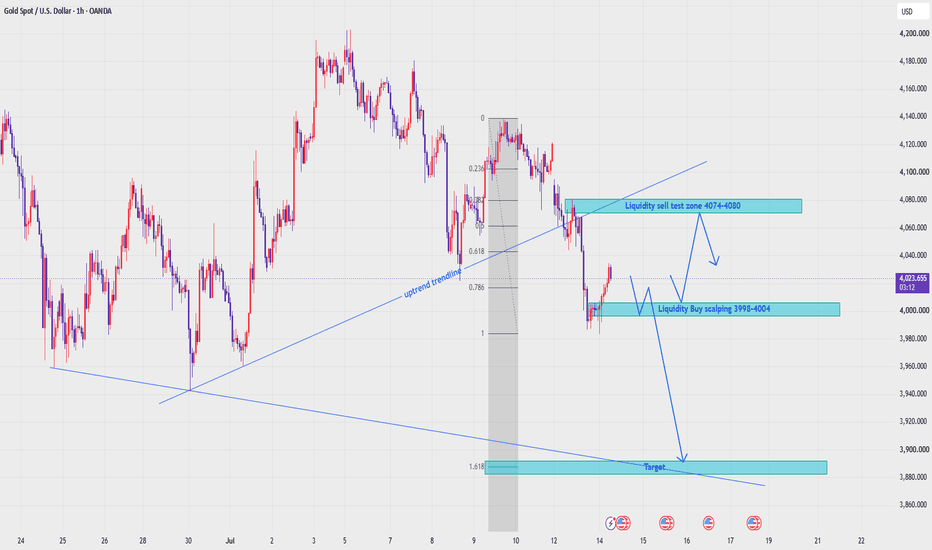
ICICI BankCMP: ~₹1,410
Immediate Support: ₹1,390
Major Support: ₹1,365–1,370
Strong Demand Zone: ₹1,330–1,340
Immediate Resistance: ₹1,430
Major Resistance: ₹1,470–1,500
Trading View
Bullish Scenario
Sustaining above ₹1,430 can trigger a move towards ₹1,470 and then ₹1,500.
Bearish Scenario
A break below ₹1,390 may lead to ₹1,365.
Below ₹1,365, the next support lies near ₹1,330.
Indicators
✅ Price is above the 20, 50, 100 and 200-day moving averages.
✅ RSI is in bullish territory (around 60), indicating positive momentum without being deeply overbought.
✅ Trend remains positive while the stock holds above the ₹1,365–1,390 support zone.
Swing Trading Plan
Buy Zone: ₹1,390–1,405 (on bullish reversal)
Breakout Buy: Above ₹1,430 with strong volume
Targets: ₹1,470 → ₹1,500
Stop Loss: Below ₹1,365 XAUUSD – Gold Is Bouncing, But The Downtrend Channel Still XAUUSD – Gold Is Bouncing, But The Downtrend Channel Still Controls Price
Gold is attracting some buyers in the Asian session, but the recovery still looks limited.
Price is currently trading around 4,030 after reacting from the lower area of the descending channel. This bounce shows that buyers are trying to defend the short-term low, but the bigger H1 structure is still moving inside a bearish channel.
For me, this is not a confirmed bullish reversal yet. It is a recovery into resistance.
FUNDAMENTAL ANALYSIS
Gold is receiving some short-term support as the U.S. dollar pauses after its recent strength. However, the market remains cautious ahead of key U.S. inflation data and Fed-related comments.
At the same time, rising geopolitical tension and expectations for a tighter Fed outlook may continue to support the U.S. dollar. This can limit gold’s upside and keep sellers active near resistance.
For now, the chart reaction around the sell zones is more important than chasing the rebound.
TECHNICAL ANALYSIS – SMC + MARKET STRUCTURE
From an SMC perspective, gold is still trading inside a clear descending channel. Price has been making lower highs, and every recovery has been limited by resistance inside the channel.
The current bounce from the lower channel area may continue toward 4,047. This level is important because it was a previous strong support and may now act as a sell reaction zone.
Above that, the stronger trendline sell area sits around 4,078. This zone aligns with the descending channel resistance and the marked sell trendline area on the chart. If gold reaches this area and shows rejection, sellers may regain control.
The FVG above price remains another important resistance zone. As long as gold stays below the FVG and below the descending trendline, the bearish structure remains valid.
KEY PRICE ZONES TO WATCH
Current price: 4,030
Short-term reaction area: 4,047
Strong support turned sell zone: 4,047
Sell trendline zone: 4,078
Strong resistance: 4,080
FVG resistance: 4,095 – 4,110
Lower channel target: 3,950 – 3,960
Main bearish continuation area: Below 4,000
Invalidation for bearish view: Above 4,080
TRADING SCENARIOS
Sell Scenario – Priority H1 View
If gold recovers into 4,047 – 4,078 and shows rejection, I will watch for bearish continuation inside the descending channel.
Sell Zone: 4,047 – 4,078
Entry: Bearish rejection, failed reclaim, lower-timeframe bearish CHoCH, or strong bearish displacement from resistance
SL: Above 4,080 or above the nearest swing high
TP1: 4,000
TP2: 3,960
TP3: 3,950
Alternative Sell Scenario
If gold breaks below 4,000 with strong momentum, sellers may continue directly toward the lower channel area.
Sell Condition: Clean break below 4,000, followed by retest and bearish confirmation
Target: 3,960 – 3,950
Buy Scenario – Only Short-Term Reaction
Buy is not the main view while gold stays inside the descending channel. However, if price holds above the current low and breaks above 4,047, a short-term recovery may continue toward the trendline.
Buy Zone: Above 4,047 after confirmation
Entry: Bullish breakout, retest, or lower-timeframe bullish CHoCH
TP1: 4,078
TP2: 4,095
Invalidation: If price fails to hold above 4,047, the buy reaction idea becomes weaker.
MY VIEW ON GOLD
My current view for gold remains bearish while price stays below 4,047 – 4,078.
The bounce is visible, but the chart still belongs to the descending channel. Buyers are trying to recover from the lower area, yet the real test is above. If gold reaches 4,047 or 4,078 and rejects, the sell continuation setup becomes much cleaner.
I do not want to chase price at the bottom, but I also do not want to call this bullish too early.
For now, gold is bouncing — but sellers still have the better structure unless price breaks above the trendline with strength.
Do you think gold will reject from 4,047 – 4,078, or can buyers finally break the descending channel?
Short 
 Long
Long
XAUUSD — Bearish Structure Holding Below Trendline
Gold is trading around $4,022 after rejecting from the short-term recovery area and moving back into the FVG sideways zone. The current structure remains bearish because price is still trading below the descending trendline, while the recent BOS confirms that sellers are still controlling the short-term direction.
From an SMC perspective, gold failed to build a strong bullish recovery after the previous downside move. Price rejected from the VL area, broke lower structure, and is now consolidating inside the FVG sideways area. This type of movement usually shows temporary accumulation before the next directional move, but as long as price stays below the OB + trendline sell zone, the main bias remains bearish.
The key area to watch is the sell zone around $4,065–$4,078. This zone aligns with the descending trendline and the previous supply reaction, making it the main area where sellers may defend the structure again. If gold pulls back into this zone and forms bearish rejection, another downside continuation toward the day low around $3,984 and the strong low near $3,942 remains possible.
Sell setup 1
Condition:
Gold pulls back into the OB + trendline sell zone around $4,065–$4,078 and forms bearish rejection with lower timeframe MSS / CHOCH.
Entry: $4,065–$4,078
SL: above $4,100
TP1: $4,040
TP2: $4,000
TP3: $3,984
TP4: $3,942
Sell setup 2
Condition:
If gold breaks below the FVG sideways area and retests it as resistance, bearish continuation remains valid without waiting for a deeper pullback.
Entry: below $4,015 after breakdown retest
SL: above $4,040
TP1: $4,000
TP2: $3,984
TP3: $3,960
TP4: $3,942
Sell setup 3
Condition:
If gold sweeps above the FVG sideways area but fails to break the trendline, this can create a liquidity-trap sell setup.
Entry: after rejection below $4,065–$4,078
SL: above the sweep high
TP1: $4,022
TP2: $4,000
TP3: $3,984
Buy scalping setup
Condition:
Buying is not the main priority. A buy scalp is only valid if gold sweeps the day low around $3,984 and forms a strong bullish rejection.
Entry: $3,984 after bullish rejection
SL: below $3,960
TP1: $4,000
TP2: $4,022
TP3: $4,040
Key levels
Current price area: $4,022
FVG sideways area: $4,015–$4,040
OB + trendline sell zone: $4,065–$4,078
VL reaction area: $4,095–$4,110
Day low liquidity: $3,984
Strong low liquidity: $3,942
Bearish continuation confirmation: clean break below $4,015
Stronger bearish confirmation: clean break below $3,984
Bearish invalidation: clean 2H close above $4,100
My current view is that gold remains in a bearish structure while price stays below the descending trendline and the OB sell zone. The Prime Gold plan is to avoid buying too early inside the FVG sideways area and wait for either a pullback into $4,065–$4,078 or a clean breakdown below $4,015 before looking for sell confirmation. If sellers continue to defend the trendline, gold may extend lower toward $3,984 and potentially $3,942.
No confirmation, no trade.
Short 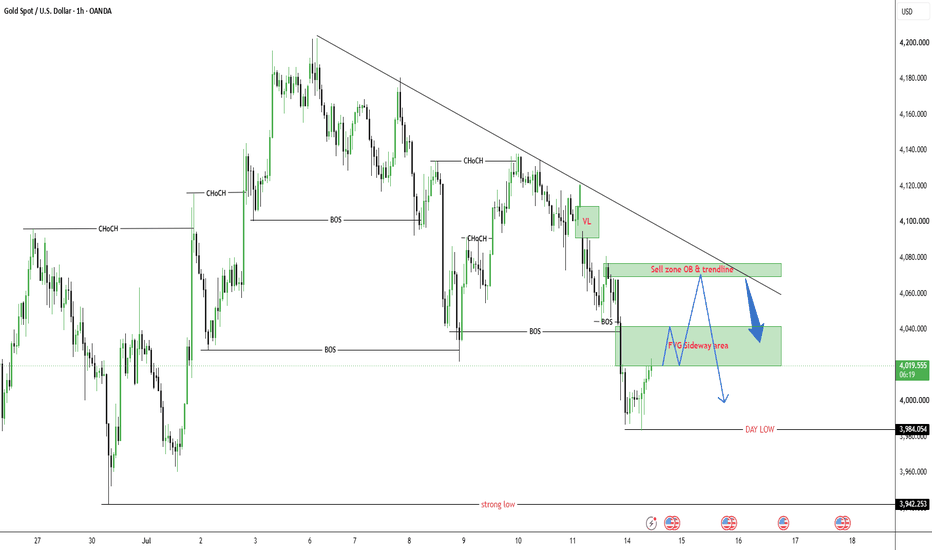
XAUUSD — Bearish Structure, Sell Around OBXAUUSD — Bearish Structure, Sell Around OB
Gold is trading around $4,057 after breaking down from the short-term recovery structure. Price has rejected from the upper reaction area and is now pressing directly into the sell-side liquidity around $4,055, showing that sellers are still controlling the current structure.
From an SMC perspective, gold has already shown a bearish shift after failing to hold the previous bullish recovery. The recent move created weakness below the local BOS area, then price dropped strongly into the lower liquidity zone. As long as gold stays below the $4,078–$4,085 OB sell zone and below the $4,121 buy-side liquidity area, the main structure remains bearish.
The main plan is to avoid buying too early while price is still under the OB zone. If gold pulls back into $4,078–$4,085 and forms bearish rejection, this area can act as the key sell zone before another downside continuation toward the buy scalping liquidity around $4,020–$4,030 and the lower OB zone near $3,960–$3,975.
Sell setup 1
Condition:
Gold pulls back into the OB sell zone around $4,078–$4,085 and forms bearish rejection with lower timeframe MSS / CHOCH.
Entry: $4,078–$4,085
SL: above $4,105
TP1: $4,055
TP2: $4,020–$4,030
TP3: $3,975
TP4: $3,960
Sell setup 2
Condition:
If gold breaks cleanly below $4,055 and retests this level as resistance, bearish continuation remains valid without waiting for a deeper pullback.
Entry: below $4,055 after breakdown retest
SL: above $4,078
TP1: $4,030
TP2: $4,020
TP3: $3,975
TP4: $3,960
Sell setup 3
Condition:
If gold sweeps back above the OB zone but fails to reclaim $4,121, this can create a stronger liquidity-trap sell setup.
Entry: after rejection below $4,121
SL: above $4,135
TP1: $4,078
TP2: $4,055
TP3: $4,020–$4,030
Buy scalping setup
Condition:
Buying is not the main priority. A buy scalp is only valid if gold sweeps the $4,020–$4,030 liquidity zone and forms a strong bullish rejection.
Entry: $4,020–$4,030 after bullish rejection
SL: below $4,000
TP1: $4,055
TP2: $4,078–$4,085
TP3: $4,105
Key levels
Current price area: $4,057
Immediate sell-side liquidity: $4,055
OB sell zone: $4,078–$4,085
VL reaction zone: $4,090–$4,105
Buy-side liquidity: $4,121
Buy scalping liquidity: $4,020–$4,030
Lower OB target zone: $3,960–$3,975
Major upper liquidity: $4,221
Bearish continuation confirmation: clean break below $4,055
Stronger bearish confirmation: clean break below $4,020
Bearish invalidation: clean 2H close above $4,121
My current view is that gold remains in a bearish structure while price stays below the OB sell zone. The Prime Gold plan is to wait for a pullback into $4,078–$4,085 or a clean breakdown below $4,055 before looking for sell confirmation. If sellers continue to defend the OB, gold may extend lower toward $4,020–$4,030 and potentially $3,960–$3,975.
No confirmation, no trade.
Short 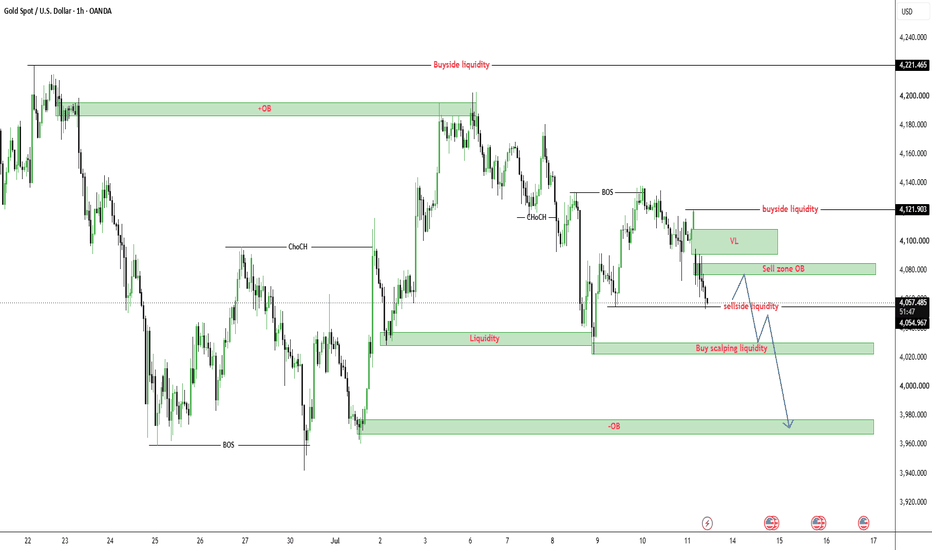
XAUUSD: Weak Bounce, Sellers Still Control XAUUSD: Weak Bounce, Sellers Still Control
Market Context
Gold is attracting some buyers in the Asian session, but the rebound still looks limited. The US Dollar has paused after a two-day recovery, while traders are waiting for the US CPI report and Fed Chair Warsh’s testimony.
At the same time, rising US-Iran tension and expectations that the Fed may keep a restrictive policy tone continue to support the USD. This can limit upside momentum for gold, even if price creates a short-term bounce.
The main story is simple: gold is bouncing, but the structure is still weak. Buyers need more than one reaction candle to prove control.
Technical Structure
Gold is trading around 4,015 after clearing the weak low and rebounding slightly. The short-term move shows a reaction from the lower area, but the broader structure still leans bearish.
The nearest support is around 3,959 - 3,990. If this area holds, gold may continue a technical rebound toward the FVG rebalance zone around 4,060 - 4,080.
Above that, the 4,100 - 4,120 area is the internal liquidity zone. This is where sellers may start reacting again if the rebound loses momentum.
The stronger resistance remains higher at the Main Sell POI and Premium Supply area around 4,160 - 4,200. As long as price stays below this zone, the recovery should still be treated as corrective.
Key Levels
Current Price: 4,015
Near Support: 3,959 - 3,990
FVG Rebalance Zone: 4,060 - 4,080
Internal Liquidity: 4,100 - 4,120
Main Sell POI: 4,160 - 4,180
Premium Supply: 4,180 - 4,200
Bullish Confirmation: Above 4,120
Bearish Continuation: Below 3,959
Trading Plan
Buy Scenario: Technical Rebound
Entry: Above 4,020 after bullish confirmation
Stop Loss: Below 3,990
TP1: 4,060
TP2: 4,080
TP3: 4,100
Conditions: Price must hold above the weak low area, reclaim 4,020 with strength, and form a clear bullish reaction on the lower timeframe. This is only a corrective rebound setup, not a full trend reversal.
Sell Scenario: Rejection From FVG
Entry: 4,060 - 4,080 after bearish confirmation
Stop Loss: Above 4,100
TP1: 4,020
TP2: 3,990
TP3: 3,959
Conditions: Price rebounds into the FVG rebalance zone but fails to continue higher. Bearish rejection appears, buyers lose momentum, and price starts forming lower highs again.
Alternative Sell Scenario: Sell From Internal Liquidity
Entry: 4,100 - 4,120 after bearish confirmation
Stop Loss: Above 4,140
TP1: 4,080
TP2: 4,020
TP3: 3,990
Conditions: Price sweeps into internal liquidity but cannot hold above 4,120. Strong rejection from this area would confirm that sellers are still defending the short-term bearish structure.
Breakdown Sell
Entry: Below 3,959 after confirmed breakdown and retest
Stop Loss: Above 3,990
TP1: 3,930
TP2: 3,900
TP3: 3,880
Conditions: Price loses the lower support zone, retest fails, and bearish momentum continues. This would confirm that the small rebound has failed and gold may extend toward deeper demand.
Overall Bias
Gold is showing a short-term bounce, but the main structure remains weak. The rebound can continue toward 4,060 - 4,080, but buyers still need to reclaim 4,100 - 4,120 to shift the tone.
If price rejects from the FVG or internal liquidity zone, sellers may push gold back toward 3,990 and 3,959. A break below 3,959 would open the door for a deeper downside move.
Best approach: wait for confirmation. Do not chase the bounce while gold remains below the main sell zones.
Will gold reclaim 4,120, or will sellers use this bounce to continue the decline?
Short 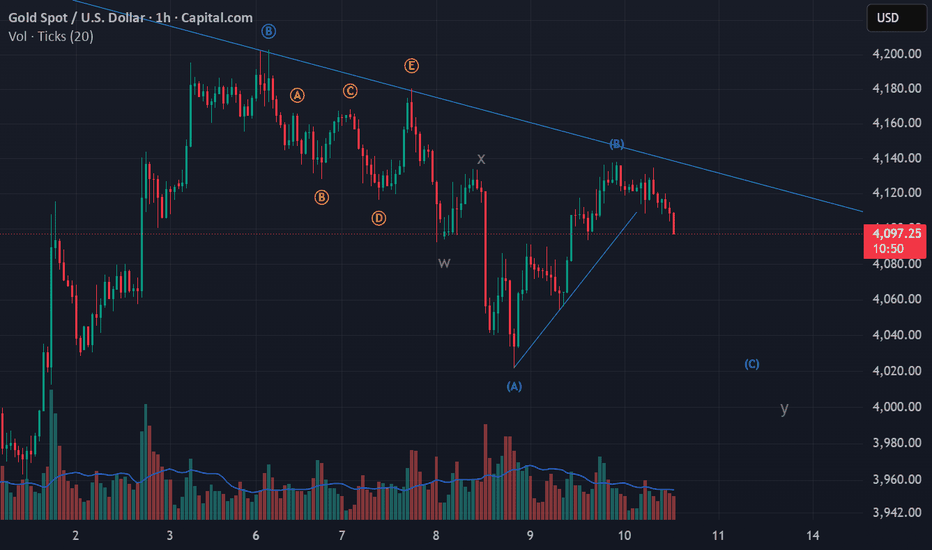
NIFTY : Trading levels and Plan for 14-Jul-2026Previous Close: 24,208.60 | Instrument: NIFTY 50 Index (Spot/Options)
Namaste Traders! 🙏 Here's my structured educational trading plan covering all three opening scenarios for tomorrow's session. Please treat this as a study framework to understand price action around key levels — not a buy/sell recommendation.
🟠 Note on Chart Lines: The Orange Zone (24,242–24,276) represents the "No-Trade / Sideways Zone" — price often chops here before choosing direction. Green = Bullish/Long bias. Red = Bearish/Short bias. Dashed lines = Probable/Unconfirmed trend (wait for confirmation).
🟢 SCENARIO 1: GAP UP OPENING (100+ points, i.e., open above 24,308)
📈 A gap-up of 100+ points shows strong overnight positive sentiment (global cues/FII flows). But remember — gap-ups often get "filled" or tested before continuation, so patience is key.
🟢 Bullish Continuation Plan:
⁘ If Nifty opens above 24,308 and sustains above 24,375 (Last Intraday Resistance) with strong volume, treat it as a breakout confirmation.
⁘ Entry: On a 15-min candle close above 24,375.
⁘ Target 1: 24,420 | Target 2: 24,461 (Extended Resistance).
⁘ Stop Loss: Below 24,320 (re-entry into opening zone invalidates breakout).
🔴 Gap-Up Reversal/Fade Plan (Dashed/Cautious):
⁘ If price opens with gap-up but immediately faces rejection near 24,375–24,400 and starts forming red candles, watch for a fade back into the Opening S/R zone (24,242–24,276).
⁘ This is a "maybe" scenario — confirm with a lower-high structure before shorting.
⁘ Target: 24,276 → 24,242. SL: Above the day's high.
⁘ ⁘ ⁘
💡 Action Tip: Never chase a gap-up directly. Let the first 15–30 mins candle close to confirm direction. Avoid buying naked calls right at open — IV crush + reversal risk is high.
🟡 SCENARIO 2: FLAT OPENING (within Opening S/R Zone: 24,242 – 24,276)
⚖️ A flat opening within this orange zone means the market is undecided. This is the "No-Trade Zone" — best approach is to wait and watch, not to force a trade.
🟠 Range-Bound Approach:
⁘ As long as price oscillates between 24,164 (Opening Support) and 24,276 (Opening Resistance), avoid directional option buying.
⁘ Best strategy here: Iron Condor / Short Straddle (for experienced traders only) to capture theta decay in sideways market.
🟢 Breakout Above Zone (Bullish Trigger):
⁘ Sustained move & candle close above 24,276 → opens door to 24,375 (Last Intraday Resistance).
⁘ Entry: Above 24,280 with volume confirmation.
⁘ SL: 24,242 (back inside zone = invalid).
🔴 Breakdown Below Zone (Bearish Trigger):
⁘ Candle close below 24,242 → 24,164 → 24,032 (Last Intraday Support) becomes the target zone.
⁘ Entry: Below 24,235.
⁘ SL: 24,276 (back inside zone = invalid).
⁘ ⁘ ⁘
💡 Action Tip: Flat opens are trap-prone. Wait for a clean breakout/breakdown candle with volume before entering options. Avoid FOMO trades in the first 15 minutes.
🔴 SCENARIO 3: GAP DOWN OPENING (100+ points, i.e., open below 24,108)
📉 A gap-down of 100+ points signals negative overnight sentiment. Similar to gap-ups, the first reaction (fill vs. continuation) determines the day's trend.
🔴 Bearish Continuation Plan:
⁘ If Nifty opens below 24,108 and sustains below 24,032 (Last Intraday Support) on a 15-min close, treat it as breakdown confirmation.
⁘ Entry: Below 24,032.
⁘ Target 1: 23,970 | Target 2: 23,902 (Extended Support).
⁘ Stop Loss: Above 24,080 (recovery back into support zone invalidates breakdown).
🟢 Gap-Down Recovery/Fade Plan (Dashed/Cautious):
⁘ If gap-down finds buyers early and starts reclaiming levels, watch for a pullback rally toward Opening S/R zone (24,164–24,242).
⁘ Confirm with higher-low structure before going long — this is a "maybe" reversal, not guaranteed.
⁘ Target: 24,164 → 24,242. SL: Below the day's low.
⁘ ⁘ ⁘
💡 Action Tip: In gap-down sessions, avoid panic-selling puts blindly. Wait for the first pullback/retest to gauge real strength of sellers before committing capital.
🛡️ OPTIONS TRADING — RISK MANAGEMENT TIPS
⁘ 🎯 Position Sizing: Never risk more than 2% of your capital on a single options trade.
⁘ ⏱️ Time Decay Awareness: Avoid buying far OTM options intraday — theta decay can eat profits even if direction is right.
⁘ 🚫 No Averaging on Losing Trades: If SL is hit, exit. Don't average down on options — it's not the same as equity.
⁘ 📉 IV Check: Before buying options, check India VIX — high IV can lead to premium crush post-move even if direction is correct.
⁘ 🔔 Use Alerts, Not Emotions: Set price alerts at key levels rather than staring at charts all day.
⁘ 💰 Book Partial Profits: Scale out at Target 1, trail SL to cost for the remaining position at Target 2.
⁘ 🕐 Avoid First 15 Minutes: Volatility is highest at open; let structure form before entering.
📝 SUMMARY & CONCLUSION
Tomorrow's session hinges on how price behaves around the Opening S/R zone (24,242–24,276).
⁘ A sustained move above 24,375 opens bullish targets toward 24,461.
⁘ A sustained move below 24,032 opens bearish targets toward 23,902.
⁘ Flat/range-bound action within the zone favors patience and non-directional strategies.
Across all scenarios, the golden rule remains: confirmation before entry, and strict stop-loss discipline. Markets reward patience, not predictions. 🧘♂️📚
⚠️ DISCLAIMER: I am not a SEBI registered analyst. This post is purely for educational purposes to help traders understand price structure, support/resistance behavior, and risk management concepts. This is not investment advice. Please consult a registered financial advisor and do your own research (DYOR) before making any trading/investment decisions. Trading in equities and options involves substantial risk of loss.
📚 Happy Learning & Trade Safe! 🙏  Long
Long
Balaji Amines @ 52W High, What next is visible on Charts ....???Balaji Amines CMP: 2043.30
Balaji Amines has staged an impressive ~96% rally over the last three months and is currently trading near its 52-week high. While the price action remains bullish, investors should expect higher volatility after such a sharp move.
The bullish view remains valid as long as the stock sustains above the key breakout zone of ₹1,950–2,000. Holding this zone could pave the way for the next leg of the uptrend over the coming months.
Elliott Wave Perspective
Weekly Chart:
The broader structure appears to be in an ABC corrective pattern, with Wave A currently under formation. This suggests that the stock may still have room to extend higher before a larger corrective phase emerges.
Daily Chart:
On the daily timeframe, the stock appears to be in a Wave 3 expansion phase, typically the strongest and most dynamic segment of an Elliott Wave cycle.
Interestingly, both the weekly and daily wave structures converge on similar upside projections, indicating potential targets around:
₹2,300
₹2,450–2,500
Key Levels to Watch
Preferred Entry: ₹1,980–2,020 on a pullback, offering a favorable risk-reward setup.
Immediate Resistance: ₹2,150–2,185. A decisive breakout above this zone could accelerate momentum toward higher targets.
Invalidation Level: ₹1,930. A close below this level would weaken the bullish structure and indicate a failed breakout.
Conclusion :
The stock remains technically strong, supported by both breakout price action and Elliott Wave analysis. While the near-term trend remains bullish, the sustainability of the move depends on holding the ₹1,950–2,000 support zone. If that support holds, the path toward ₹2,300 and eventually ₹2,450–2,500 remains open.  Education

Education

Education

 Long
Long
 Long
Long
 Long
Long
Every Trader Is a Piece in the GameIf the Market Were a Chess Game: (From my weekend thoughts)
When people think about trading, they often imagine numbers, charts, and indicators. But what if the market could be explained through a game that has existed for centuries? Chess and trading have more in common than most people realize. Neither game is won by making random moves or reacting emotionally. Success comes from patience, planning, and thinking several steps ahead. Every move has a purpose, every mistake has a consequence, and every decision changes the position of the game.
The Board:
Every chess match begins with the same board, but no two games are ever identical. Trading works in much the same way. Every trader looks at the same chart, yet everyone sees different opportunities. Support and resistance, trends, and important price levels become the squares where the battle between buyers and sellers takes place. Before a grandmaster makes a move, they study the entire board. Similarly, successful traders study the market before placing a trade instead of reacting to every candle they see.
The Pawns:
In chess, pawns are the most common pieces. Individually they are weak, but together they control space and influence the entire game. Retail traders often play a similar role in the market. Many buy after a breakout, panic during pullbacks, or place stop losses in obvious locations. On their own, these decisions may seem insignificant, but together they create the liquidity that drives the market. Without pawns, chess cannot be played. Without retail traders, financial markets would not have the same flow of orders.
The Queen:
The queen is the strongest piece on the chessboard. It can move in almost any direction and is often responsible for controlling the game. In trading, large institutions, banks, and hedge funds play a similar role. They have more capital, more information, and greater influence than individual traders. They do not enter trades based on emotions or simple indicators. Instead, they plan their moves carefully, looking for areas where enough liquidity exists to execute large orders. While retail traders often react to price, institutions are capable of creating the moves that everyone else reacts to.
Board Control:
One of the biggest mistakes beginners make in chess is focusing only on capturing pieces. Experienced players know that controlling the board is far more important than winning a single exchange. Trading follows the same principle. Many new traders spend their time trying to predict every reversal, while experienced traders focus on trading in the direction of the trend. A strong trend represents control. During an uptrend, buyers dominate the market. During a downtrend, sellers are in control. Trading against that control is often like attacking a well-defended king with only a single pawn.
Sacrifice:
Every great chess player understands that sometimes giving up a piece leads to a much greater advantage later in the game. The same idea exists in trading. Professional traders never expect to win every trade. They accept small losses because they understand that protecting their capital is more important than protecting their ego. A controlled loss is simply the cost of staying in the game. The traders who refuse to accept small losses often end up facing much larger ones.
Checkmate:
The ultimate goal in chess is not to capture every piece but to put your opponent in a position where no escape is possible. In trading, liquidity often plays a similar role. Price frequently moves toward areas where large numbers of stop losses and pending orders are placed. Many traders believe the market is hunting their stop loss, but in reality, it is searching for enough orders to fuel the next move. Once that liquidity has been collected, the market often continues in its intended direction.
What I think is...
Trading and chess share one important lesson. The winner is rarely the person who acts the fastest. It is usually the person who understands the position better than everyone else. Both reward patience over excitement, planning over guessing, and discipline over emotion. The next time you open a chart, imagine you are sitting in front of a chessboard. Instead of asking where price will go next, ask yourself one simple question.
Who controls the board right now?
That single question may change the way you look at the market forever.
By @BrightRally_Research on @TradingView
 Education
 Long
Long
Long 
 Long
Long
Bajaj FinanceCurrent trend: Bullish to Neutral. The stock is trading above most key moving averages, indicating the medium-term trend remains positive, although short-term resistance needs to be cleared for fresh momentum.
Key Support Levels
₹1,013–1,005 – Immediate support
₹995–990 – Strong buying zone
₹975 – Major positional support
Key Resistance Levels
₹1,025–1,035 – Immediate resistance
₹1,050 – Breakout confirmation level
₹1,080–1,100 – Major swing target zone
Trading View
Bullish Scenario
Sustaining above ₹1,025–1,035 can trigger a move towards ₹1,050, followed by ₹1,080–1,100.
Bearish Scenario
A breakdown below ₹995 may lead to ₹975, with further weakness possible if that level fails.
Momentum
RSI is around 56–59, indicating positive momentum without being extremely overbought.
Most moving averages remain on Buy/Strong Buy, supporting the broader uptrend.
Trading Plan
Buy on breakout: Above ₹1,035
Targets: ₹1,050 → ₹1,080 → ₹1,100
Stop-loss: Below ₹995 (adjust based on your risk tolerance)


