Long
Long
Every Trader Is a Piece in the GameIf the Market Were a Chess Game: (From my weekend thoughts)
When people think about trading, they often imagine numbers, charts, and indicators. But what if the market could be explained through a game that has existed for centuries? Chess and trading have more in common than most people realize. Neither game is won by making random moves or reacting emotionally. Success comes from patience, planning, and thinking several steps ahead. Every move has a purpose, every mistake has a consequence, and every decision changes the position of the game.
The Board:
Every chess match begins with the same board, but no two games are ever identical. Trading works in much the same way. Every trader looks at the same chart, yet everyone sees different opportunities. Support and resistance, trends, and important price levels become the squares where the battle between buyers and sellers takes place. Before a grandmaster makes a move, they study the entire board. Similarly, successful traders study the market before placing a trade instead of reacting to every candle they see.
The Pawns:
In chess, pawns are the most common pieces. Individually they are weak, but together they control space and influence the entire game. Retail traders often play a similar role in the market. Many buy after a breakout, panic during pullbacks, or place stop losses in obvious locations. On their own, these decisions may seem insignificant, but together they create the liquidity that drives the market. Without pawns, chess cannot be played. Without retail traders, financial markets would not have the same flow of orders.
The Queen:
The queen is the strongest piece on the chessboard. It can move in almost any direction and is often responsible for controlling the game. In trading, large institutions, banks, and hedge funds play a similar role. They have more capital, more information, and greater influence than individual traders. They do not enter trades based on emotions or simple indicators. Instead, they plan their moves carefully, looking for areas where enough liquidity exists to execute large orders. While retail traders often react to price, institutions are capable of creating the moves that everyone else reacts to.
Board Control:
One of the biggest mistakes beginners make in chess is focusing only on capturing pieces. Experienced players know that controlling the board is far more important than winning a single exchange. Trading follows the same principle. Many new traders spend their time trying to predict every reversal, while experienced traders focus on trading in the direction of the trend. A strong trend represents control. During an uptrend, buyers dominate the market. During a downtrend, sellers are in control. Trading against that control is often like attacking a well-defended king with only a single pawn.
Sacrifice:
Every great chess player understands that sometimes giving up a piece leads to a much greater advantage later in the game. The same idea exists in trading. Professional traders never expect to win every trade. They accept small losses because they understand that protecting their capital is more important than protecting their ego. A controlled loss is simply the cost of staying in the game. The traders who refuse to accept small losses often end up facing much larger ones.
Checkmate:
The ultimate goal in chess is not to capture every piece but to put your opponent in a position where no escape is possible. In trading, liquidity often plays a similar role. Price frequently moves toward areas where large numbers of stop losses and pending orders are placed. Many traders believe the market is hunting their stop loss, but in reality, it is searching for enough orders to fuel the next move. Once that liquidity has been collected, the market often continues in its intended direction.
What I think is...
Trading and chess share one important lesson. The winner is rarely the person who acts the fastest. It is usually the person who understands the position better than everyone else. Both reward patience over excitement, planning over guessing, and discipline over emotion. The next time you open a chart, imagine you are sitting in front of a chessboard. Instead of asking where price will go next, ask yourself one simple question.
Who controls the board right now?
That single question may change the way you look at the market forever.
By @BrightRally_Research on @TradingView
 Education
 Long
Long
 Long
Long
 Long
Long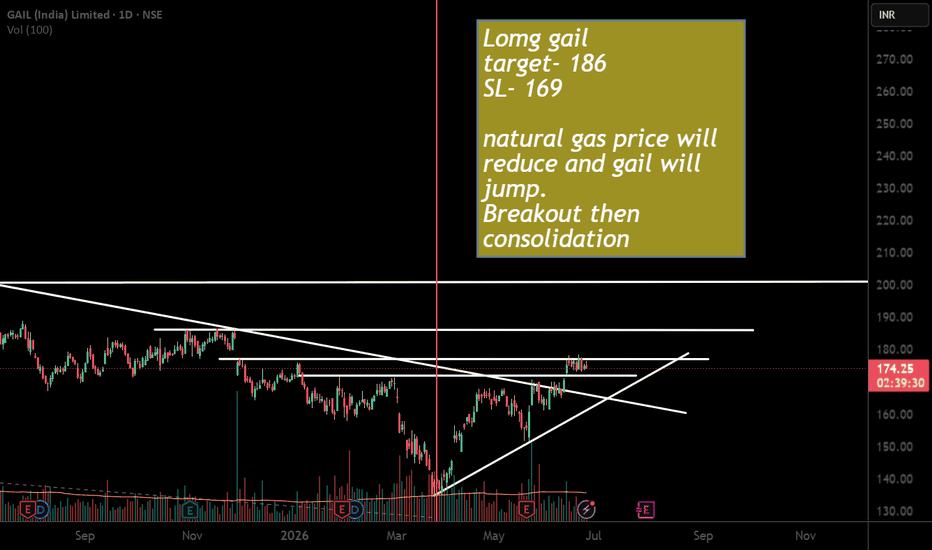
Bajaj FinanceCurrent trend: Bullish to Neutral. The stock is trading above most key moving averages, indicating the medium-term trend remains positive, although short-term resistance needs to be cleared for fresh momentum.
Key Support Levels
₹1,013–1,005 – Immediate support
₹995–990 – Strong buying zone
₹975 – Major positional support
Key Resistance Levels
₹1,025–1,035 – Immediate resistance
₹1,050 – Breakout confirmation level
₹1,080–1,100 – Major swing target zone
Trading View
Bullish Scenario
Sustaining above ₹1,025–1,035 can trigger a move towards ₹1,050, followed by ₹1,080–1,100.
Bearish Scenario
A breakdown below ₹995 may lead to ₹975, with further weakness possible if that level fails.
Momentum
RSI is around 56–59, indicating positive momentum without being extremely overbought.
Most moving averages remain on Buy/Strong Buy, supporting the broader uptrend.
Trading Plan
Buy on breakout: Above ₹1,035
Targets: ₹1,050 → ₹1,080 → ₹1,100
Stop-loss: Below ₹995 (adjust based on your risk tolerance) XAUUSD: Bearish Elliott Wave Indicates Fibonacci TargetsGold is moving under renewed downside pressure after failing to hold the recovery structure above the 4,100 area. From Kelly’s view, the current chart suggests that a bearish Elliott wave sequence is developing, and price may continue lower if the sell zone remains defended.
The key idea is simple: gold is still weak below resistance, and the next downside targets are now guided by the Fibonacci structure.
⟡ Market structure
The chart shows gold rejected from the upper recovery area and started forming lower highs again. Price is now trading near 4,055, directly under the sell wave 5 zone, which makes this area very important for the next reaction.
The nearest resistance sits around 4,055–4,060. If gold cannot reclaim this zone with strength, sellers may continue to control the short-term structure.
Below current price, the chart highlights the 4,015–4,025 area as the next wave 4 reaction zone. If that support fails, the larger Elliott Wave End area around 3,950–3,960 becomes the main downside target.
➤ Key levels
◌ 4,055–4,060: sell wave 5 zone and current resistance
◌ 4,015–4,025: buy zone wave 4 / first downside reaction area
◌ 3,950–3,960: Elliott Wave End and Fibonacci 2.618 target zone
◌ 4,090–4,105: upper resistance if price rebounds
◌ Above 4,105: area where the bearish wave count weakens
⌁ Elliott Wave view
From an Elliott Wave perspective, gold appears to be building a bearish 5-wave structure after completing the previous corrective rebound.
Wave 1 created the first downside move from the recent high.
Wave 2 corrected upward but failed to continue higher.
Wave 3 pushed price lower with stronger momentum.
Wave 4 may form around 4,015–4,025 as a temporary reaction.
If the sell wave 5 zone continues to hold, wave 5 may extend towards the Fibonacci 2.618 target near 3,950–3,960.
This is why Kelly would treat the current rebound carefully. As long as price remains below resistance, the structure still favours a continuation lower.
▸ Trading scenario
Preferred scenario: wait for price to reject from the 4,055–4,060 sell zone before expecting downside continuation.
Sell zone: 4,055–4,060 if bearish confirmation appears
Stop loss: above 4,105 or above the confirmed rejection high
Take profit 1: 4,015–4,025
Take profit 2: 3,980
Take profit 3: 3,950–3,960
Alternative scenario: if gold breaks above 4,105 and holds with strong acceptance, the bearish Elliott setup weakens. In that case, price may need to rebuild a new structure before the next direction becomes clearer.
⌁ Kelly’s view
For Kelly, this is still a bearish Elliott structure. Gold has not shown enough strength to confirm a bullish reversal, and the market is now reacting under an important sell zone.
The cleanest plan is to follow the Fibonacci roadmap and wait for confirmation from resistance.
Gold remains under pressure.
If the sell zone holds, the next bearish wave may continue towards the Fibonacci targets below.
Share your view below.  Short
Short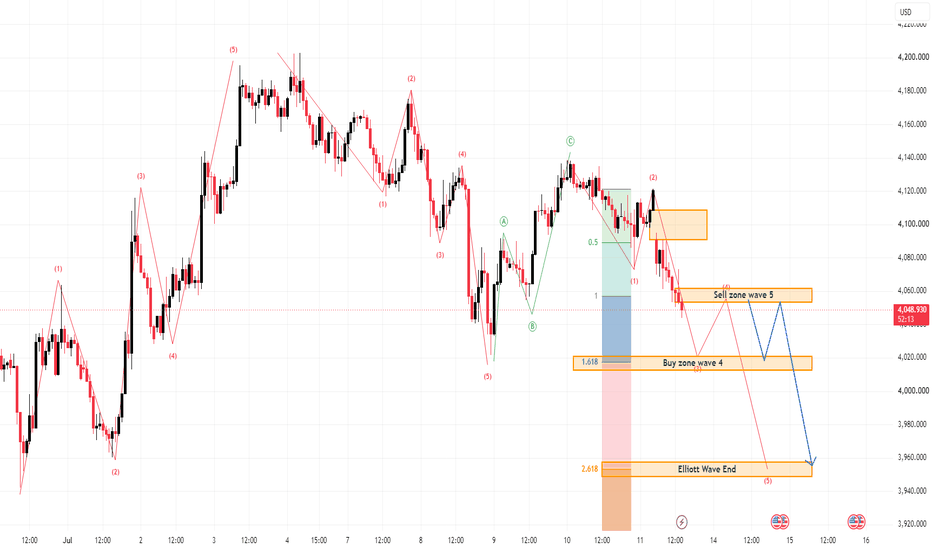
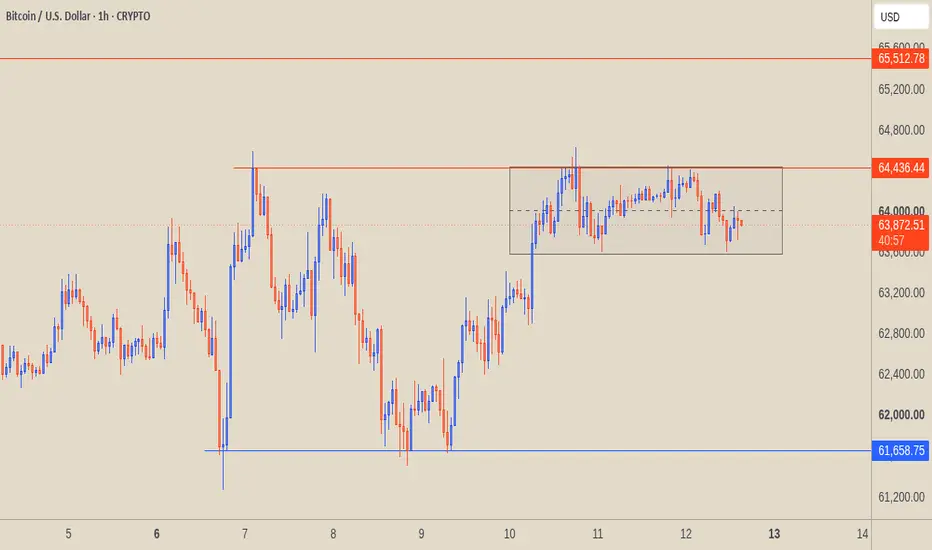
Bitcoin Consolidation Phase: Mapping the Next MoveKey Support and Resistance Levels
Major Support (Blue Line - 61,658.75): This is a critical structural low. The price saw a sharp rejection (long lower wick) at this level around the 6th/7th, establishing it as a strong demand zone. A subsequent higher low formed around the 9th, confirming this blue line as the foundational support for the current market structure.
Immediate Resistance (Lower Red Line - 64,436.44): This level previously acted as a local top. The price rallied aggressively from the lows to test this pivot, but was rejected, turning this line into a clear ceiling for the current price action.
Major Target Resistance (Upper Red Line - 65,512.78): If the bullish structure continues and breaks current resistance, this upper pivot serves as the next major structural target and liquidity zone.
Consolidation Box Analysis
The shaded rectangle highlights a distinct period of range-bound price action following the recent impulsive move upward.
Range Dynamics: The market is currently in a "choppy" sideways phase, digesting the recent gains. The box maps the boundaries of this consolidation, with the top anchored precisely at the 64,436.44 resistance level and the bottom near 63,600.00.
Equilibrium (Dashed Midline): The dashed line in the center of the box (around 64,000) represents the mean of this value area.
Current Price Action: The price (63,872.07) is currently hovering just below this dashed midline. This indicates slight local weakness within the range, as bears are defending the upper half of the box, pushing the price toward the lower boundary.
Structural Outlook
The current structure is a classic consolidation pattern following a strong bounce from major support. The next directional bias depends heavily on how the price interacts with the boundaries of the drawn box:
Bullish Breakout Scenario: A decisive 1h candle close above the top of the box (64,436.44) would confirm a continuation of the bullish market structure. This would likely trigger upward momentum toward the next major pivot at 65,512.78.
Bearish Breakdown Scenario: If the price loses the bottom of the box (around 63,600.00), the consolidation fails. This would signal a deeper retracement, likely sweeping liquidity lower to test the mid-62,000s or eventually retesting the ultimate major support at 61,658.75. Short 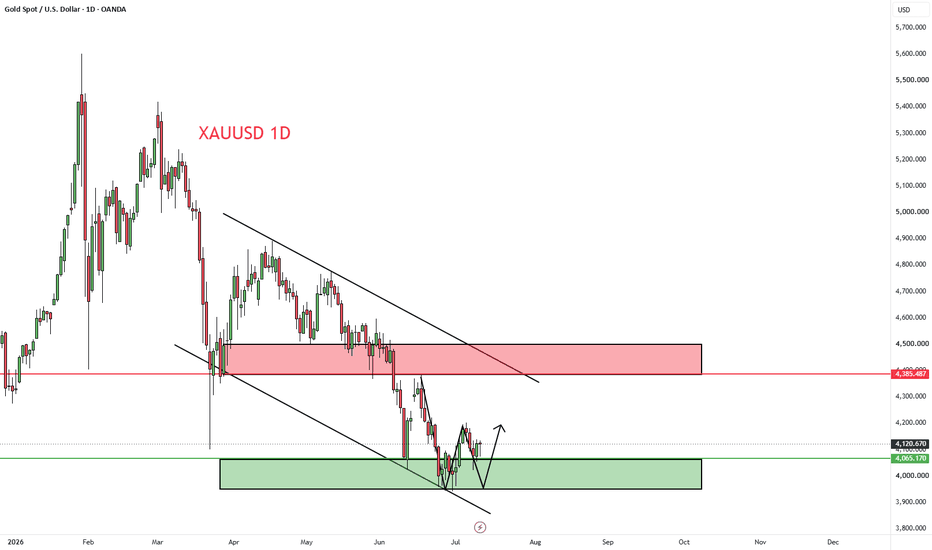
 Long
Long
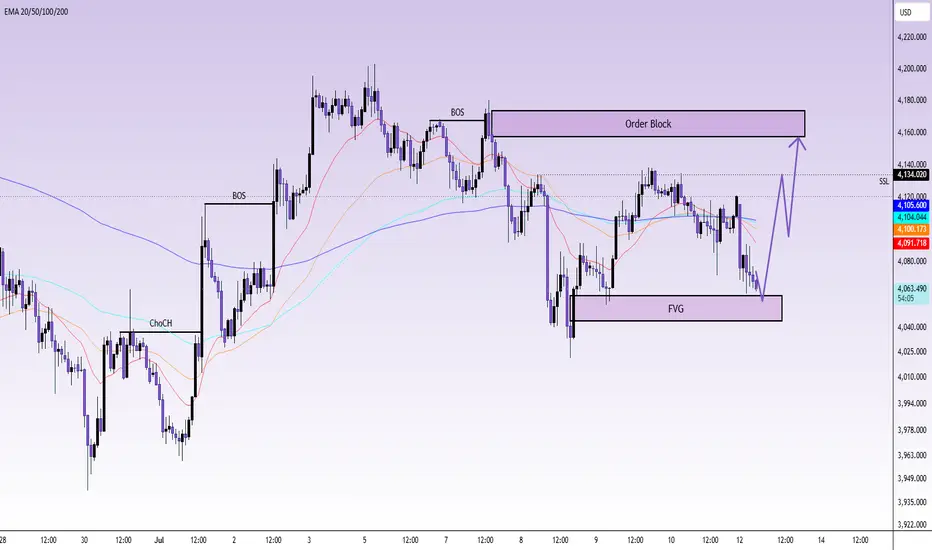
XAUUSD 4057 FVG sweep — 4134 nextXAUUSD 4057 FVG sweep — 4134 next
That dump under 4,100 looks nasty. But this is exactly where I don’t want to chase late shorts.
Gold lost the 4,100 handle early, yeah. Macro is heavy too. US-Iran tension, stronger USD, oil/inflation fear, Fed warning noise. All of that keeps pressure on gold.
But chart-wise? Price is already sitting right above the FVG around 4,057 - 4,065. That’s the discount pocket.
This is where a trap can form.
Sellers already pushed price below the EMA cluster around 4,094 - 4,106. So the short-term structure looks weak. No argument there. But if price sweeps this FVG and fails to continue lower, that’s where buyers can step in for a reaction move.
Main bias for this setup is bullish recovery from the FVG.
Not a full trend reversal. Don’t overthink it. Just a liquidity bounce into higher supply.
The first level price needs to reclaim is 4,100 - 4,106. That EMA cluster is the gate. If gold gets back above it and holds, next draw is 4,134. That’s the SSL area marked on the chart. Above that, the Order Block around 4,155 - 4,170 becomes the real target.
Trading scenario:
Buy idea only if price holds the 4,057 - 4,065 FVG and reclaims back above 4,100 - 4,106.
Entry zone: 4,057 - 4,075 after confirmation
Stop loss: below 4,045
TP1: 4,100
TP2: 4,134
TP3: 4,155 - 4,170
No reclaim, no buy. Simple.
If gold closes hard below 4,045, this bounce idea is dead. Then sellers can drag price back toward 4,028 and maybe lower.
For now, I’m watching the FVG sweep first, then the 4,106 reclaim.
You think gold traps sellers here or breaks clean below 4,057?
Long 
XAUUSD 4135 reclaim — 4210 is the next trap XAUUSD 4135 reclaim — 4210 is the next trap
That weekly shift is getting interesting now.
Whole week was basically one big liquidity game.
First, gold swept into 4,098 and reacted from the OB. Then it flushed deeper into 4,021, grabbed the low, and bounced again. After that, price pushed into 4,125 - 4,140 FVG and rejected. Sellers had control there for a bit.
But now? Different read.
Gold is no longer just bleeding lower. That reaction from the 3,959 - 4,023 area gave a clear ChoCH, then price started building higher again. Slow. Messy. Not pretty. But still a recovery structure.
Main bias now is bullish continuation while price holds above 4,080 - 4,023.
I’m watching the reclaim around 4,135. If buyers keep price above the EMA cluster and don’t let it sink back under 4,107, then 4,210 becomes the next magnet. That is the first Order Block. Also a clean premium zone. So yeah, I expect reaction there. Maybe pullback. Maybe trap.
But if 4,210 breaks and holds, then the bigger draw is 4,365 - 4,379. That upper OB is sitting there like unfinished business.
Trading scenario:
Buy idea only if price holds above 4,107 - 4,080 and keeps building higher.
Entry zone: 4,107 - 4,135 after confirmation
Stop loss: below 4,023
TP1: 4,210
TP2: 4,230
TP3: 4,365 - 4,379
No confirmation, no chase into the middle.
If gold closes hard below 4,023, this bullish recovery is cooked. Then the whole move turns back into sell-side pressure, and 3,959 can be tested again.
For now, I’m reading this as weekly sweep first, recovery second, 4,210 next trap zone.
You think gold tags 4,210 first or shakes out one more low?
Long 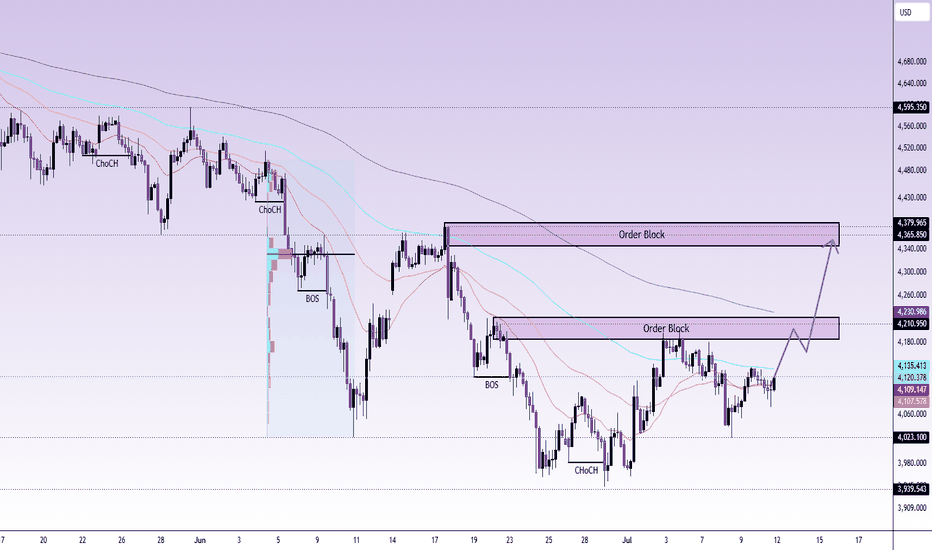
NIFTY : Intraday Trading Plan | 13-Jul-2026Instrument: NIFTY 50 Index (15 Min Chart)
Previous Close: 24,211.65
Gap Consideration: 100+ points (Gap Up / Gap Down)
🧭 Chart Legend (For Reference)
🟢 Solid Green Line = Bullish / Long Bias Zone
🔴 Solid Red Line = Bearish / Short Bias Zone
🟠 Solid Orange Line = No-Trade / Sideways Zone
➖ Dashed Line (Any Color) = Trend "May or May Not" Sustain — Wait for Confirmation
🔑 KEY LEVELS TO WATCH TODAY
•🔸 Last Intraday Resistance: 24,375
•🔸 Opening Support/Resistance Zone: 24,244 – 24,276
•🔸 Opening Support Zone: 24,143 – 24,167
•🔸 Last Intraday Support: 24,036
•🔸 Deep Support (Extended): 23,926
🟢 SCENARIO 1: GAP UP OPENING (100+ points) — Open above 24,311
📈 Explanation: A gap-up opening above 24,311 will push price directly near or above the Last Intraday Resistance of 24,375. Since this is a "resistance zone," the first reaction is critical — markets often either continue the breakout or trap buyers with a false move.
•🟢 If price sustains above 24,375 with strong 15-min candle close → Fresh bullish momentum can build, targeting extended highs. Consider Long via Call Options (CE) on retracement/dip near 24,375-24,390 zone.
•🟠 If price opens gap-up but struggles to hold above 24,375 → Treat as No-Trade Zone initially. Wait for 15-30 min consolidation before deciding direction.
•🔴 If price gets rejected sharply from 24,375-24,400 and closes back below 24,311 (gap-fill zone) → This signals exhaustion. Consider Short via Put Options (PE), targeting gap-fill towards 24,244-24,276 zone.
•➖ Dashed Caution: Gap-up openings often see profit booking in first hour. Avoid chasing the first candle blindly — let structure confirm.
🟠 SCENARIO 2: FLAT OPENING (Within ±100 points) — Open between 24,111 – 24,311
⚖️ Explanation: A flat opening keeps price trapped between the Opening Support (24,143-24,167) and Opening Support/Resistance Zone (24,244-24,276). This is the most common scenario and requires patience — avoid trading inside these zones as they represent indecision/no-trade areas.
•🟠 If price opens and stays within 24,167 – 24,244 range → This is a No-Trade Zone. Wait for a clean breakout on either side with volume confirmation before taking a position.
•🟢 If price breaks above 24,276 with strong momentum → Bullish bias activates. Consider Long via Call Options (CE), targeting Last Intraday Resistance at 24,375.
•🔴 If price breaks below 24,143 with strong momentum → Bearish bias activates. Consider Short via Put Options (PE), targeting Last Intraday Support at 24,036.
•➖ Dashed Caution: In flat openings, false breakouts are common in the first 30-45 minutes. Always confirm with a candle close beyond the zone, not just a wick/spike.
🔴 SCENARIO 3: GAP DOWN OPENING (100+ points) — Open below 24,111
📉 Explanation: A gap-down opening below 24,111 will bring price closer to the Last Intraday Support at 24,036. This is a critical support zone — reaction here decides whether sellers extend control or buyers step in for a pullback.
•🔴 If price opens gap-down and breaks below 24,036 with follow-through selling → Strong bearish continuation likely. Consider Short via Put Options (PE), targeting deep support at 23,926.
•🟠 If price opens gap-down but holds above 24,036, moving sideways → Treat as No-Trade Zone. Wait for direction confirmation before entering.
•🟢 If price finds support at 24,036 and reverses with a strong bounce back above 24,143-24,167 → This signals a potential gap-fill rally. Consider Long via Call Options (CE) targeting the Opening Support/Resistance Zone (24,244-24,276).
•➖ Dashed Caution: Gap-down opens can trigger panic selling early, followed by sharp short-covering. Avoid shorting blindly at open — wait for the first 15-min candle to confirm direction.
⚠️ RISK MANAGEMENT TIPS FOR OPTIONS TRADING
•🛡️ Always trade with a predefined Stop Loss (SL) — never average a losing options position.
•🛡️ Avoid buying deep OTM options; prefer ATM or slightly ITM strikes for better delta and reduced time decay impact.
•🛡️ Position sizing matters — never risk more than 1-2% of your capital on a single trade.
•🛡️ Keep an eye on Theta decay, especially in the last hour of expiry-week trading.
•🛡️ Avoid trading inside "No-Trade Zones" (orange areas) — this is where most retail traders lose money to whipsaws.
•🛡️ Use partial profit booking on strong moves rather than holding for the entire target — markets can reverse quickly near resistance/support.
•🛡️ Always check India VIX before taking option positions — high volatility can inflate premiums and increase risk.
📝 SUMMARY & CONCLUSION
Today's plan revolves around three key zones: 24,375 (Resistance), 24,244-24,276 (Pivot Zone), and 24,036 (Support). Depending on how NIFTY opens — Gap Up, Flat, or Gap Down — traders should wait for confirmation via candle closes rather than reacting to the opening tick. The orange zones represent indecision and should be avoided for fresh entries. Green and red zones offer directional opportunities only after breakout/breakdown confirmation. Patience in the first 15-30 minutes of trade is the key to avoiding false signals today. 🎯
⚠️ DISCLAIMER
I am not a SEBI Registered Analyst. This post is purely for educational purposes and reflects personal technical analysis based on chart patterns. It should not be considered as investment/trading advice. Please consult your financial advisor before making any trading or investment decisions. Trading in equities/options involves substantial risk of loss. 🙏📚 Long 
Peak to Flip: A 50% Story That RepeatedThis post is educational and observational in nature based on historical price action on a monthly timeframe. It is not a forecast or a trading recommendation.
1) Marked on this chart in white are three separate flip zones. A flip zone is a price level that once acted as resistance, and after being broken and sustained above, converted into support. Markets often revisit these levels later, and when they hold from above, it confirms the flip.
2) Each time one of these flip zones formed, a similar sequence followed. Price rallied from the flip zone, reached a peak, meaning the highest point of that particular move, and then fell back down. What stood out across all three instances is where that fall eventually found support.
In each of the three cases, the decline from peak to bottom landed close to a 50% retracement of that move, and in each case, the level where price stopped falling was the same flip zone that had originally supported the rally. The zone that launched the move also caught the fall.
3) This is not a rule, not a strategy and not a signal to act on. It is simply a repeated observation across this specific chart, on this specific timeframe, three separate times. Seeing the same relationship between a flip zone, a rally, a peak and a roughly 50% retracement recurring more than once is the kind of pattern recognition that comes only from spending time studying price history closely.  Long
Long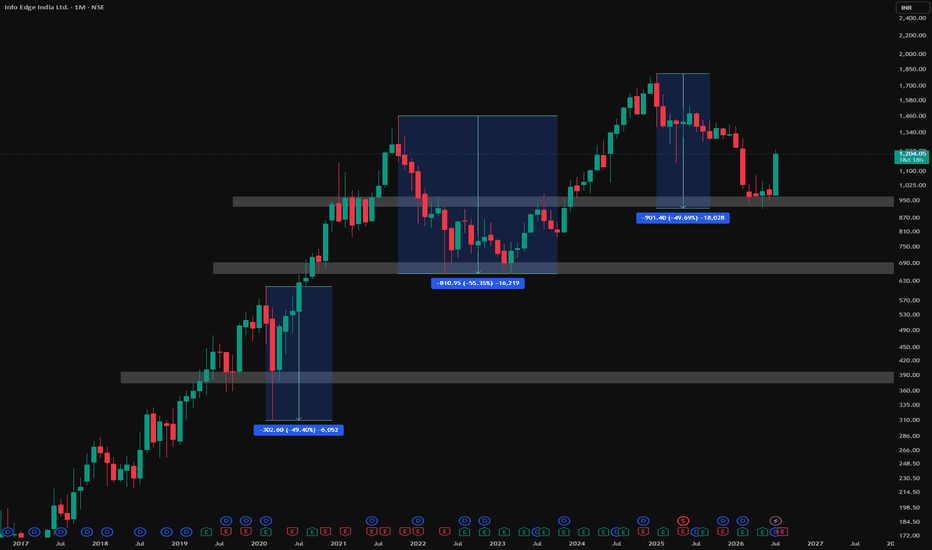
Short