Dilip Buildcon Ltd forms Bottom Triangle/Wedge + Divergence
A Bottom Triangle/wedge shows two converging trendlines as prices reach lower highs and higher lows.
The price breaks above the upper trendline with a noticeable increase in volume, confirming this bullish pattern as a reversal of the prior downtrend.
There is divergence seen Price vs RSI and Price Vs MACD .
PLEASE NOTE THAT:
This chart analysis is only for reference purpose.
This is not buying or selling recommendations.
I am not SEBI registered.
Please consult y
Wedge
Devyani International at Strong Support, Attractive Risk RewardDevyani International Looks Attractive
Fundamentals : Strong, Consistent growth on Sales, Profits and EPS. High Reserves vs debt free, Discounted..
Technicals : Taken Strong Support in rising Wedge.. Good RR...
Resistance 1: 180
Resistance 2: 200
Resistance 3: 220+
Support Zone : 140-125
EOS: Bullish Reversal Alert! Breakout Potential Ahead💎 EOS has recently broken out of the descending channels and formed an inverse head and shoulders pattern, which typically indicates a bullish reversal. Additionally, there has been a noticeable change of character (CHoCH) in the price action, suggesting a shift from a bearish to a bullish structure.
💎To confirm the bullish trend, it is essential for the price to break out above the first resistance level. This breakout would signal potential targets towards the subsequent resistance levels.
💎
E
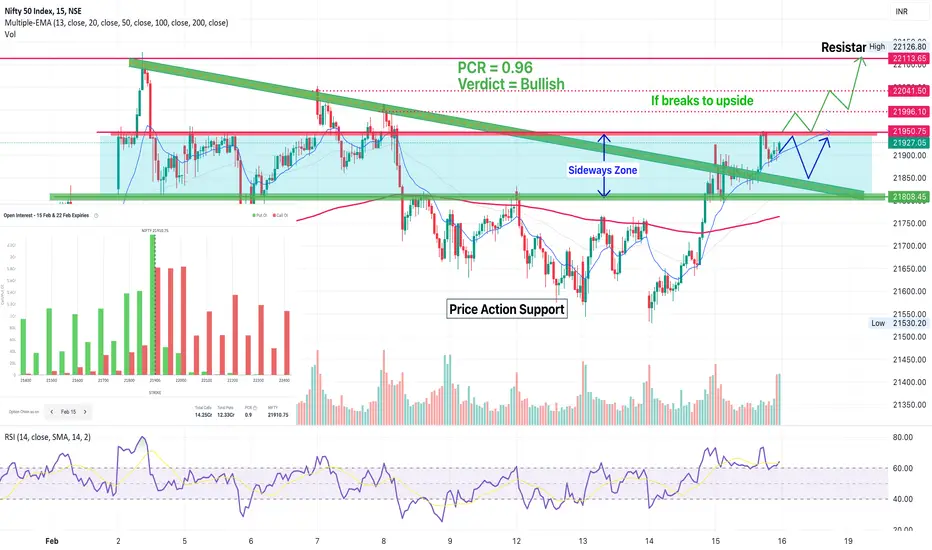
NIFTY prediction for tomorrow 16th FEB 24As we discussed NIFTY for today, it ended sideways.
Now, if we look at the chart data:
The market has already given a breakout as it expired today. It ended sideways to the upside while facing resistance at 21950. The market will be sideways in the range of 21800-21950.
EMA has given bullish-crossover EMA(50,200). Which shows the market is in a good bullish phase.
If we look at the OI data:
Pcr = 0.96 shows a bullish signal. Also, 21900 has very good PE writing, which s
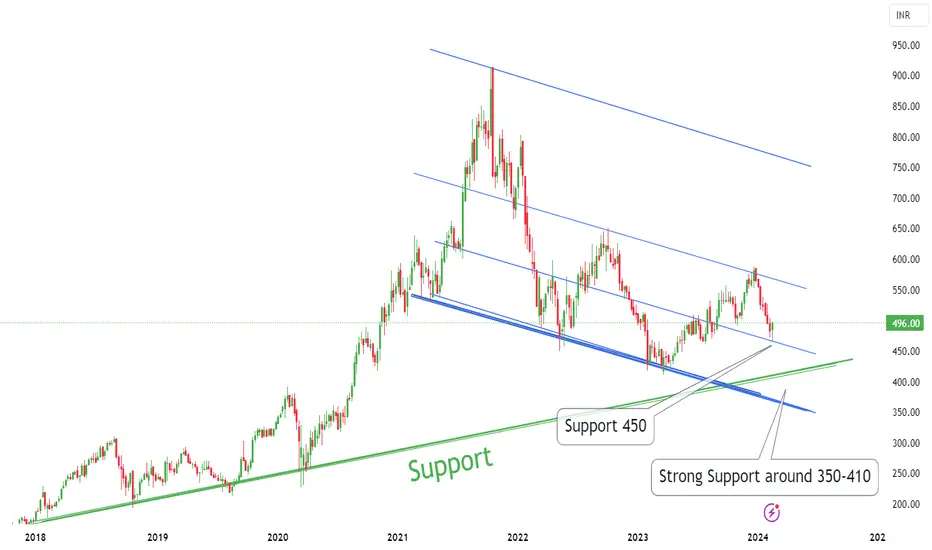
Jubilant Food : Potential Multibagger in Making Jubilant Food is making falling channel.
Stock around the support of channel
There are multiple support which is around 450
Strong support is around 350-410 level.
After breakout prices are correcting. But we can make a huge position because it's multi year breakout
We can clearly see prices halt there.
Now from hereon we can see 650 levels and 800 levels in months to come !!
Buy on Dips !!
APT Analysis: Testing Resistance with Bearish Bias
💎 APT is currently testing the resistance trendline of a descending channel. Additionally, a closer look at the candles reveals that red candles are larger than green ones, suggesting a higher likelihood of a bearish trend.
💎The price is also indicating CHoCH, and it's currently at the bearish OB, coinciding with the Fibonacci 0.618 level and the resistance trendline of the descending channel. These factors collectively support a bearish outlook for APT at this level.
💎For confirmation of t
APE Analysis: Bullish Breakout Potential 💎 APE has broken out of a descending channel and is also displaying signs of CHoCH in the price, indicating a potential bullish move from here or after a pullback from the Bullish OB zone.
💎If APEUSDT breaks out directly from its current position, we can anticipate targets until the next resistance zone. Alternatively, if APE experiences a pullback from its current position and starts finding support at the Bullish OB zone, it could form a W pattern, a bullish reversal pattern. This setup would
SNX Analysis: Bullish Breakout Signals Potential Upside Momentum💎 SNX has broken out of the resistance zone, which is now acting as support. Additionally, it has broken out of a falling wedge pattern and formed a W pattern in the support zone, increasing the likelihood of a bullish trend.
💎 Moreover, the price has exhibited a CHoCH (Change of Character) or a breakout of the previous swing, indicating a bullish trend. Given these factors, we can anticipate a bullish move from this point. Alternatively, there might be a retracement towards the demand area & e
SHIB: Bullish Momentum Building with W Pattern Formation💎 SHIB has broken out of a falling wedge pattern and is currently forming a W pattern on the demand level. There is also a possibility of a further retracement back to the demand area to gather more support.
💎For confirmation of the bullish reversal W pattern, we would need to see a candle closing above the resistance level of 948. This would validate the pattern, and we could then anticipate targets up to the next resistance levels of 1035 and 1107.
💎However, if the price declines below to th
Jubilant Food : Multi Year Breakout !! Potential multibagger !!Jubilant Food is making falling wedge and now given the breakout.
After breakout prices are correcting. But we can make a huge position because it's multi year breakout
We can clearly see prices halt there.
Now from hereon we can see 650 levels and 800 levels in months to come !!
Buy on Dips !!
XRP Analysis: Potential Bullish Breakout from Descending Channel💎 XRP has rebounded from the demand area and is currently attempting to break out of the descending channel, which suggests a potential bullish scenario. To increase confidence in this upward movement, we need to see significant bullish candles.
💎For confirmation, we're looking for a candle closing above the small resistance level of 0.5411. A breach of this level could indicate further upside potential, with targets near the next resistance levels of 0.6237 and 0.6596.
💎However, if XRP retrac
SBI : PSU Bank solid Bearish setup ?? Alert! Bearish Pattern Spotted! 🐻
📊 Pattern: Rising Channel
📌 Symbol/Asset: SBIN
🔍 Description: Stock is in Rising channel.
and now Stock is around the resistance of the rising channel.
We can see downside of 18-20% if 730 levels are intact !!
Huge shorting opportunity !!
👉 Disclosure: We are not SEBI registered analysts, this is not a buy or sell recommendation.
Banknifty looking super bearishBanknifty has formed rising wedge pattern which is super bearish sign in the market. Also there is 200 EMA(purple line) support at the current closing level of banknifty. If somehow it breaks the 47500 levels and sustains below it for 5-10 minutes there will be big targets possible. Only disclaimer is HDFCBank has to support this down fall.
Target1 47033
Target2 46500
Target3 45960
Target4 45480
Target5 44950
Best case scenario:
Remember this is not possible in one day. This could b
SYNGENE - Swing Trade - 7th February #stocksSYNGENE INTERNATIONAL (1W TF) - Swing Trade Analysis given on 7th Feb, 2024
Pattern: FALLING WEDGE BREAKOUT
- Breakout - Done ✓
- Volume Spike at Resistance - Done ✓
- Retest & Consolidation - In Progress
#stocks #swingtrade #chartanalysis #priceaction #traderyte #SYNGENE #stockmarket #sharemarket #viral #sharemarketindia #StockMarketindia #investment
SAIL - Swing Trade Analysis - 28th January #stocksSAIL (1D TF) - Swing Trade Analysis given on 28th Jan, 2024
Pattern: FALLING WEDGE BREAKOUT
- Breakout - Done ✓
- Volume Spike at Resistance - Done ✓
- Retest & Consolidation - In Progress
#stocks #swingtrade #chartanalysis #priceaction #traderyte #SAIL