INDOAMIN - Bottom Wedge PatternThe bottom Wedge pattern is a type of continuation pattern that typically occurs within a downtrend and indicates a potential reversal in market direction.he bottom triangle pattern is a type of continuation pattern that typically occurs within a downtrend and indicates a potential reversal in market direction.
It's important to note that while technical patterns like the bottom triangle can offer insights into potential market movements, they are not foolproof and should be used in conjunction with other forms of analysis.
Traders and investors often use a combination of technical and fundamental analysis to make informed decisions.
Remember that the effectiveness of these patterns can vary, and markets are influenced by a wide range of factors. Always exercise caution and consider risk management strategies when making trading decisions based on technical patterns.
PLEASE NOTE THAT:
This chart analysis is only for reference purpose.
This is not buying or selling recommendations.
I am not SEBI registered.
Please consult your financial advisor before taking any trade.
Wedge
INDIGO : Best swing shorting OpportunityAlert! Bearish Pattern Spotted! ๐ป
๐ Pattern: Rising Channel
๐ Symbol/Asset: INDIGO
๐ Description: Stock is rising and now making rising channel.
Which is bearish pattern.
We can see downside from hereon.
๐ Disclosure: We are not SEBI registered analysts, this is not a buy or sell recommendation.
SAIL is about to fly in coming days๐ Exciting times for SAIL!๐ Anticipating positive trends in the coming days. ๐ The steel industry is buzzing, and SAIL seems poised for growth. ๐๏ธ DYOR, and let's see where this journey takes us! #SAIL #StockMarket #Investing #BullishOutlook #SteelIndustry
LLong
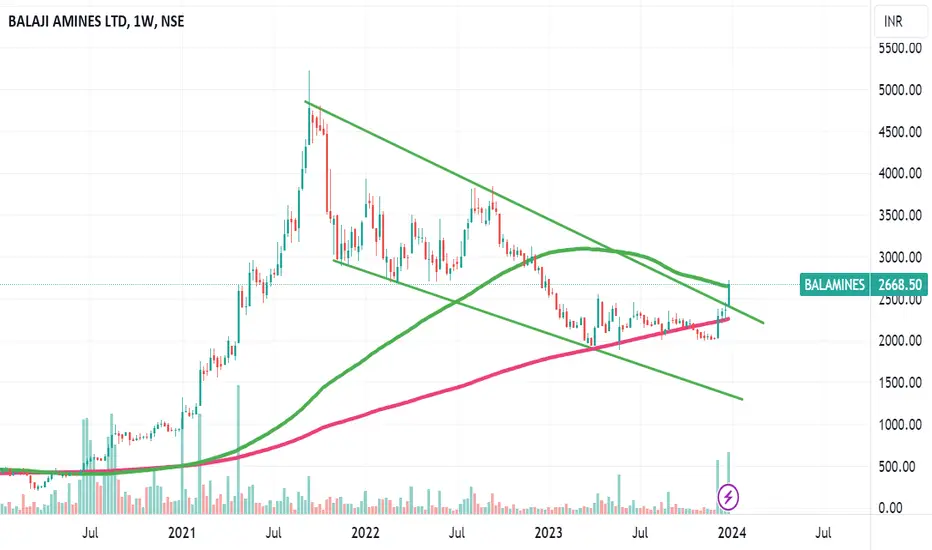
BALAAMINES - SWING TRADE - 18th December #stocksBALAAMINES (1D TF)
Swing Trade Analysis given on 18th December, 2023 (Monday)
Pattern: FALLING WEDGE BREAKOUT
- Breakout of Resistance - Done โ
- Retracement & Consolidation - In Progress
#stocks #swingtrade #chartanalysis #priceaction #traderyte #balaamines
RAIN Industries - Bottom Forming pattern - Multibagger๐ Exciting Bullish Pattern Alert! ๐
๐ Pattern: Falling Wedge
๐ Symbol/Asset: RAIN
๐ Description: Stock is forming falling wedge pattern around the Long Term Support.
We can clearly see bottom is in making.
There is a strong support of around 130-135 and we can see huge bounce from hereon.
Rain Industries is a Buy On Dips.
Not to Miss this opportunity.
๐ Disclosure: We are not SEBI registered analysts, this is not a buy or sell recommendation.
#SUI : Bullish breakout pending!!!!!#SUI / D1 :
Sui is trading inside a rising wedge and it is repeatedly testing its resistance trendline. If the resistance gets broken, Expecting a 40% bullish rally as per textbook pattern target.
Also, Rising wedges mostly tend to break upwards during bull markets.
NIFTY METAL Sector Analysis (1W TF) - 16th December 2023#NIFTYMETAL Sector Analysis (1W TF)
PATTERN: RISING WEDGE BREAKOUT
- The Metal sector has shown a fabulous up move since beginning of 2023
- Wait for Breakout of the Resistance Zone OR Reversal !
#stocks #swingtrade #chartanalysis #priceaction #traderyte #india #indiagdp #StockMarketindia
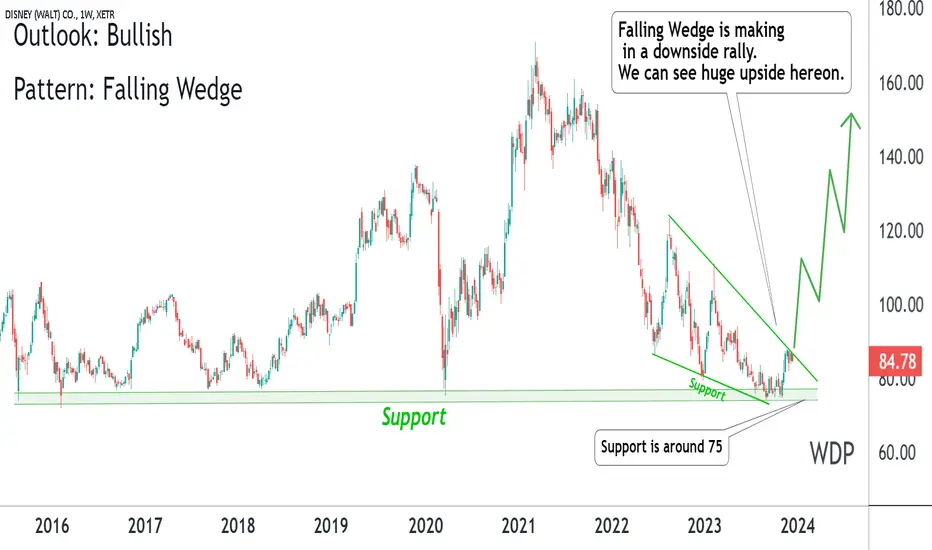
DISNEY WDP on a Long term Support !Exciting Bullish Pattern Alert! ๐
๐ Pattern: Falling Wedge
๐ Symbol/Asset: WDP DISNEY
๐ Description: Stock is around long term support.
Stock might not come around the same level again .
Stock is also making falling wedge in a downside rally, so we can see huge momentum after falling wedge breakout !!
We can expect minimum 200-400% returns in coming years !!
๐ Disclosure: We are not SEBI registered analysts, this is not a buy or sell recommendation.
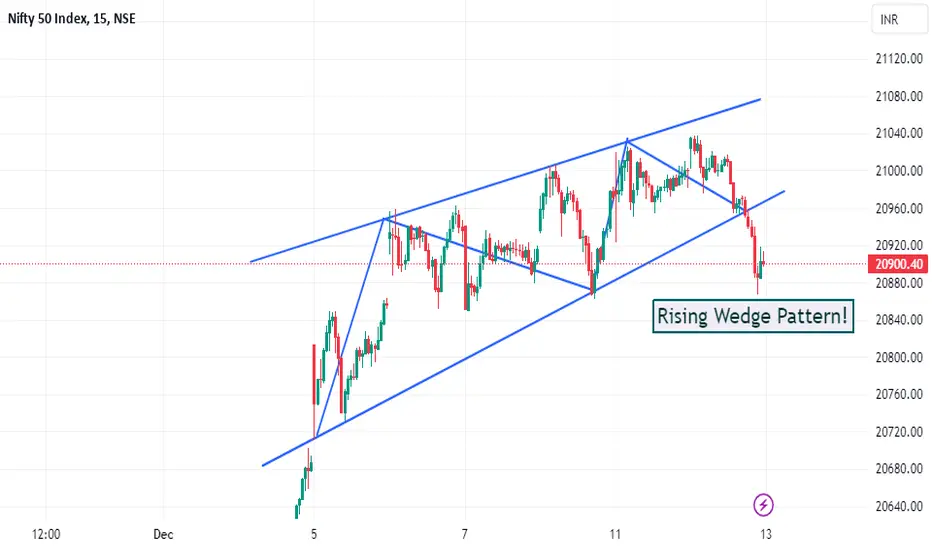
Nifty 50: Rising Wedge in a Strong Economic Climate!The Nifty 50 index exhibited a complex behavior, oscillating between 20,850 and 21,000, indicative of a period of consolidation. The chart reveals a rising wedge pattern, typically seen as a bearish signal in technical analysis. This pattern emerges amidst the index surpassing the 21,000 mark, reflecting strong economic indicators. For traders focusing on short-term movements, the 15-minute candle charts are essential for identifying immediate opportunities, especially in light of the expected increase in volatility due to the leap year and forthcoming elections in India.
Disclaimer - fyers.in
BTC to $39K: Is this the beginning of Bullish trend?BINANCE:BTCUSDT is approaching higher levels after a prolonged wait. According to the current trend, BTC is likely to reach $39000, possibly even $40000 by the end of this month, followed by a correction to the $34000 range.
This could be the last opportunity to maximize the benefits of the upcoming bull run. Starting in mid-December, a significant capital inflow into BTC is expected due to increased institutional adoption. With the Halving approaching and positive market sentiment surrounding the "inevitable" spot ETFs, this increased capital inflow will act as a catalyst for the bull run.
However, before that happens, a minor correction to the $34K levels is anticipated. Therefore, it's advisable to have some stable coins on hand to take advantage of potential buying opportunities during the dip. #WAGMI
EIH Ltd forms bullish "Continuation Wedge" chart patternA "Continuation Wedge (Bullish)" chart pattern formed on EIH Ltd ( NSE:EIHOTEL ).
After a temporary interruption, the prior uptrend is set to continue.
This bullish signal indicates that the stock price may rise from the close of 232.20 to the range of 249.00 - 253.00
PLEASE NOTE THAT:
This chart analysis is only for reference purpose.
This is not buying or selling recommendations.
I am not SEBI registered.
Please consult your financial advisor before taking any trade.
decending wedge can give upside move of 6-12 %Jsw steel price breaks an important resistance level and previous day volume spiked price action is Good in this chart as a descending broadening wedge is appeared so we can trade this after confirmation when the price sustained that level and after the increase in volumes We can make position for a target of 5 to 12 percent.
fii / dii data is also positive
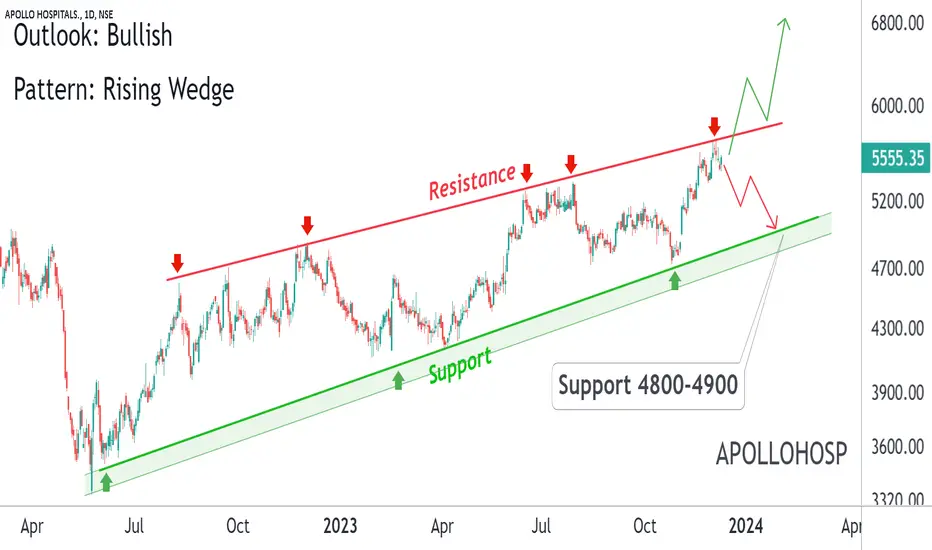
Apollo Hospital : Very Bullish Pattern Exciting Bullish Pattern Alert!
๐ Pattern: Rising Wedge
๐ Symbol/Asset: APOLLOHOSP
๐ Description: Stock is in a rising wedge. We can see downside if resistance is intact. And stock can come towards 4800-4900
Or If stock gives breakout then we see huge momentum on the upside.
๐ Disclosure: We are not SEBI registered analysts, this is not a buy or sell recommendation.
BALRAMCHIN : Exciting Bullish Pattern AlertExciting Bullish Pattern Alert!
๐ Pattern: Rising Channel
๐ Symbol/Asset: BALRAMCHIN
๐ Description: Stock is around the support.
We can see huge momentum if support is intact.
๐ Disclosure: We are not SEBI registered analysts, this is not a buy or sell recommendation.
Nifty Bullish scenario??Hey there i am sharing my insight on nifty for another possible bullish scenario from here
as we can see we are making and descending wedge pattern which usually a bullish sign
What we have to wait for??
Is just we need volume at the time of breakout unless it will be just a fakeout