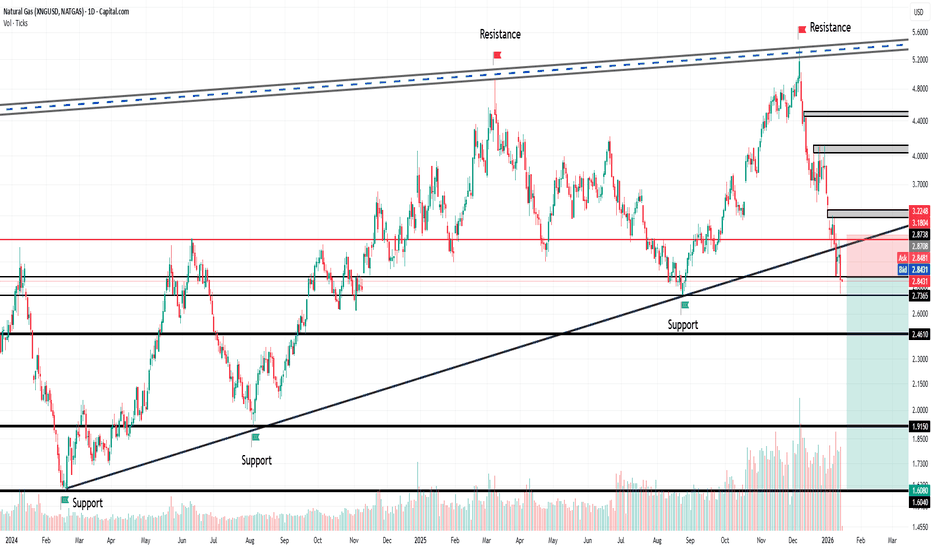
HFCL wait is overNSE:HFCL
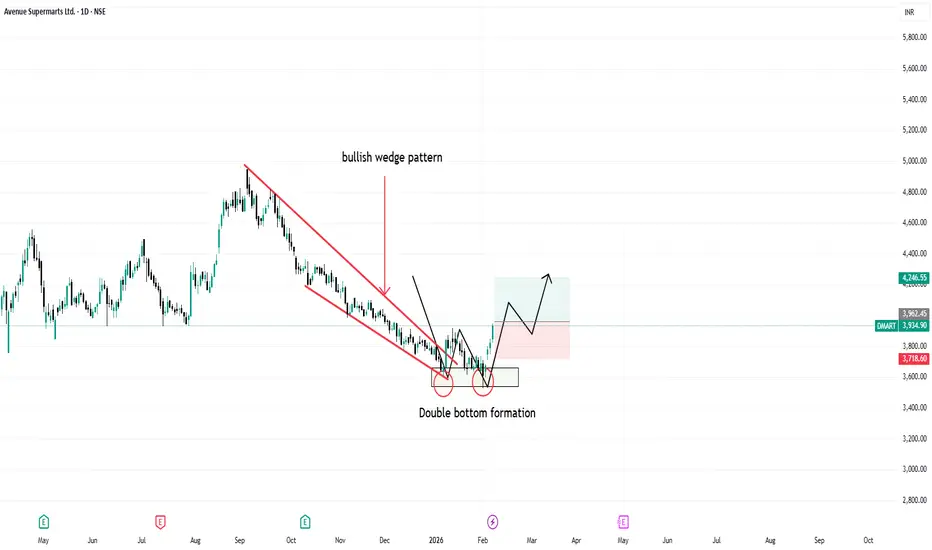
Wait is over price take support near to major support line and also with huge volume this is also sign of good support.
now, price faces resistance from his current wedge upper side trendline. ready to breakout or another little pullback for breakout.
this view will change if price break major trend line support. then next support is 34.
please do your own research before taking any trade.
i am not financial advisor
risk is real stay practical
please feel free to ask any questions
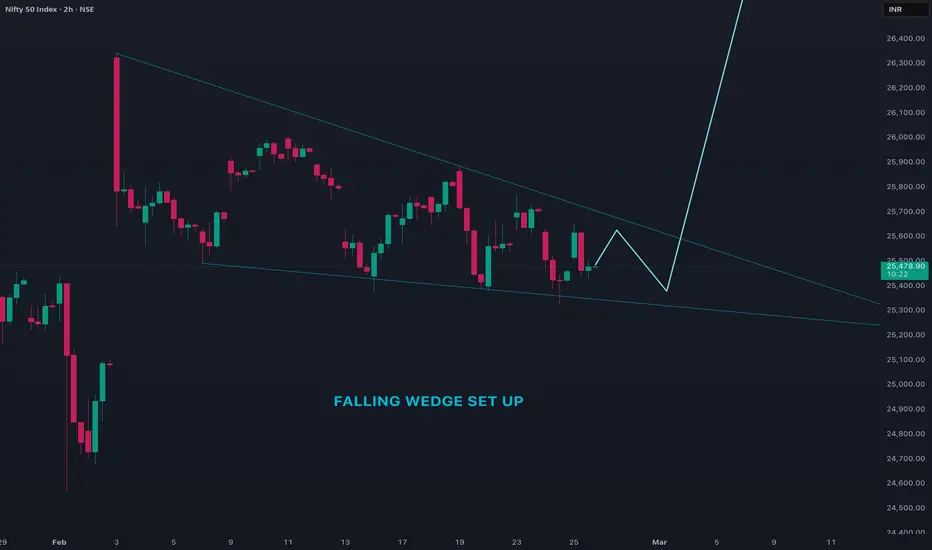
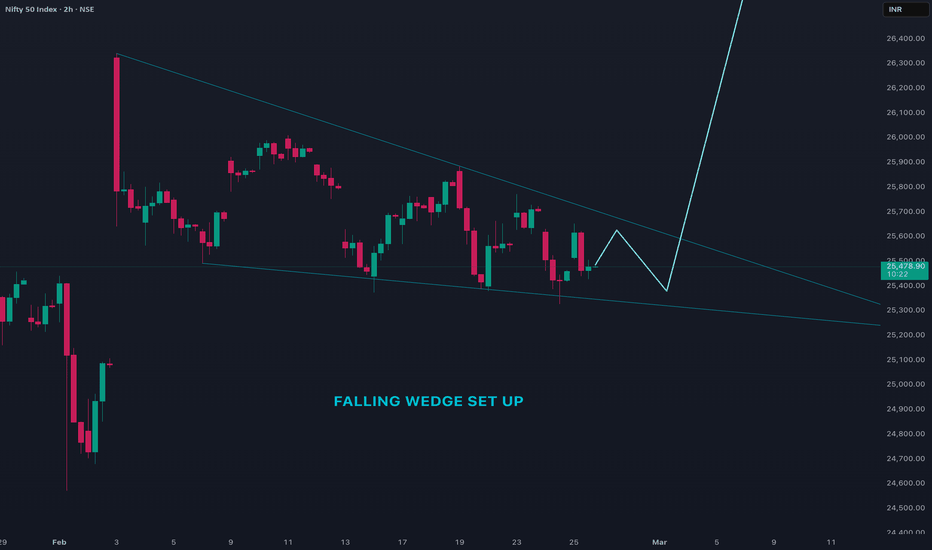
Wedge
Jio Financial Near Support ZoneNSE:JIOFIN
jio financial near to the ga [ support and support also taken today but not sustainable.
let see what next happen already price near to the ipo price. gap support, channel trendline support. candle pattern support. this all are positive points.
Negative point
break the all support 😅
please do your own research i am not financial advisor
VIYASHVIYASH (Old Name >> Sequent Scientific)
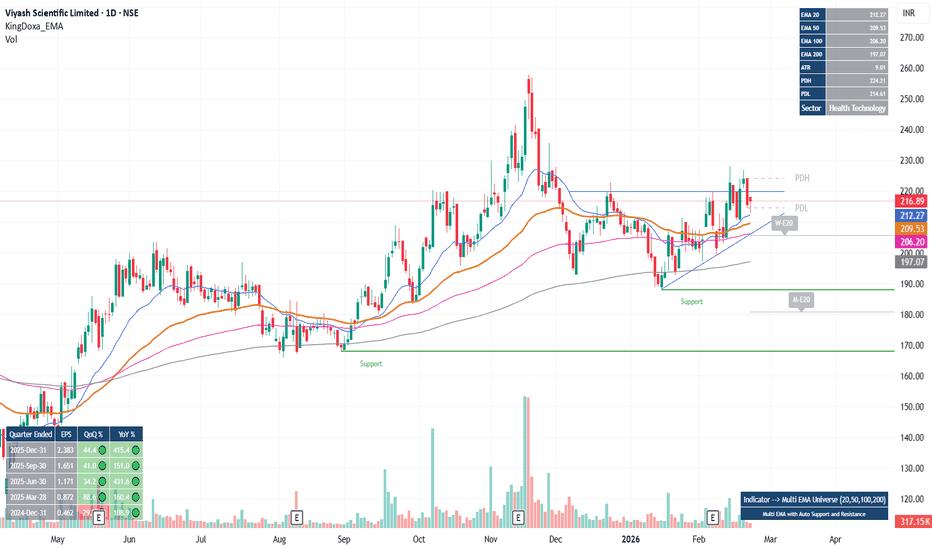
Price sustaining above all EMA represent strength in stock
Price making continuous Higher Lows and lastly trying to range out of consolidation.
Price continuously respecting the previous good demand area.
Buying on clear break out or step buying on every dips may be good strategy.
NB: I am not a registered advisor, publication here is only for educational and predicting possible future price actions only. Many time I was failed with my setup and study. Do take your financial advisor's help before taking any position.
Will Bitcoin Recover or continue to perishBTC/USD Analysis (Weekly Chart)
- Bitcoin's primary trend is bullish, although on a weekly chart, the prices, which were trending with a rising wedge, gave a bearish breakout.
- However, the prices are retracing higher after testing the lower order block (black zone).
- Currently, prices are resting within a stronger order block (blue zone), and prices are now expected to rise above the order block (69500)
- The RSI is also making a hidden bullish divergence, confirming that bulls are gaining strength.
- The prices might rise towards 83800, with an immediate hurdle near the psychological 75000 level
BHEL: Bear Flag on Weekly, Fundamentals Don’t Help EitherBig Picture (Weekly)
BHEL formed a bearish pole and flag on the weekly chart. After a sharp fall, price moved into a rising, overlapping channel — typical corrective behaviour.
Wave X looks completed near 305.9 . As long as price stays below this level, the structure favours another leg down.
Zoom In (1H)
From 305.9 — 240.5 , price unfolded in a clean ABC zigzag , marking (a) of Y .
The current rise is overlapping, slow, and wedge-shaped , suggesting a corrective (b) of Y , not a new trend.
Confluence to note:
Rising wedge formation
0.618 retracement of the entire fall near ~280
Momentum losing steam near resistance
A break below the lower wedge trendline is the trigger for the final (c) of Y decline.
Fundamentals Check
Fundamentals are not supporting upside here:
P/E ~118 — wildly stretched for a PSU with low returns
ROCE ~2–3% — weak capital efficiency
Operating margins ~5.5% — thin and fragile
Free cash flow = inconsistent — spikes, then collapses; not durable
Debt increased sharply in the latest year
In short: price optimism > business reality.
Trade View
Bias: Bearish below 305.9
Entry:
On a 1H breakdown below the rising wedge
Targets:
165 (primary)
150 (extended, if momentum expands)
Invalidation:
Weekly close above 305.9 — bearish view fails
Bottom Line
This is a classic case where structure, lower-timeframe signals, and fundamentals are aligned .
Until proven otherwise, rallies look corrective — not the start of a new bull run.
Disclaimer: This analysis is for educational purposes only and does not constitute investment advice. Please do your own research (DYOR) before making any trading decisions.
CADCHF-M15CAD/CHF has delivered a textbook sell-side liquidity raid beneath the Asian range, purging weak longs before staging an aggressive displacement higher. The reaction from the discount array suggests deliberate smart money activity, with price repricing toward equilibrium after leaving a clear imbalance in the wake of the impulsive markdown.
The current dealing range is defined by the recent swing high and the freshly engineered liquidity low near 0.56420. With price now trading back above the mean threshold, the narrative shifts toward a draw on liquidity resting at the buyside pools overhead.
Orderflow observations indicate:
• **Liquidity Event:** External range liquidity was efficiently harvested, followed by immediate rejection, signaling absorption rather than continuation.
• **Displacement:** The impulsive rally establishes a short-term market structure shift, increasing the probability of continuation toward premium.
• **Fair Value Gap (FVG):** Price is actively rebalancing the inefficiency, reinforcing the case for algorithmic delivery toward opposing liquidity.
• **PD Array Alignment:** Current pricing favors rotation from discount to premium within the active dealing range.
**Execution Framework:**
Tactical longs remain favorable on shallow retracements into imbalance or consequent encroachment, provided price maintains acceptance above 0.56420. Failure to hold this level would imply incomplete sell-side objectives, exposing the pair to deeper liquidity magnets.
**Liquidity Targets:**
Primary draw rests at 0.56540, with resting buyside liquidity projected near 0.56680. A clean expansion through this zone could trigger a momentum cascade toward 0.56790.
Until proven otherwise, expect algorithmic delivery to favor premium pricing as the market seeks balance after the engineered liquidity event.
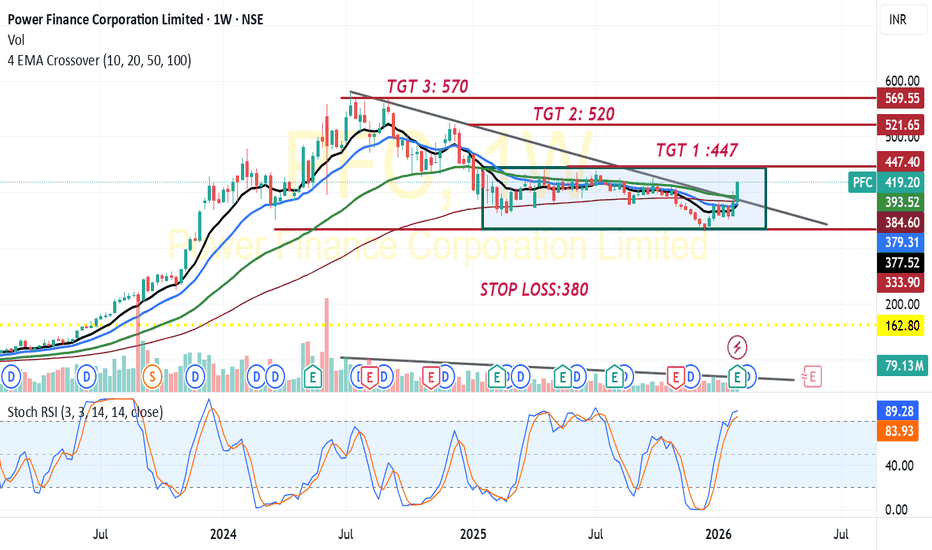
PFC:Likely Huge Trend Line Break OutPFC:
Trading at 419 and above all its Moving averages in daily chart viz 10,20,50,100 DEMA
Has given Golden crossover of 10 DEMA in Daily chart
Sustained increase in volume -latest two weeks noticed
Trading at 419 and above its Trend line resistance
Combination of the above suggests a possible upside ranging from 450-600.
Target 1:450 TGT 2:500 TGT 3:525-550 TGT 4:550-600+
Safer traders might consider going long above 450 on closing basis with a SL of 380 for 550-600 Target(For educational purpose only)
SILVER : Make-or-Break Zone — Double Bottom vs. ABC “C” WaveSilver saw a sharp impulsive sell-off (black leg down), followed by a controlled corrective rebound inside an ascending channel (blue). Price then rejected from the upper channel boundary and broke down, shifting momentum back to the downside.
Now price is approaching a high-importance horizontal support / demand zone (green box) marked as Target 1 , aligned with the purple support line. This area is the decision point for the next major move.
Bullish : If a reversal candle forms here and price holds the zone, a double bottom is confirmed and Silver can continue up (green path).
Bearish : If it breaks and closes below this support, Silver likely starts the C wave of an ABC correction toward the next support (red path).
This is a technical study for educational purposes, not investment advice. Manage risk.
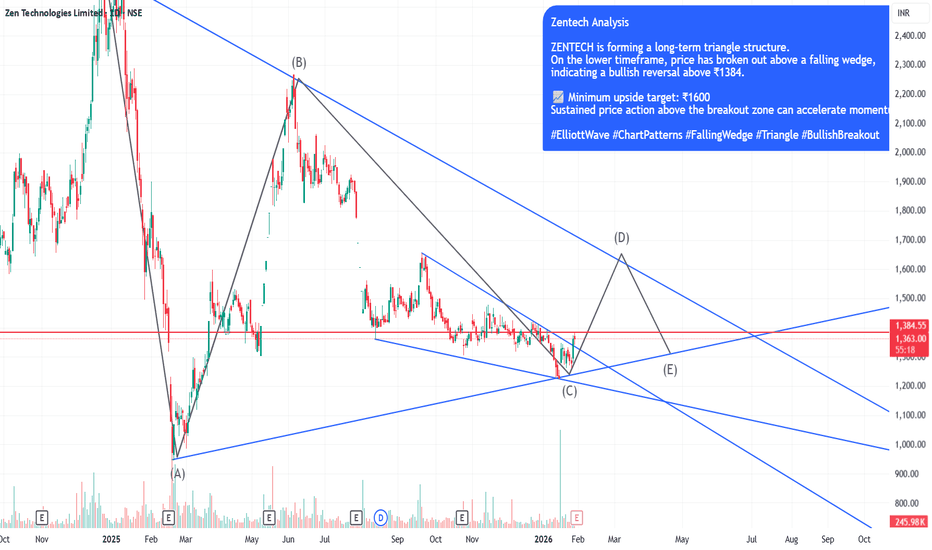
ZENTECH Bullish Breakout: Falling Wedge Resolves Within Long-TerZENTECH is currently trading within a long-term triangle structure, indicating prolonged consolidation before a directional move.
On the intermediate timeframe, price has broken out of a falling wedge pattern, which is a classic bullish reversal setup.
The breakout is confirmed above the ₹1384 zone, which now acts as an important support.
If price sustains above this breakout level, the structure suggests a continuation towards higher levels.
📈 Minimum projected target: ₹1600
As always, watch for volume confirmation and price holding above the breakout zone for further strength.
#ElliottWave #ChartPatterns #FallingWedge #Triangle #BullishBreakout #TechnicalAnalysis
Tata Steel (4H) - Late Stage Structure: Ending Diagonal in PlayThe price action in Tata Steel on the 4H timeframe is showing characteristics of a potential Ending Diagonal forming near the tail end of the advance.
From the Wave 4 low at 177.33 , the rise has not developed as a clean 5-wave impulse . Instead, the internal structure so far appears corrective , unfolding in three waves , which keeps the Ending Diagonal scenario valid.
Structure Assessment
Wave (iii) of the 5th wave appears complete
The ongoing move is likely Wave (iv)
Cardinal rule of an Ending Diagonal: Wave (iv) must overlap Wave (i) by trading below ~191
If this overlap condition is satisfied, the final Wave (v) is expected to unfold as a three-wave advance , completing the Ending Diagonal.
Implications
Ending Diagonals typically signal trend exhaustion rather than continuation . Once the structure completes, the probability of a larger corrective phase increases.
Invalidation
No overlap below 191 weakens the Ending Diagonal view
A strong impulsive decline instead of a choppy correction would require a reassessment
For now, the focus remains on structure and rule compliance, not prediction.
Disclaimer:
This analysis is for educational purposes only and does not constitute investment advice. Please do your own research (DYOR) before making any trading decisions.
HDFCBANK 4HR T/F ANALYSIS----
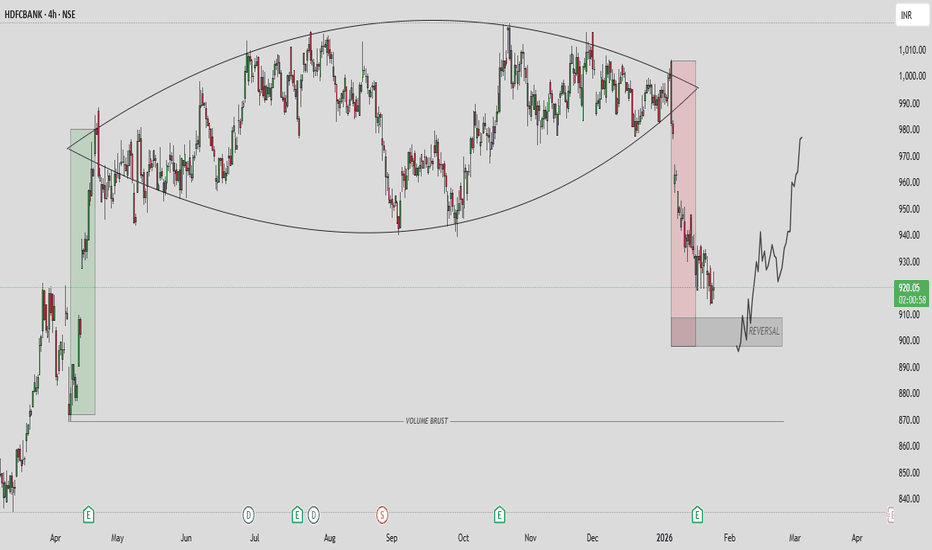
hdfcbank 4hr t/f analysis----- the top whole structure are bended both side which called structure is elips and it`s also dual direction in cans breakdown of elips into downside so we can measure elips of previous demand can measure body to body measure only green holding volume and interchange into supply so now we have a reversal area in this reversal zone wait for any bullish candle it`s help to confirmation to go with trend ok let`s see---
USDCAD 4HR T/F ANALYSIS----
usdcad 4hr t/f analysis----- after parallel channel breakdown we can measure marked supply which are repeated here so after supply complete then we can see demand from reversal portion and wait for also bullish candle on reversal portion it`s a confirmation to get right trade ok let`s see---
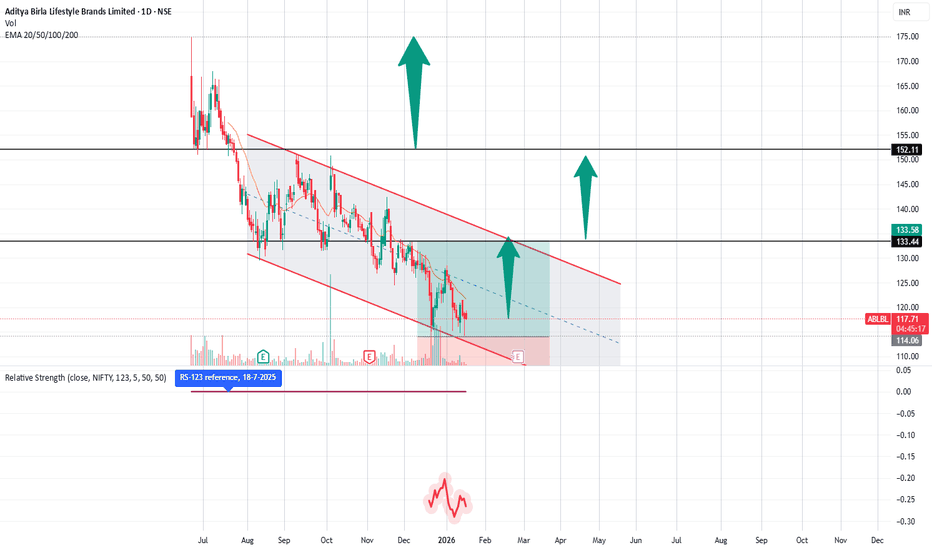
ABLBL: Falling Channel Study — Reversal Base + Swing Opportunity1️⃣ Primary Trend: Falling Channel (Bearish to Neutral)
Price has been moving inside a well-defined descending channel (lower highs & lower lows).
This indicates controlled selling, not panic — which is important for future reversals.
The stock is currently near the lower band of the channel, a typical area where:
Short covering starts
Value buyers enter
2️⃣ Support Zone & Reversal Signs
Strong demand zone: ₹114 – ₹118
Multiple rejections from this area
Long lower wicks indicate buying interest
This zone has acted as a base, increasing probability of a pullback move.
Breakout Levels to Watch (Very Important)
Immediate resistance: ₹133 – ₹134
Horizontal resistance + mid-channel zone
First sign of strength if crossed with volume
Major trend change confirmation: ₹150 – ₹152
Break & sustain above this = channel breakout
Can shift structure from downtrend → trend reversal
Swing Trading Perspective
Inside-channel swing opportunity:
Bounce from lower channel → mid / upper channel
Upside swing zones:
Target 1: ₹133–135
Target 2: ₹145
Target 3 (only if breakout): ₹150–155
🧠 What This Chart Is Saying (Simple Words)
Selling pressure is slowing down.
The stock is building a base near support.
A short swing bounce is likely first.
A trend reversal only happens above ₹150.
⚠️ Important Note
This analysis is for educational & learning purposes only.
Not a buy or sell recommendation.
Flag pole and Wedge🧭 Overview
The chart illustrates a strong bullish impulse followed by a descending wedge formation, a well-known trend continuation structure.
After a sharp upward move (flag pole), price enters a controlled pullback where volatility contracts, forming lower highs and slightly lower or stable lows.
This setup represents a healthy pause in the trend, indicating accumulation and preparation for a potential bullish continuation.
⸻⸻⸻⸻⸻⸻⸻⸻⸻⸻⸻⸻⸻
📊 Chart Observations
1. The initial move shows strong bullish momentum, creating the flag pole with decisive candles.
2. Following the impulsive rally, price starts forming Lower Highs, indicating short-term profit booking.
3. Simultaneously, the lows remain controlled and gradual, shaping a descending wedge structure.
4. Price consolidates within the wedge, reflecting volatility contraction and market balance.
5. The prior flag pole suggests that the dominant trend remains bullish, favoring continuation rather than reversal.
6. As the wedge tightens, pressure builds for a breakout, typically in the direction of the prevailing trend.
7. Confirmation: A valid bullish continuation is confirmed when successive candles close above the upper wedge trendline.
⸻⸻⸻⸻⸻⸻⸻⸻⸻⸻⸻⸻⸻
🟢 Summary
Structure: Flag Pole + Descending Wedge
Market Context: Strong uptrend with healthy corrective consolidation
Trade Bias: Bullish — focus on breakout above the upper wedge boundary
Key Validation: Consecutive candle closes above wedge resistance
⸻⸻⸻⸻⸻⸻⸻⸻⸻⸻⸻⸻⸻
⚠️ Disclaimer
📘 For educational purposes only
🙅 Not SEBI registered
❌ Not a buy/sell recommendation
🧠 Shared purely for learning and pattern understanding
📊 Not Financial Advice
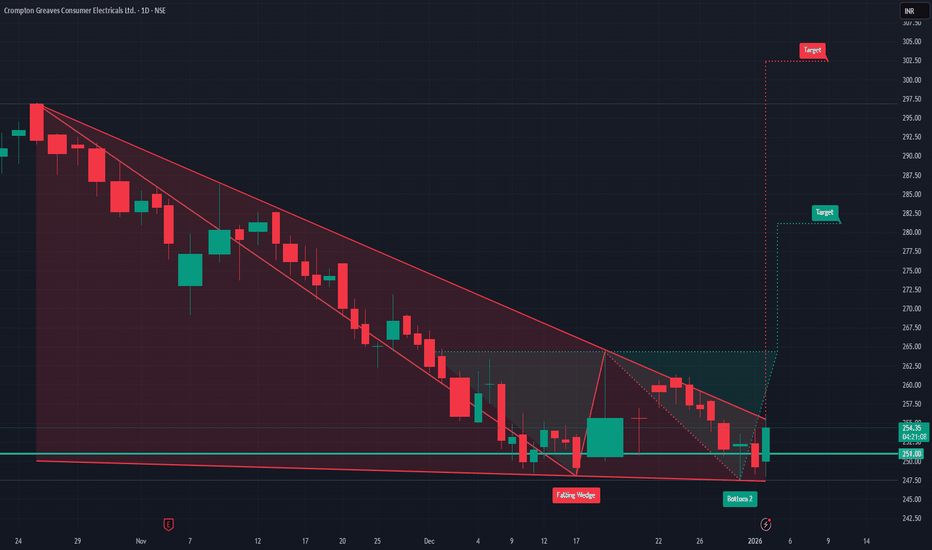
Crompton Greaves Falling?Technical (upgrade)
Crompton Greaves Consumer Electricals has been sliding inside a falling wedge, but price is trying to base around ₹248-252 (teal support on your chart). A daily close above ~₹260–262 (wedge top/near-term trendline) would confirm a breakout and set up a move toward ₹275 first and ₹300 next If price fails and closes back below ₹248, treat it as a false start and expect the downtrend to resume keep risk tight in that zone.
Fundamentals (quick, clean)
Latest print showed mixed trends—Q2 FY26 consolidated revenue ~₹1,915.6 cr, PAT ~₹75.4 cr, with margin pressure; the quarter also carried an exceptional ₹20.36 cr charge for the Vadodara plant restructuring. Butterfly (kitchen appliances) grew double‑digits YoY and lighting rose ~3% YoY, partly offsetting weakness in electric consumer durables. The company fully repaid its ₹300 cr NCDs in Jul‑2025 and said it is net‑cash/zero‑debt, which is a positive for flexibility. Valuation and efficiency are mid‑pack for consumer durables (P/E ~34–35; P/B ~4.3–4.9; ROE ~13–15%; ROCE ~15–19%). Net‑net: fundamentals are stable but margins need rebuilding—if your chart gets the ₹260–₹262 breakout, technicals can align with a gradual recovery story.
Like, comment your thoughts, and share this post
Explore more stock ideas on the right hand side your feedback means a lot to me!
Disclaimer: This post is for educational purposes only and should not be considered a buy/sell recommendation.
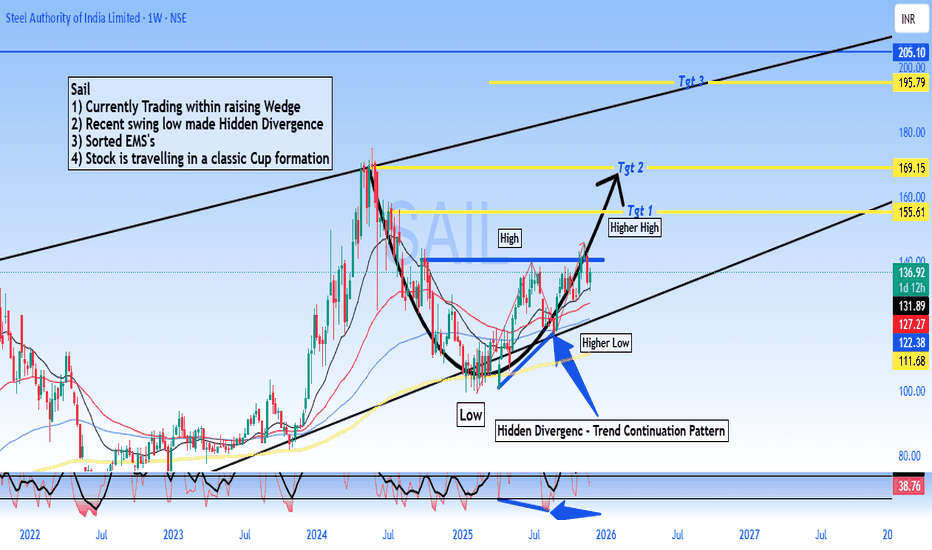
SAIL - Buy - Technical Analysis# Steel Authority of India Limited (SAIL) - Technical Analysis Report
Current Price: 136.92
Timeframe: Weekly Chart Analysis
Technical Setup Overview
SAIL is presenting a compelling technical picture with multiple bullish indicators aligning for a potential significant upward move. The stock is currently trading within a well-defined rising wedge pattern and has recently formed a **Hidden Divergence** on the weekly chart - a classic trend continuation signal.
Key Technical Observations
Rising Wedge Pattern:
The stock is trading within a rising wedge formation, which typically indicates consolidation before a breakout. The current price action suggests the stock is in the later stages of this pattern.
Hidden Divergence - Bullish Continuation Signal:
A **Hidden Divergence** has formed on the weekly timeframe.
- This pattern typically signals trend continuation and suggests the uptrend is likely to resume with strength
Sorted EMA Structure:
The Exponential Moving Averages are properly aligned, indicating a healthy bullish trend structure with multiple moving averages providing dynamic support.
Cup Formation in Progress:
The stock appears to be carving out a **classic Cup pattern**, which is a well-known bullish continuation formation. This pattern suggests accumulation and potential for a significant breakout move.
Price Targets & Projections
Based on the technical structure, here are the potential price targets:
Target 1: 155.61 (Higher High breakout level)
Target 2: 169.15
Target 3: 195.79
These targets are derived from the pattern structure and represent key resistance zones where profit-taking may occur.
Trading Strategy Considerations
For Swing Traders:
- Current levels offer a potential entry opportunity for medium to long-term positions
- A move above ₹140 could confirm the continuation pattern
- Stop loss can be placed below the recent higher low at 122 for risk management
Risk Factors to Monitor
- Failure to hold above ₹122 would invalidate the bullish hidden divergence
- Breakdown below the rising wedge support would change the outlook
- Sector performance and broader market conditions should be monitored
- Steel industry fundamentals and commodity price trends
🔔 Conclusion
SAIL is exhibiting strong technical characteristics with the Hidden Divergence pattern, sorted EMA structure, and cup formation all pointing toward potential upside. The current price action within the rising wedge presents an interesting risk-reward setup for traders and investors with appropriate risk management.
DISCLAIMER
This analysis is for educational and informational purposes only and should NOT be considered as investment advice or a recommendation to buy, sell, or hold any securities. - I am not a SEBI registered analyst or investment advisor - This is purely a technical analysis based on chart patterns and indicators - Past performance and technical patterns do not guarantee future results - Trading and investing in stocks involves substantial risk of loss - Always conduct your own research and due diligence before making any investment decisions - Consult with a qualified financial advisor before taking any investment positions - The author holds no responsibility for any profits or losses incurred based on this analysis - Risk management and position sizing are crucial - never invest more than you can afford to lose
**Trade/Invest at your own risk. Do your own analysis.**
#SAIL #SteelAuthorityOfIndia #StockMarket #TechnicalAnalysis #NSE #IndianStocks #ChartAnalysis #TradingView #StockTrading #HiddenDivergence #CupPattern #PriceAction #SwingTrading #Investing #MarketAnalysis #SteelSector #Commodities #TradingStrategy #ChartPatterns #TechnicalIndicators
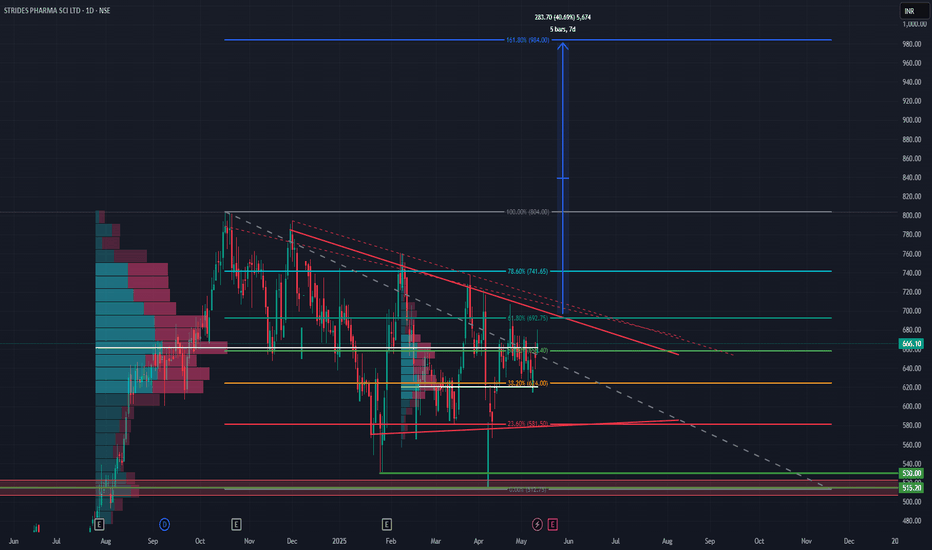
Strides Pharma - Volumes Backing a Breakout?Daily Timeframe Analysis
The setup is heating up and now we’ve got volume profile data to back it. The price is hovering around ₹666.10, and it looks like it's building strength for a bigger move.
🔹 Key Observations:
Price is compressing under a falling trendline (descending triangle or wedge).
Strong volume node around the ₹650–₹675 zone. This means a lot of trading activity happened here — a key decision area.
Fibonacci projections suggest targets as high as ₹984.00, which is a +40% upside.
Breakout confirmation above ₹692.75 (61.8% level) can trigger a rally.
🔹 Important Levels:
📍 Resistance: ₹692.75 → ₹741.65 → ₹804.00 → ₹984.00
📉 Support: ₹624.00 → ₹581.50 → ₹530.00 → ₹515.20
📊 Volume Insight:
The visible range volume profile shows most trading volume has happened below the current price, which is bullish. If the price breaks above the current squeeze, it might fly with less resistance overhead.
🧠 Thought:
This chart is a coiled spring. If bulls push above ₹692 with momentum, this might become a quick swing to ₹740+, and maybe more in the short to medium term.
📝 #StridesPharma #BreakoutSetup #VolumeProfile #SwingTrade #IndianStocks
Rising Wedge - Bearish setup🔎 Overview
The Rising Wedge is a price structure that develops during an upward phase where price continues to make higher levels, but the rate of advance gradually slows. The narrowing structure reflects weakening participation as price moves higher, often signaling exhaustion rather than strength.
------------------------------------------------------------
📘 Concept
A Rising Wedge is formed when price creates Higher Highs (HH) and Higher Lows (HL) inside a tightening upward channel.
Although price is still moving upward, each push higher covers less distance, indicating fading momentum and increasing imbalance between effort and result.
------------------------------------------------------------
📊 Chart Explanation
1️⃣ Higher Highs & Higher Lows
Price initially forms HH and HL, confirming an established upward structure and buyer control in the early phase.
2️⃣ Narrowing Upward Channel
The distance between highs and lows contracts as price rises, showing slowing momentum and reduced follow-through at higher levels.
3️⃣ Consolidation Near the Upper Range
Price pauses and compresses near the upper boundary of the wedge, highlighting balance and short-term indecision.
4️⃣ Momentum Weakening
Repeated tests near the upper boundary fail to generate strong expansion, indicating declining buyer participation.
5️⃣ Structural Shift Confirmation
• Weakening buyer strength becomes visible as price struggles to hold higher levels.
• Successive candle closes below the lower wedge trendline confirm a structural shift and validate the bearish reversal.
------------------------------------------------------------
📝 Summary
Rising Wedge reflects slowing upside momentum within an upward structure.
Price compression signals exhaustion rather than continuation.
Consolidation near the top highlights market indecision.
A confirmed close below the lower wedge line marks the directional shift.
------------------------------------------------------------
⚠️ Disclaimer
📘 For educational purposes only.
🙅 Not SEBI registered.
❌ Not a buy/sell recommendation.
🧠 Purely a learning resource.
📊 Not Financial Advice.
Sensex - Expiry day analysis Dec 17The price faced resistance from the 84900 zone and fall towards the support at the 84500 zone. It broke 84500, and the bulls came to push the price up. This movement has formed a falling wedge pattern. The pattern is bullish, but the opening strength will decide the trend direction.
The daily chart clearly shows how the price is facing resistance from the channel and is still bearish.
If the price opens flat, buy above 84540 with the stop loss of 84400 for the targets 84660, 84780, 84960, 85080 and 85200.
84900, 85000 can act as resistance. If the price opens gap up at resistance levels and shows bearish strength, the falling wedge pattern won't work.
If the price opens below 84500 and shows bearish strength, sell below 84240 with the stop loss of 84400 for the targets 84100, 83960, 83800 and 83660.
Always analyse the market before taking any trade.