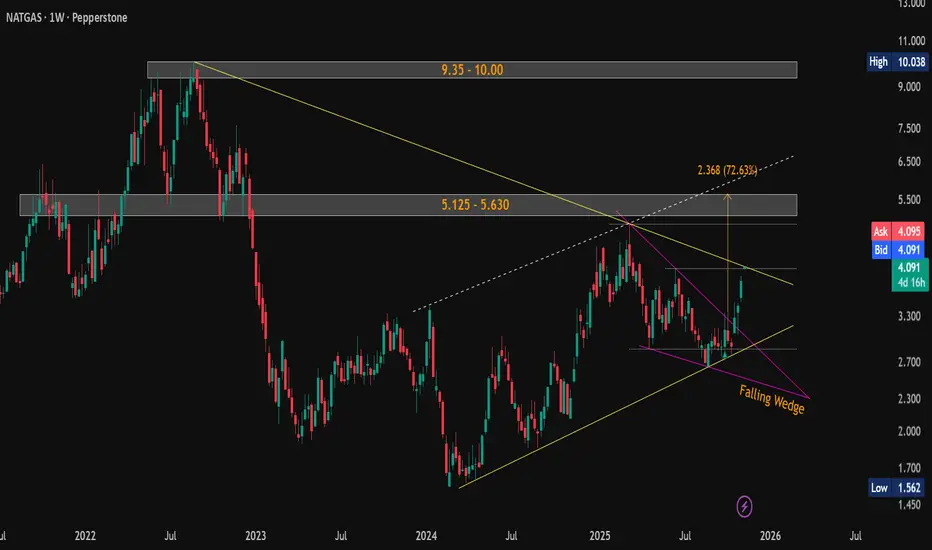
Short
Short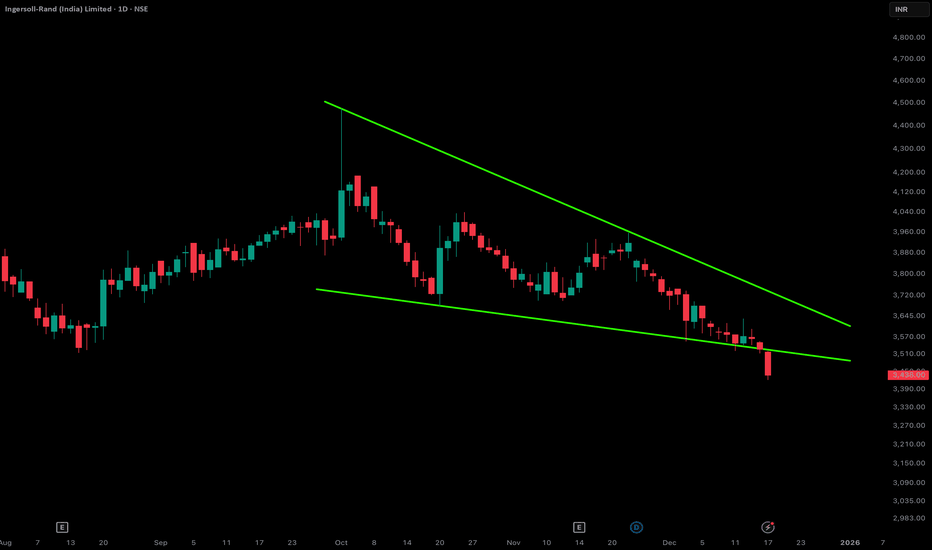
 Long
Long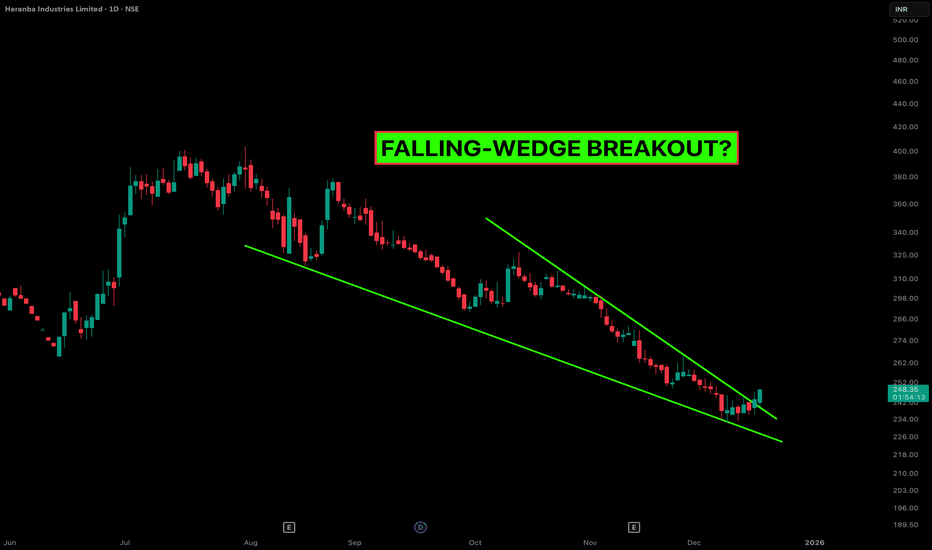
 Long
Long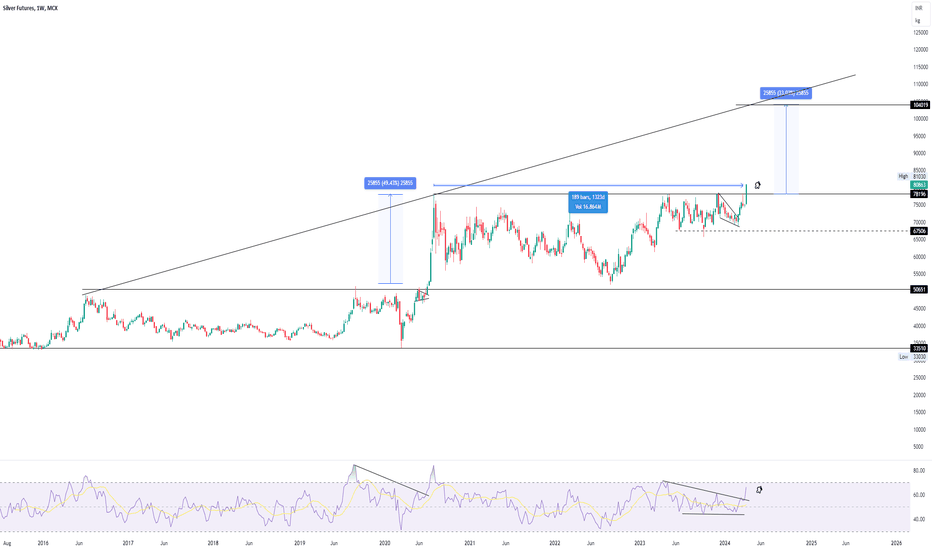
 Short
Short
 Short
Short
 Long
Long
 Short
Short
 Long
Long
GOLD – 4H | Falling Wedge Structure Near BreakoutGold has been compressing inside a converging falling wedge , a pattern that typically signals waning bearish pressure and an upcoming bullish break. The structure has been developing for several weeks, with each swing clearly showing a loss of momentum from sellers and a stronger defense from buyers at progressively higher lows.
The wedge is now approaching its apex, and price is pressing against the upper boundary. While this setup carries a bullish tilt, confirmation is still critical before acting.
Why this structure matters
This is a Converging Falling Wedge (Bullish) pattern, defined by:
Sellers losing momentum on each downswing
Buyers defending higher lows , tightening the structure
Compression building toward the apex , creating stored energy
Breakouts typically hitting the upper rail first
Confirmation occurring only on a close above the last swing high
In this case, the last swing high sits at 125,521 , aligning perfectly with the wedge’s upper rail.
Only a sustained 4H close above 125,521 would confirm that the market has absorbed overhead supply and is ready to transition into a higher timeframe move.
RSI Check
RSI is trending higher but hasn’t yet signaled full breakout momentum. A push above the 60–65 zone would strengthen the bullish case and support continuation after the breakout.
Trade Plan
Trigger :
Entry only on a sustained 4H close above 125,521 .
This keeps you aligned with pattern confirmation and avoids premature entries inside compression.
Upside path:
A breakout could initially retest the wedge boundary before starting the projected upward leg toward higher resistance zones.
Summary
Gold is displaying a well-defined falling wedge with clear signs of seller exhaustion and buyer strength. The structure leans bullish, but the move needs to be validated through a confirmed break above 125,521 . Until then, the wedge remains a compression zone — not a breakout.
Disclaimer: This analysis is for educational purposes only and does not constitute investment advice. Please do your own research (DYOR) before making any trading decisions.  Long
Long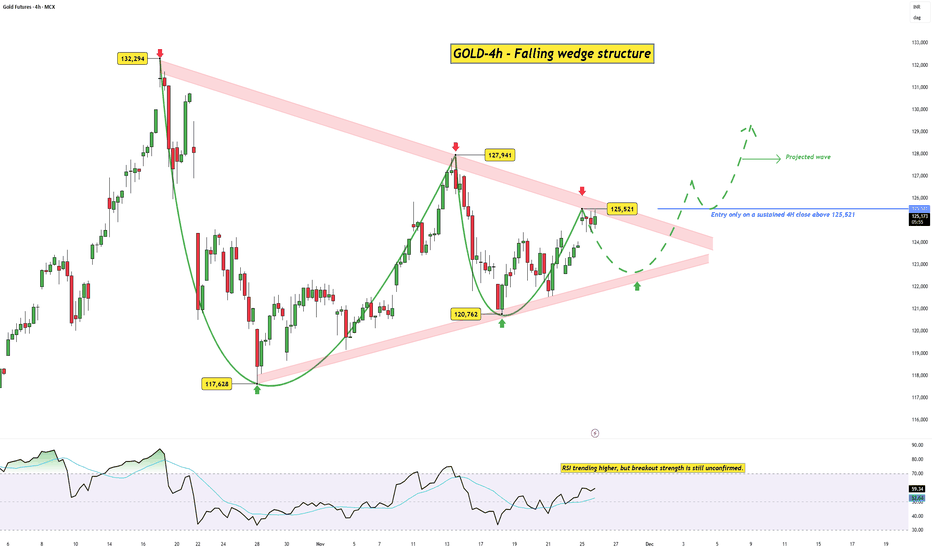
 Short
Short
 Long
Long
 Long
Long
Nestle India – Retest Before the Final Push HigherNestle India appears to be unfolding a clean five-wave impulsive structure. After a powerful Wave 3 rally backed by strong volume expansion, the stock has entered a typical mid-trend pause — a falling wedge consolidation representing Wave 4.
The correction has so far retraced near the 0.382 Fibonacci level around ₹1,247, perfectly aligning with the prior breakout zone from Wave 1 highs. This overlap suggests that the current dip is more of a healthy retest than a trend reversal.
As long as the price action holds above ₹1,238.20, the bullish structure remains valid. A breakout above ₹1,311 — the Wave 3 high — would likely trigger Wave 5, opening room for upside continuation toward the ₹1,340–₹1,360 zone.
Both the 100-day and 200-day SMAs are sloping upward, reinforcing the medium-term bullish bias. Meanwhile, RSI remains steady in the 60 range, showing no signs of exhaustion — exactly what you want to see before a possible Wave 5 extension.
In short: the setup is healthy, confluence is strong, and risk is clearly defined. A decisive move above ₹1,311 could mark the start of Nestle’s next leg higher.
Invalidation: Below ₹1,238.20
Bias: Bullish continuation (Wave 5)
Timeframe: Daily
Disclaimer: This analysis is for educational purposes only and does not constitute investment advice. Please do your own research (DYOR) before making any trading decisions.  Long
Long
Jio Financial Breakout Watch –Wedge Setup Points to ₹356+ TargetJio Financial Services is currently presenting an exciting opportunity on the charts, with a wedge breakout setup forming after months of consolidation. A wedge is a bullish pattern that typically signals a reversal or continuation of an uptrend, especially when supported by rising volumes and strong market sentiment.
The price has been compressed within a narrowing wedge since August, bouncing between a down-sloping resistance zone and a strong ascending support zone. Each dip has been met with higher lows, indicating strong accumulation near the base of the wedge. The recent price action around ₹300 shows a strong bullish candle attempting to break out of the wedge resistance — a sign of growing buyer interest.
What strengthens this setup is the support confluence with 200 EMA and the lower wedge support. The 200 EMA near ₹299 has particularly held firm, and the breakout is emerging just above it — a healthy technical signal.
If the breakout sustains, we can expect a multi-leg bullish move with:
Target 1: ₹315+
Target 2: ₹340+
Final Target Projection: ₹356+
These targets are calculated based on the height of the wedge, which is then projected upwards from the breakout point. The price structure suggests a potential for an impulsive rally once the wedge breakout is fully confirmed on daily closing.
On the downside, a strict stop loss below ₹292 has been defined — any close below this zone would invalidate the bullish pattern and suggest a deeper retracement. This stop aligns just beneath the key support zone, keeping the risk-reward ratio favorable for positional traders.
In conclusion, Jio Financial is at a critical technical juncture. A confirmed breakout above the wedge could unlock substantial upside toward ₹356+, while maintaining disciplined risk management below ₹292 remains essential. Watch the breakout candle and follow-up volume closely — it could be the start of a new trend leg.  Long
Long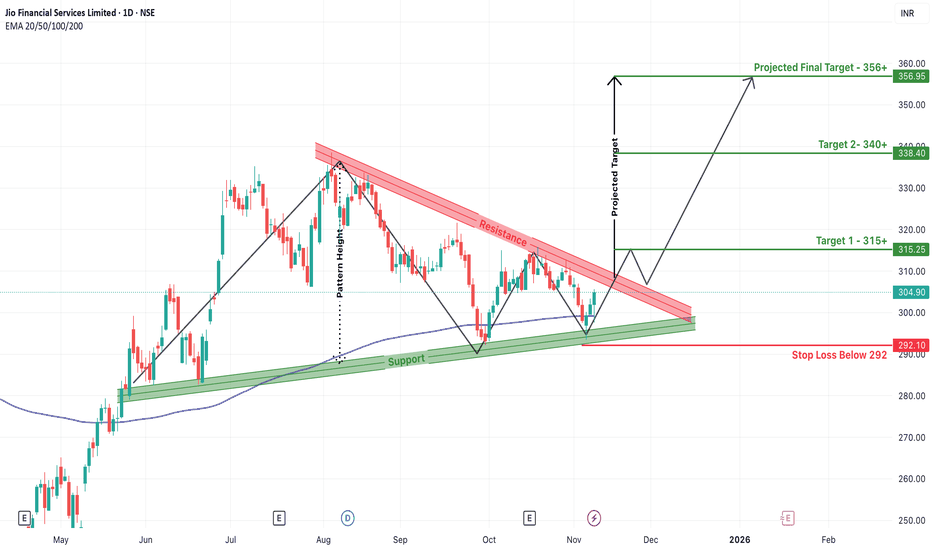
Long 
CDSL Breakout from Falling Wedge – Can It Rally to 1830+?CDSL has recently broken out from a classic falling wedge pattern, a bullish technical setup that often signals a trend reversal or continuation of the broader uptrend. After months of being compressed between a descending resistance and a well-established support line, the stock has now pierced through the upper resistance zone with notable bullish momentum.
The wedge had formed over several months, creating lower highs and relatively equal or slightly rising lows. The pattern was further supported by a confluence with the 200 EMA, which acted as a critical dynamic support near the breakout zone. This alignment of technical indicators added strength to the breakout confirmation seen recently.
With this breakout, CDSL has now opened doors for higher targets. The immediate Target 1 is set at ₹1650, which also aligns with a recent horizontal resistance zone. Once this is breached, the next move could extend toward Target 2 at ₹1750, a level where previous price action has shown hesitation. If momentum continues to build and the broader market supports the move, the final projected target of ₹1830+ becomes achievable in the short to medium term.
However, it’s crucial to note that the support zone below ₹1480 is acting as a critical invalidation point for this bullish setup. Any strong breakdown below this zone, especially with volume, would fail the bullish structure and may push the stock back into consolidation or a deeper correction. Traders must also watch the red dotted trendline, which represents a former resistance turned possible retest zone.
Overall, the technical landscape is now favoring the bulls, especially after the breakout confirmation and support from the 200 EMA. Traders and investors should monitor price action near the projected levels and manage risk accordingly, while riding the momentum above the wedge resistance.  Long
Long
 Short
Short
Chart Analysis: XRP / USDT (Daily Timeframe)Pattern: Demand Zone Rebound (Bullish Recovery Setup)
The chart shows XRP bouncing from a strong demand zone, signaling a potential short-term reversal after recent selling pressure. The price action suggests that buyers are gradually regaining control, with momentum shifting upward toward key resistance levels.
Key Observations
🔹 Demand Zone: Around $2.10 – $2.20, acting as strong accumulation support where buyers previously stepped in.
🔹 Immediate Resistance: Supply zone near $2.90 – $3.00, expected to be the next major barrier.
🔹 Targets:
🎯 Target 1: $2.52 — first resistance test after bounce.
🎯 Target 2: $2.72 — extension move toward supply zone.
🔹 Bull Bear Power (BBP): Currently improving from the negative region (-0.11), suggesting weakening bearish strength and a potential bullish transition.
🔹 Structure: Price forming higher lows after a deep retracement, indicating renewed accumulation and possible trend reversal setup.
Potential Move
If XRP sustains above $2.20, bullish momentum could drive a move toward the $2.50 – $2.70 range.
Failure to hold this demand zone, however, may trigger a retest toward $2.00 support.
Summary:
XRP is showing early signs of a bullish reversal from a major demand zone. Momentum indicators hint at a possible shift toward the upside, with targets near $2.52 and $2.72 if buyers maintain control.
#coinpediamarkets #XRP #Ripple #XRPUSDT #CryptoAnalysis #TechnicalAnalysis #CryptoTraders #CryptoMarket
BRITANNIA - Falling Wedge + Bullish Engulfing Combo💹 Britannia Industries Ltd (NSE: BRITANNIA)
Sector: FMCG | CMP: ₹5,892.50 | View: Falling Wedge + Bullish Engulfing Reversal Setup
📊 Price Action:
Britannia is currently displaying a strong confluence setup where both a chart pattern and a candlestick pattern align perfectly to signal a potential trend reversal.
After weeks of consolidation within a downward-sloping structure, the stock has formed a Falling Wedge pattern — a classic bullish reversal formation.
Adding strength to this structure, a Bullish Engulfing Candle on 4 Nov 2025 emerged from the wedge’s lower boundary, confirming buyer dominance and hinting at a near-term trend reversal.
📉 Chart Pattern Analysis – Falling Wedge (Bullish Setup):
The Falling Wedge pattern is marked by two converging downward trendlines, each connecting a series of lower highs and lower lows.
This structure reflects seller exhaustion and early buying interest.
Britannia’s wedge formation is now reaching its apex, where breakout probability is highest.
Volume contraction throughout the wedge also supports the notion that supply is drying up, preparing for a breakout above the upper trendline.
📈 Candlestick Pattern – Bullish Engulfing Confirmation:
The Bullish Engulfing Candle formed on 4 Nov 2025 precisely at the lower support line of the wedge, validating the pattern with strong timing. It represents a shift in control from sellers to buyers, with the green candle completely engulfing the prior red body. Volume expansion on that session further confirmed active participation by institutions ahead of the upcoming news catalysts. This one-day reversal candle acts as the first technical confirmation, while a breakout above the upper trendline will serve as the structural confirmation for the wedge pattern.
📏 Fibonacci Analysis:
From swing low ₹5,298 to swing high ₹5,930:
78.6% retracement @ ₹5,795 → Key reversal level defended.
61.8% retracement @ ₹5,888 → Currently reclaimed zone.
100% extension @ ₹5,930 → Short-term breakout threshold.
The Fibonacci structure aligns beautifully with the wedge’s geometry, implying that the reversal zone is complete and buyers are regaining momentum.
🧭 STWP Support & Resistance:
Resistances: ₹5,940 | ₹5,987 | ₹6,055
Supports: ₹5,825 | ₹5,775 | ₹5,710
The ₹5,775–₹5,825 range is acting as a high-confidence accumulation base, while ₹6,090–₹6,150 represents the key breakout trigger zone.
📊 STWP Volume & Technical Setup:
Volume on 4 Nov surged to 363.4K vs 248.7K average, confirming institutional interest at lower levels. VWAP recovery and improving RSI (47→52+) show that momentum is gradually returning.
MACD is approaching a bullish crossover, while Stochastic and CCI have both turned upward — all aligning with a reversal confirmation setup.
Trend Direction: UPTREND (Transitioning) | Volume Confirmation: Possible Accumulation in Progress
🧩 STWP Summary View:
Final Outlook:
Momentum: Strengthening | Pattern: Falling Wedge + Bullish Engulfing | Risk: Moderate | Volume: Increasing
Britannia’s technical structure now showcases dual confirmation — a chart pattern (Falling Wedge) supported by a candlestick reversal (Bullish Engulfing).
This confluence enhances the reliability of the reversal signal and increases the probability of an upside breakout. As long as the price holds above ₹5,825, the bias remains bullish with potential continuation toward ₹6,150–₹6,250.
⚠️ Disclosure & Disclaimer – Please Read Carefully
This analysis is for educational purposes only and should not be treated as financial or investment advice.
I am not a SEBI-registered investment adviser. All views are based on technical observations and publicly available information.
Trading involves risk; please assess your financial suitability, position size, and stop-loss levels before entering any trade.
Always consult a SEBI-registered financial adviser for personalized guidance.
Position Status: No active position in (BRITANNIA) at the time of this analysis.
Data Source: TradingView & NSE India
💬 Found this useful?
🔼 Give this post a Boost if you value clean technical confluence studies.
💭 Comment your thoughts — does this wedge-breakout setup look convincing to you?
🔁 Share this post to help others understand pattern + candlestick synergy.
👉 Follow for more institutional-style technical breakdowns built on clarity and patience.
🚀 Stay Calm. Stay Clean. Trade With Patience.
Trade Smart | Learn Zones | Be Self-Reliant 📊  Long
Long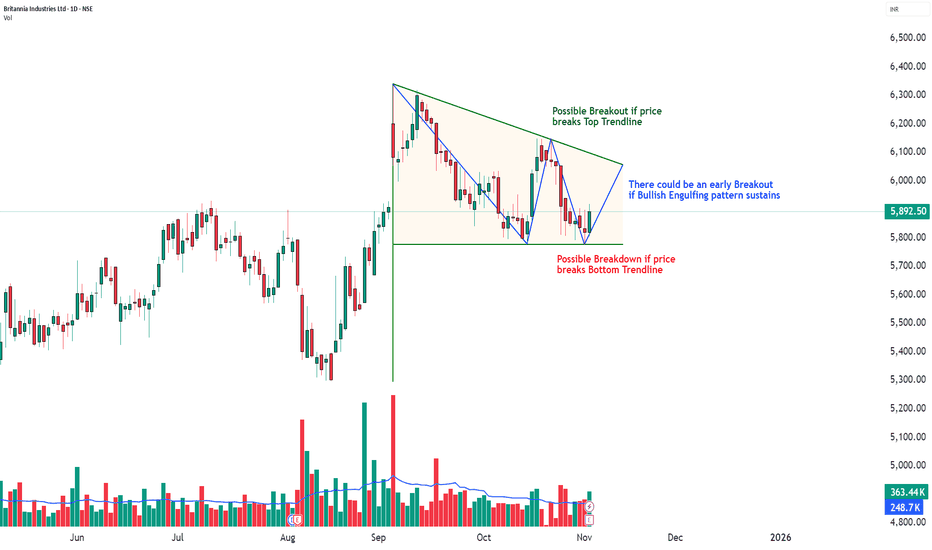
Hero MotoCorp: Wedge Signals Wave 5 ExhaustionAfter a strong five-wave impulse from ₹3,344 to ₹5,717, Hero MotoCorp appears to have completed a textbook rally, with Wave (5) showing all signs of exhaustion.
The final leg developed into a rising wedge , a common terminal pattern that often precedes short-term pullbacks. Momentum loss is also visible on the RSI , which has been forming lower highs within a descending channel — a classic sign of fading strength.
From an Elliott Wave perspective, the advance from Wave 4 (₹4,195) to Wave 5 (₹5,717) aligns closely with the 1.0 Fibonacci projection of internal Wave (1), suggesting a complete internal impulse.
Should a correction unfold, the 0.382–0.5 retracement zone (₹4,810–₹4,530) — measured from the entire rally (₹3,344–₹5,717) — could become a potential accumulation area for the next bullish sequence (Wave 2 or B).
Summary :
Wave 5 likely completed inside a rising wedge
RSI bearish divergence confirms exhaustion
Next potential buy zone: ₹4,810–₹4,530
Structure remains bullish over the long term, but a short-term correction looks due
Disclaimer:
This analysis is for educational purposes only and does not constitute investment advice. Please do your own research (DYOR) before making any trading decisions.  Short
Short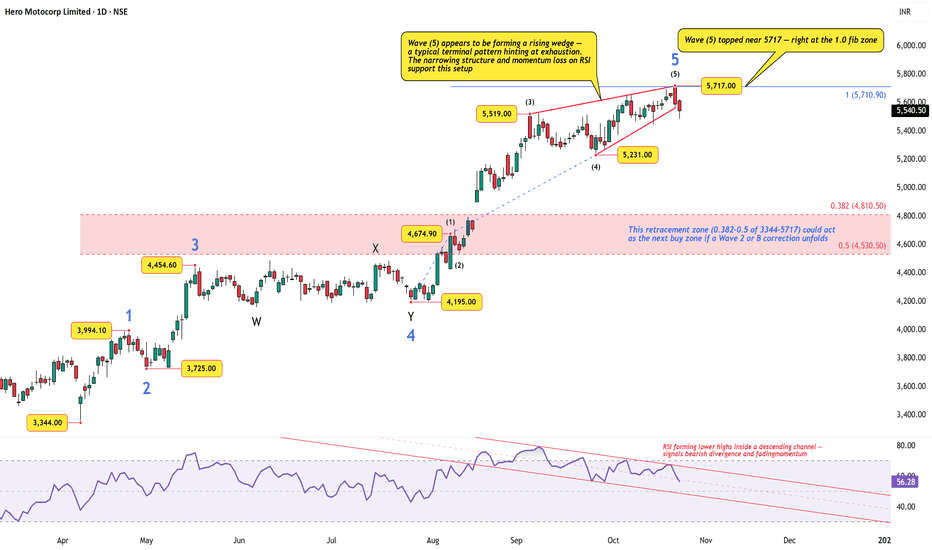
Nifty - Weekly Review Nov 3 to Nov 7Nifty in the lower time frame has formed a falling wedge, which is a bullish sign and also price is at the important crucial zone 25700. In the daily time frame, the price is showing bearish strength.
If the price breaks the 25680 - 25720 zone with bearish strength, 25500 can be tested.
Buy above 25740 with the stop loss of 25690 for the targets 25780, 25840, 25900, 25940, 25980, 26040 and 26080.
Sell below 25640 with the stop loss of 25690 for the targets 25600, 25560, 25520, 25460, 25400, 25360 and 25320.
Important levels to watch are 25500, 25700 and 25900 zones.
Always do your analysis before taking any trade.