UPL Rising wedge analysis. Bullish trap possibleChart analysis:- UPL
Broadening wedge pattern
This pattern may look bullish, but it has hidden bearish signs:-
1. Buyers' exhausting action. Failing to make new highs and breaking out of the last highs.
2. RSI is showing divergence. Price rising, but RSI is falling.
3. Long wicks on top showing selling pressure.
In such a case, we can see a pullback to the lower side of the wedge.
On the other hand, if it breaks out of 670, it will test the upper side of the wedge at around the 680- 685sh zo
Wedge
SHRIRAMFIN Swing Trade (14.6%)After forming a Head & Shoulder pattern, retail sellers got trapped and that becomes the liquidity for next up-move from the institutional demand zone. So the trend is up.
Recently good liquidity sweep happened which can fuel next up-move in short term.
With 1:3 Risk Reward and potential 14.6% up-move.
Only if Nifty holds current levels. ie it does not go below 22,700. Otherwise exit this trade.
Follow for more such setups, comment your thoughts.
BRIGADE – Falling Wedge at Demand Zone, Waiting for BOSSetup Type: Reversal + Breakout Play | Conviction: Medium-High (Needs Confirmation)
Chart Framework: Smart Money + Classic TA
BRIGADE is showing signs of a potential trend reversal, but we’re not jumping in yet. Here's what the chart tells us:
🟡 Falling Wedge Formation – A bullish reversal pattern that typically resolves to the upside.
🟢 Tapped into a Strong Order Block – Smart money territory where previous accumulation took place.
🧲 Liquidity Grab Below Prior Lows, but... Volume on Bounce
Tata Consumer Prod. - Chart of the WeekNSE:TATACONSUM has a beautiful structure in the Weekly Timeframe that qualifies for my Chart of the Week idea. It saw Decent Volumes this week and closed above its recent swing high, with RSI and MACD Trending Upwards and Closing Above all Major Moving Averages.
About:
NSE:TATACONSUM is one of the leading companies of the Tata Group, with presence in the food and beverages business in India and internationally. It is the second-largest tea company globally and has significant market presen
Rainbow Hospitals - Rising Wedge PatternRainbow Hospitals is making a Rising Wedge Pattern which is a bullish pattern and as per it we can expect Target of 2500+. Other factors:
1. One of the best Pediatric Hospital Chain in India.
2. Fundamentally strong stock with QnQ great results
3. Capacity expansion of 50%+ bed increase with state of art hospital in Gurgaon
4. Acquisition of hospitals in north east & Hyderabad
5. Technically a rising wedge pattern which is a bullish pattern
Based on fundamentals & technical analysis this stoc
Mankind Pharma - Breakout out of Falling Wedge PatternMankind Pharma is one of the 4 largest Pharma from domestic market perspective. It has fallen 30% from peak price, but has recently given BO from fallen wedge pattern. This looks a great stock:
1. 4 brands are having top market share and growing
2. First Co. to make oral anti-obesity medicine
3. Acquisition of BSV has made a very strong hold in women healthcare
4. Best YoY results with rising EPS
Technically also, Pharma sector looking strong and especially top 5 Indian Pharma Industry compan
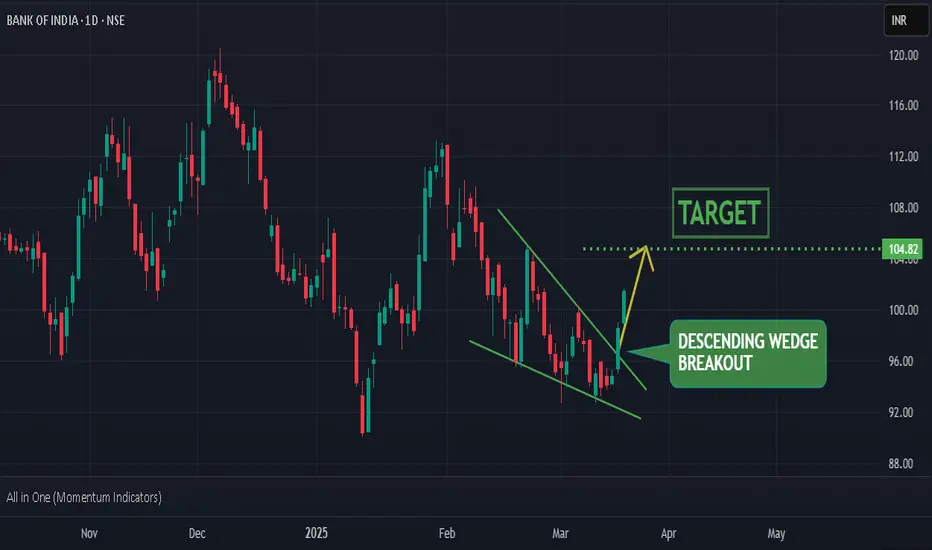
Bank of India : broken out of descending wedge pattern
DESCENDING WEDGE BREAKOUT -
the stock has recently broken out of a descending wedge pattern with strong green candlestick indicating strong upward momentum for the stock
REVERSAL FROM STRONG SUPPORT-RESISTANCE ZONE -
the stock has tested a very strong support-resistance zone several times and took reversal from it
XLM super bullish pattern with base formationSolid price action formation in XLM token. 4h 12h daily TF looking super bullish with good base formation(accumulation). Breakouts must happens in smaller time frames to conquer the next levels. Target is like 50% 100% upside. Keep this coin in your watch list.
USDJPY bearish signsUSDJPY might start the solid downtrend. Gradually falling down with falling wedge pattern breakdown. But dont get fooled and short immediately. It will give one healthy bounce too for the 0.23 fib levels as RSI also suggesting bit of oversold zone here, if it has to fall it will give one technical bounce. We have to observe it there closely if it rejects there or sustains above it. But as per my analysis slowly now trend is becoming bearish as per the weekly & daily chart analysis. As there is d
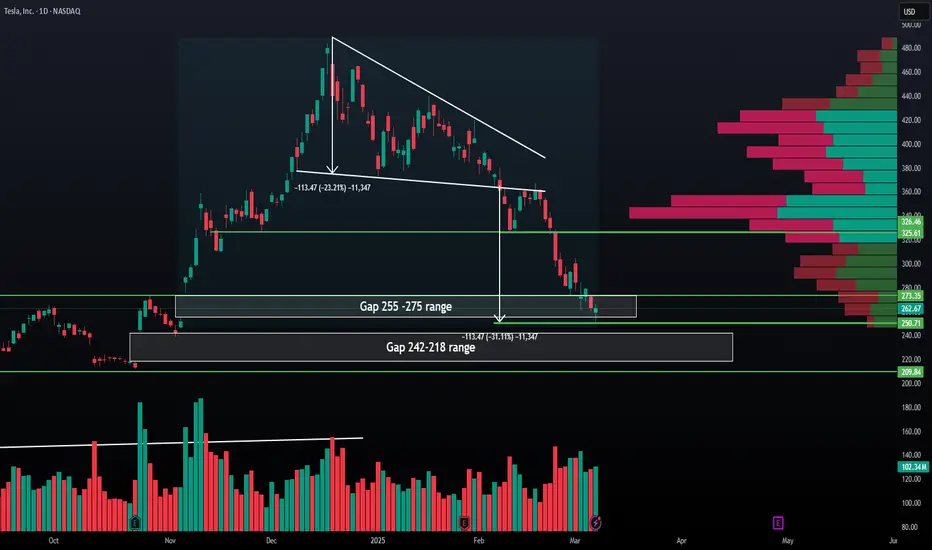
TSLA Chart analysis -Daily Falling wedge BreakDown Target doneThis is a daily candlestick chart of Tesla Inc. (TSLA) with some technical analysis annotations. Here’s a breakdown of the key insights:
### **1. Price Action and Pattern:**
- The chart shows a descending triangle pattern that broke downwards.
- After breaking down from the triangle, the price dropped by **-113.47 points (-31.11%)** from the breakdown point.
---
### **2. Key Gap Zones:**
- ✅ **Gap 255 – 275 Range**
- Price recently filled or tested this gap zone.
- Currently consolida
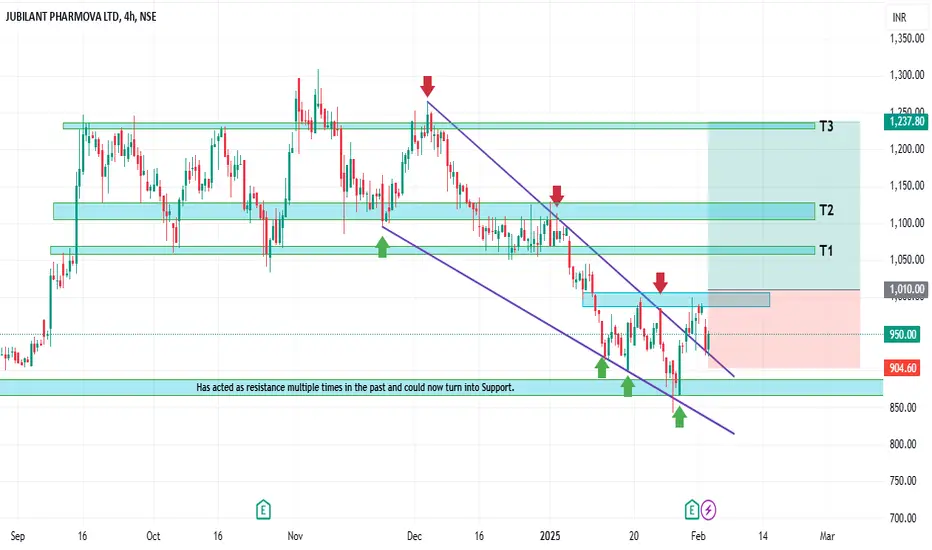
JUBLPHARMA Ready for an Up Move?Hello fellow traders, I hope you are all doing well.
Key Observations:
1. Strong Support Zone: JUBLPHARMA has reached a strong zone that previously acted as resistance and could now turn into support.
2. Chart Pattern: A falling wedge pattern is visible, which is typically a bullish reversal signal. We can also see that the breakout has already happened and now the price has come to retest.
3. Bullish Engulfing Candle: On the weekly time frame, we see buying pressure emerging, conf
The Falling Wedge Pattern: A Guide to Catching Bullish BreakoutsFalling Wedge Pattern: A Continuation Chart Pattern
Hello Traders!
In today's post, we’ll explore the Falling Wedge Pattern , one of the most reliable continuation patterns that traders look for during uptrends. It’s an important tool for identifying potential breakout points in trending markets. If you want to learn how to trade these breakouts effectively, mastering the Falling Wedge is essential.
The Falling Wedge pattern typically forms during an uptrend and consists of convergin
Nifty!Nifty Simple Explanation
Falling Wedge Formation: The chart shows a falling wedge pattern, which often signals a potential bullish reversal if the price breaks above the upper trendline.
Order Block (₹24,500–₹25,000): This zone represents strong supply or resistance. If the stock rallies, it may face selling pressure here, but reaching this area could mean a gain of about 28–30% from current levels.
Breakout vs Breakdown:
Breakout above the wedge indicates renewed buying interest and
NIFTY: At a Crucial Junction After a 13% Correction Topic Statement:
NIFTY has corrected 13% from its highs of 26,277 and is now trading within a converging pattern, where a breakout will determine the market’s next major move.
Key points:
1. The price is taking support on the long-term up trendline.
2. The price faces resistance as it approaches the short-term down trendline.
3. The two trendlines form a wedge, and a breakout from this pattern will decide the market’s direction.
SHAHALLOYS: Signs of Reversal?Hello fellow traders,
I hope everyone is doing well.
Please find my analysis for SHAHALLOYS below:
Key Observations:
1. Reversal from Support Zone: SHAHALLOYS appears to be reversing from a key support area.
2. 200 Weekly EMA Support: The price seems to be holding around the 200 Weekly EMA, indicating potential strength.
3. Chart Pattern: A falling wedge pattern is visible, which is typically a bullish reversal signal. The breakout and subsequent retest have already occurred.
4.
NIFTY 50 I Falling Wedge Pattern + Bulllish Divergence Nifty 50 Index is currently trading within a very important zone in simple words called area of interest Usually consisting of demand or supply zone. This level has acted as a solid base for the index.
The NIFTY 50 index presents a promising opportunity to initiate long positions at these levels (CMP23,000), Aligning well with the risk reward ratio and making it a favourable entry point for traders looking for Taking advantage of the upcoming trend.
The index has shown a pattern of formin
OMUSDT(mantra) strong upmove on chartsOMUSDT from the current levels very bullish. Targets wont come in one day but it will come. Follow the post. will keep posting the small small but good target trades based on daily price action. This is long long term view. Same kind of prediction i have done for XRP too and look at it 10 times move from there. Mantra OM is fundamentally strong coin too so dont ignore this view. Expecting atleast 200% return from here in this coin.
OLong
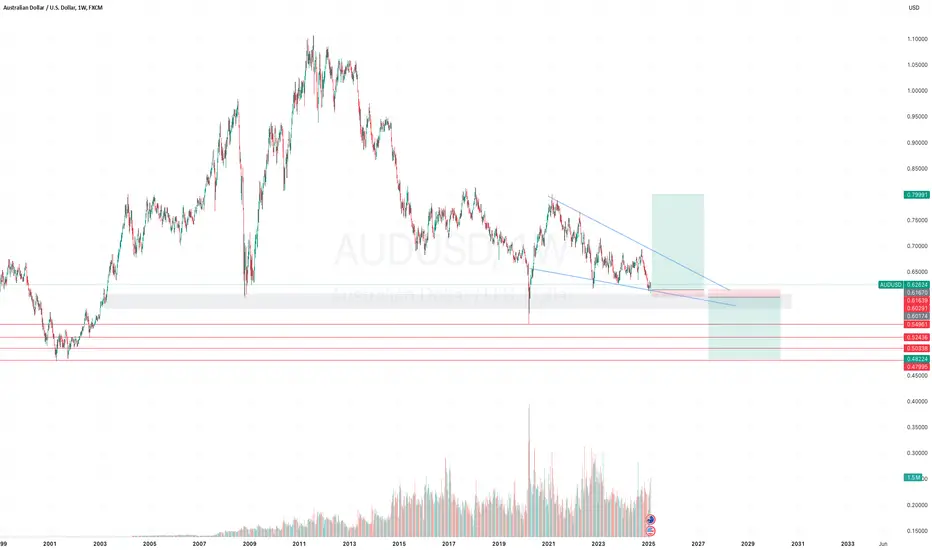
AUDUSD can move both side.AUDUSD current level should act as a support zone 0.62-0.58. If it breaks there will be massive downfall as per the pattern overview. 0.52 and 0.47 will be next stop. On contradiction there is also bullish wedge pattern forming which could also kill the sellers. One can easily try the big long with 2% SL & target above 10% 20%. If SL hit just reverse the position for bottom level liquidity targets. 0.54 0.52 0.47