The Complete Map of Trading TheoriesIntroduction: Why Do So Many Trading Theories Exist?
Markets are complex, so different theories try to explain different parts of price behavior. Some focus on trends, some on psychology, some on cycles, some on volume, and others on the relationship between different markets.
1. Classical Technical Analysis
1.1 Dow Theory
The foundation of modern technical analysis. It studies primary, secondary and minor trends, confirmation, volume and trend reversals.
1.2 Dow Confirmation Principl
Wyckoff
BTCUSD 4H:Don't Get Trapped at Range Highs!Market Context: Are We Distributing or Re-accumulating?
Bitcoin has spent the last two weeks building "cause" inside a clearly defined horizontal trading range between $75,500 and $81,239.
The recent push into $82,275 swept liquidity above the range highs, but failed to sustain buying momentum. If the current 4H candle fails to reclaim the broken range, this move fits the classic textbook profile of a Phase C Upthrust After Distribution (UTAD) designed to trigger breakout longs and trap retail
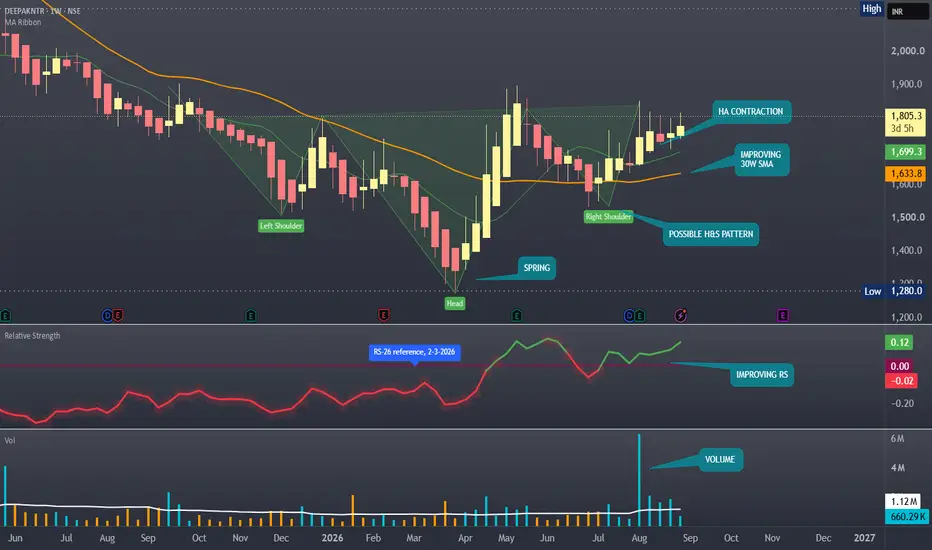
DEEPAKNTR : Stage 2 Breakout Brewing | Inverse H&S +Wyckoff DEEPAKNTR (NSE)Timeframe: Weekly Setup: Stan Weinstein Stage 1 Base Breakout / Wyckoff Accumulation Key Technical Observations: Inverse Head & Shoulders / Phase C Spring: Left Shoulder: Established near ₹1,550.Head (Spring): Deep shakeout down to ₹1,280.00, absorbing final retail panic. Right Shoulder (LPS): Well-supported above ₹1,600, respecting the rising moving average ribbon. Stage Analysis Alignment :The 30-week SMA (₹1,635 zone) has officially turned upward. Price is sustaining above key
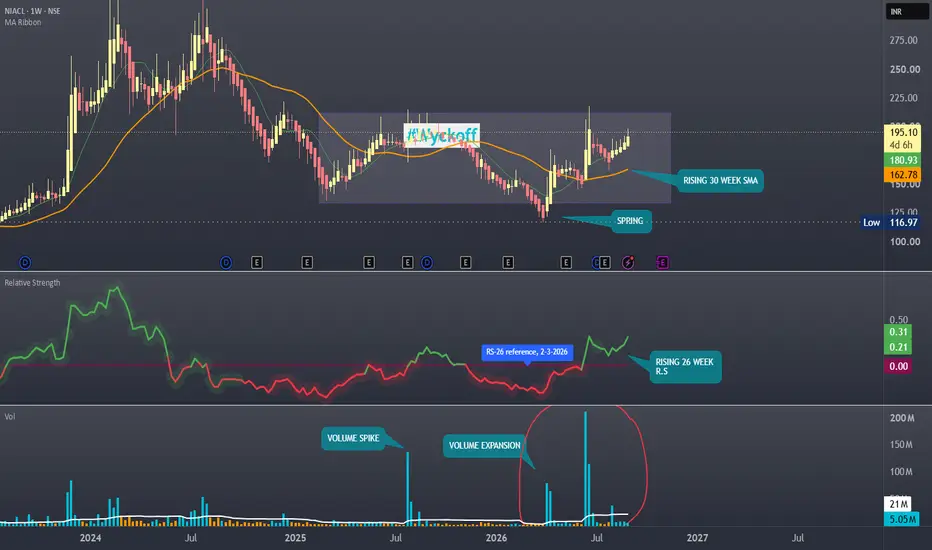
NIACL (Weekly): Wyckoff Spring + Stage 2 Breakout Setup BrewingAsset: NIACL (NSE)
Timeframe: Weekly
Methodology: Stan Weinstein 4-Stage Analysis & Wyckoff Accumulation Schematic
Technical Breakdown:
Stage 1 Base Completion: NIACL has been carving out a major accumulation base since late 2024. The 30-week Simple Moving Average (SMA) has flattened out and has now begun a clear upward trajectory at ₹162.80.
Wyckoff Spring Action: The dip to the ₹116.97 zone acted as a textbook Wyckoff Spring (Phase C), purging liquidity before buyers aggressively drove pr
Wyckoff Distribution - Market Structure ExplainedOverview
The Wyckoff Distribution phase typically develops after a sustained uptrend, where bullish momentum gradually weakens and price transitions into a period of sideways consolidation. During this phase, supply begins to outweigh demand as repeated rallies encounter selling pressure near resistance. The market remains range-bound until a confirmed breakdown signals the potential beginning of the Markdown Phase
------------------------------------------------------------------
Definit
NSE:KAYNES – VSA Analytical NoteTimeframe : Weekly Chart
VSA Observations
Key Institutional Level Cleared: Stock recently crossed the 126 EMA at 4200, a key institutional benchmark.
Current Bar: Strong result with average effort — supply reduced, demand picking up. High close confirms demand persisted until session end.
Accumulation Evidence: Last four bars show subtle institutional accumulation, marked by VSA potential buy signals. Strategy‑optimized PB (potential buy) adds confirmation.
Relative Volume: Consiste
XAUUSD - Bearish Structure Points to Further DownsideIn XAUUSD, Selling targets are 4650 - 4560 - 4465 . Before taking any action, read the analysis below for context and confirmation. Take it as a channel breakdown setup in the initial phase.
XAUUSD is moving inside a rising structure but is starting to lose momentum near the upper boundary. The recent highs are weakening, and the gold is struggling to hold above the mid-range. Immediate focus is on the support zones marked as S1 and S2, as a break below these can trigger a sharper downside mov
Smart Money Leaves Footprints. Just Need to Know Where to LookSmart Money Leaves Footprints. You Just Need to Know Where to Look.
Before every major rally, the same pattern appears. Quiet accumulation. Low volume. Boring price action. And then — the explosion.
Here is a question: if you were managing ₹10,000 crore and wanted to buy a stock, how would you do it? You could not buy ₹10,000 crore in one day — you would move the price against yourself so severely that you would end up paying far more than you intended.
Instead, you would buy quietly. Smal
Wyckoff accumulation breakout - Phase E in daily time frameThe stock is under accumulation in weekly timeframe and In phase D stage. Under timeframe, it’s moving out of accumulation and presently in phase E - Pull back to Creek zone. The breakout from this daily accommodation Leads the stock to phase D weekly accumulation zone. From that, the price is expected to reach Creek zone. The present price is ready for entry. Stoploss can be midpoint of daily accumulation zone.
ZYDUS Lifesciences - An Interesting ChartA good accumulation Range
A "SPRING" and a good up move
Relative strength positive
Money flow positive
Increased Buying Pressure
Good quarterly results
Now, A break out of the Accumulatio zone on increased volume. Also going past an old supply area of the BC bar.
Looks poised for a move to stage 2. Could also test the previous supply before further up move. Next couple of sessions would throw more light.
GoldGold ( OANDA:XAUUSD ) – Bearish Wyckoff Distribution (Unorthodox) in Play
Gold is currently trading around $3273/oz and appears to be in Phase D of a Bearish Wyckoff Distribution Schematic #1 (Unorthodox) on the 4H chart. The price is showing signs of weakness, but a final upthrust toward $3370 can’t be ruled out before a deeper breakdown.
Key level to watch:
⚠️ Breakdown confirmation below $3260–3200 could open the gates for a sharper decline.
Bearish structure still unfolding – traders shou
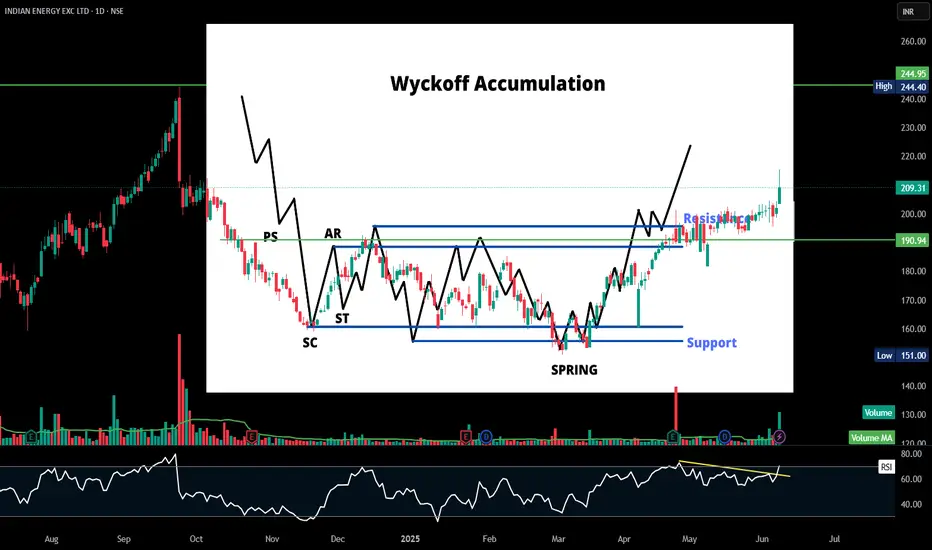
IEX | Consolidation BreakOut | DailyHere’s a **condensed Wyckoff Accumulation Analysis** based on your most recent chart for **Indian Energy Exchange Ltd. (IEX)**:
---
🔍 **Key Wyckoff Phases & Levels:**
* **PS (Preliminary Support):** Initial slowing of the downtrend.
* **SC (Selling Climax):** Sharp selloff forming the bottom.
* **AR (Automatic Rally):** First bounce confirming initial demand.
* **ST (Secondary Test):** Testing previous lows around SC.
* **Spring:** Fakeout below support, creating panic-selling before reversal
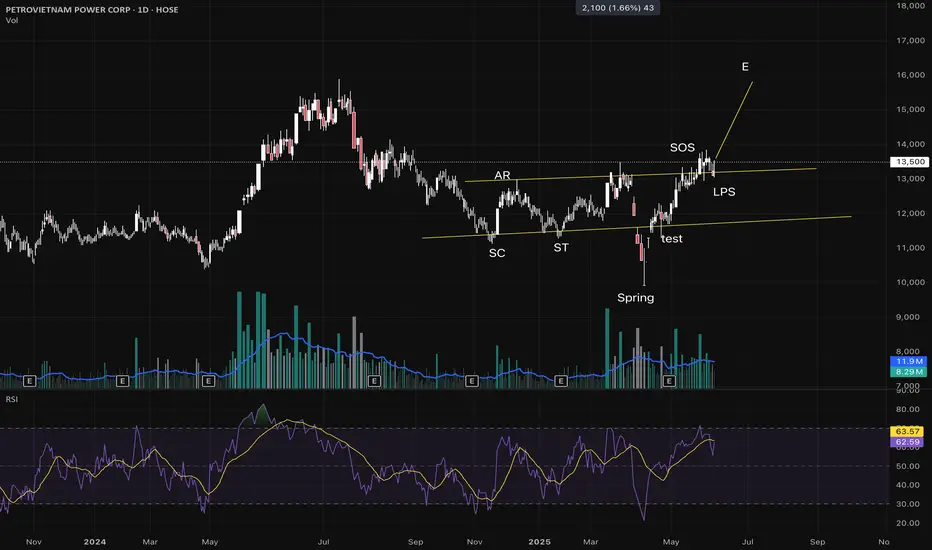
Buy POW - Entered Phase E of Wyckoff Cycle**Investment Idea: Buy POW - Entered Phase E of Wyckoff Cycle**
- **Stock**: POW (HOSE)
- **Wyckoff Analysis**: POW has completed Phases A-D and is now in Phase E, the markup phase of the Wyckoff cycle. Accumulation signs were evident in Phase C (Spring) with increasing volume and price stabilization.
- **Price Target**: 15 - 17 (based on previous resistance levels and potential upside in Phase E).
- **Entry Point**: Consider buying around the current price, ideally on a slight pullback t
CG POWER - A stock for your WatchlistHere is another stock for your watch list, this is CG power which has been consolidating for nearly 3 months in a typical Wyckoffian accumulation zone. Now it looks ready to move out of the zone and move up further. As you can see the buy waves are getting stronger and the relative strength and the money flow are all positive. However, we need to see more volumes coming in to fuel the up move and this has to cross above the important pivot of 685, then we could see at least another 20% up move.
HIL - Possible AccumulationMarkets can have three possible movements - Up Trend, Consolidation and Down Trend. Usually the sequence of these phases is Consolidation (Accumulation) --> Up Trend (Market Participation) -> Consolidation (Distribution) --> Down Trend (Market Participation). Some might even call these phases as phase 1, 2, 3 and 4.
HIL Looks in possible accumulation phase. This would be confirmed if price breaks the upper bound of the marked channels with strength.
I would buy any pullbacks after break or
HLong
asianpaintclearly someone is selling this stock in big quantity and making big exit.
stock is having distribution on daily chart and I don't rule out 2100
But pls be caution that wyckoff patterns takes lots of time and they are tough to trade considering the spikes in opposite direction of the trend.
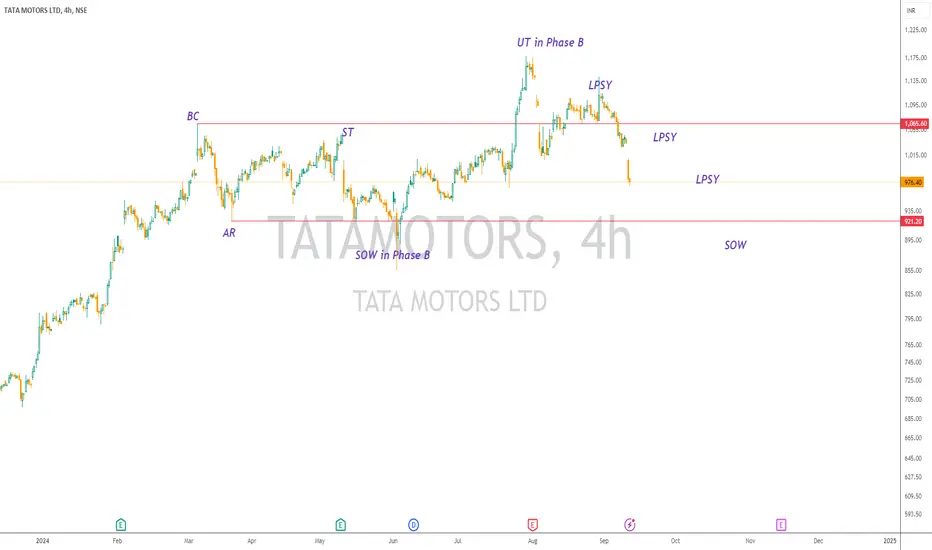
CESCCESC price distribution is happening on 4 hour chart. it may trying to bounce upto 210 and then next LPSY may be formed and give fresh round of selling.
But pls be caution that wyckoff patterns takes lots of time and they are tough to trade considering the spikes in opposite direction of the trend.
UPL | Wyckoff Events & Phases Explained Wyckoff developed a price action market theory which is still a leading principle in today's trading practice.
The Wyckoff method states that the price cycle of a traded instrument consists of 4 stages – Accumulation, Markup, Distribution, and MarkDown.
👉TEXTBOOK EXAMPLE Accumulation Schematic: Wyckoff Events and Phases👈
Price Action Analysis
And this is the accumulation stage -
1) PS— Preliminary Support, where substantial buying begins to provide pronounced support after a continue
LODHA Trade Analysis for Buy using Wyckoff methodWyckoff Story
Prior to trading range we were in uptrend and then we have Stoping action and CHoCH (Change of character). Let’s assume our bias is accumulation based on CHoCH as we don’t see lot of supply in the CHoCH.
Down wave Analysis
We can see that the volatility of the down wave is decreasing from Phase A to Phase D, confirming the accumulation Bias.
Volume Analysis
We have supply decrease from Phase A to Phase C indicating supply is being absorbed.
Sign of Strength
BPCL Trade Analysis for Buy using Wyckoff method.Wyckoff Story
Prior to trading range we were in uptrend and then we have Stoping action and CHoCH (Change of character). Let’s assume our bias is accumulation based on CHoCH as we don’t see lot of supply in the CHoCH.
Down wave Analysis
We can see that the volatility of the down wave is decreasing from Phase A to Phase D, confirming the accumulation Bias.
Volume Analysis
In Phase B we see increase in supply but the price is not able to go below the trading range, lot of effort