MACD Momentum Signals [TradingFinder] Trend Channel & Reversal
More exclusive indicators from TradingFinder
Subscribe to TFlab [TradingFinder] Pro Trading Toolkits for $48.88/month to get exclusive indicators by this author. You pay right on TradingView and can use them on your charts straight away.
Explore TFlab [TradingFinder] Pro Trading Toolkits🔵Introduction
The Moving Average Convergence Divergence (MACD) is one of the most widely used momentum indicators in technical analysis, helping traders identify changes in trend direction, momentum strength, and potential price reversals. The MACD calculation is based on the difference between two Exponential Moving Averages (EMA), typically the 12-period and 26-period averages. A 9-period Signal Line is then applied to the MACD Line, while the MACD Histogram represents the distance between them. When the Histogram expands above zero, bullish momentum is strengthening relative to the Signal Line; when it expands below zero, bearish momentum is gaining strength. Changes in the Histogram can also reveal when an existing price movement begins losing momentum.

However, a MACD crossover does not always represent a reliable buying or selling opportunity. During strong trends, bearish crossovers may appear while the broader market remains bullish, and bullish crossovers can occur during temporary corrections within a downtrend. In sideways markets, frequent MACD crossovers often produce conflicting trading signals without establishing a clear directional movement. Another challenge appears when price has already traveled a considerable distance from its average. Even when momentum remains strong, entering an extended movement can expose traders to unfavorable entry locations. For this reason, MACD momentum analysis becomes more meaningful when combined with price action, trend strength, and volatility-based price levels.
The combination of MACD Momentum Signals and a dynamic Trend Channel provides a broader perspective on these market conditions. Alongside the classic MACD oscillator, an EMA 200 Trend Channel uses Average True Range (ATR) to calculate five upper bands and five lower bands around the central moving average. These volatility-based bands help identify the position of price relative to its long-term average, distinguish normal price fluctuations from extended movements, and locate areas where bullish or bearish momentum may begin weakening. As market volatility increases or decreases, the distance between channel levels adjusts accordingly, allowing traders to evaluate price movements under changing market conditions.
The signal system combines MACD crossovers, momentum acceleration, trend quality, price confirmation, and channel interactions to identify different trading scenarios. Standard BUY and SELL signals focus on developing directional movements, while BUY+ and SELL+ signals highlight potential trend continuation opportunities following temporary corrections. Reversal signals examine price reactions around selected channel bands and changes in MACD momentum to identify possible turning points. By separating Momentum Shift, Trend Continuation, and Reversal setups, traders can interpret bullish and bearish signals according to the current market structure instead of relying on traditional MACD crossovers alone.
🔵How to Use
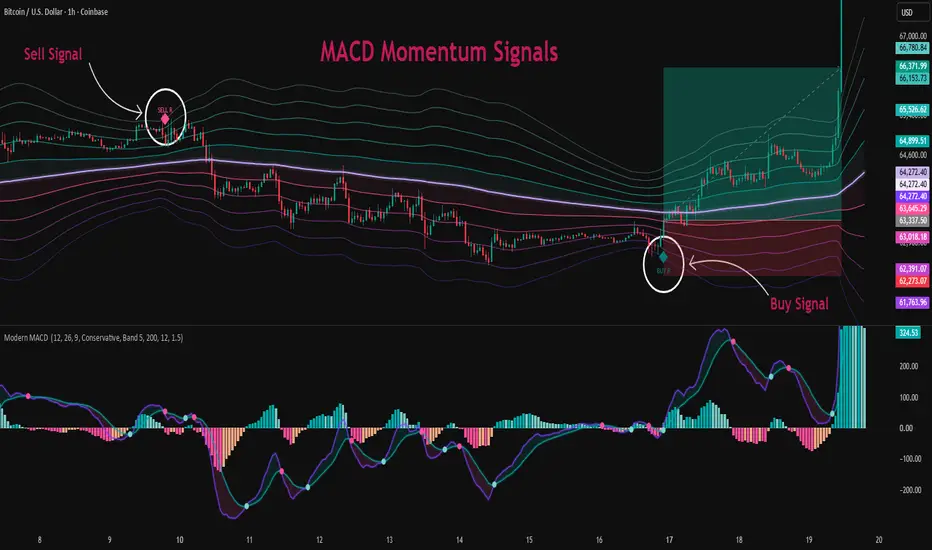
The MACD oscillator and the Trend Channel work together to evaluate both momentum and price positioning. The oscillator displays the MACD Line in purple and the Signal Line in turquoise, accompanied by a four-color MACD Histogram. Turquoise histogram bars indicate positive momentum, while pink bars represent negative momentum. Lighter colors highlight periods when momentum is weakening in its current direction. Cross points mark interactions between the MACD and Signal lines, while the shaded area between them provides an additional visual reference for momentum changes.
On the price chart, the 200-period EMA forms the center of the Trend Channel, with five ATR-based bands extending above and below it. The upper bands help measure bullish price extension, while the lower bands identify progressively deeper bearish price extensions. These levels can serve as dynamic reference zones for evaluating trend continuation, corrections, and potential reversals. The signal engine combines this information with MACD momentum, shorter-term trend conditions, price action, and directional quality. BUY and SELL signals appear as triangles, while BUY R and SELL R signals use diamond markers. To reduce entries after excessive price extensions, new BUY signals are restricted above the third upper band, and new SELL signals are restricted below the third lower band.
🟣Bullish Trend
BUY Signal
A BUY signal appears when bullish momentum begins developing and the price structure provides sufficient confirmation of an upward movement. The initial condition involves a bullish MACD crossover, where the MACD Line moves above the Signal Line and the Histogram becomes positive. The indicator then examines whether bullish momentum is accelerating, price action supports the upward movement, and the trend-quality conditions are strong enough to validate the setup.
For example, after a period of downward movement or consolidation, the MACD Histogram may begin expanding into positive territory while price starts closing higher and recovering above a shorter-term moving average. If directional strength improves and the bullish movement satisfies the required conditions, a BUY signal appears below the candlestick. The confirmation can occur shortly after the initial MACD crossover, allowing the system to evaluate the developing movement rather than requiring every condition to align on the crossover candle itself.

"BUY+" Signal
A BUY+ signal identifies potential continuation opportunities during an existing bullish trend. After an upward movement, the market may enter a temporary correction in which price pulls back and the positive MACD Histogram begins contracting. This weakening momentum does not necessarily indicate a bearish reversal; it may represent a short pause before buyers regain control.
The indicator evaluates the depth of the momentum correction, the behavior of price during the pullback, and the subsequent recovery of bullish pressure. When the MACD Histogram begins expanding again, the price confirms renewed upward movement, and the broader bullish conditions remain valid, a BUY+ signal appears below the candlestick. This signal is particularly useful for traders looking for opportunities to participate in trend continuation rather than entering only at the initial bullish MACD crossover.
"BUY R" Signal
A BUY R signal focuses on potential bullish reversals following an extended downward movement. The initial setup develops when price reaches or penetrates a selected lower Trend Channel band while the MACD Histogram remains negative. This interaction identifies a possible reversal area, but touching the band alone is not sufficient to generate a buying signal.
The indicator monitors whether price moves back inside the selected channel level, whether bearish momentum begins weakening, and whether price establishes a bullish reaction. A recovery in the MACD Histogram, an improving MACD Line, and a bullish close above recent short-term highs provide the required confirmation. When these conditions align, a BUY R diamond appears below the price chart. In particularly strong bearish trends, additional confirmation is required to reduce premature countertrend signals. This setup identifies a potential bullish reaction rather than guaranteeing a complete reversal of the prevailing downtrend.
🟣Bearish Trend
SELL Signal
A SELL signal appears when bearish momentum begins developing alongside weakening price conditions. The process starts with a bearish MACD crossover, where the MACD Line moves below the Signal Line and the Histogram enters negative territory. The signal engine then evaluates bearish momentum acceleration, price direction, trend strength, and the quality of the emerging downward movement.
For example, after an upward correction or a period of consolidation, the MACD Histogram may turn negative while price begins closing lower and moving below its shorter-term average. When bearish momentum gains sufficient strength and price action confirms the downward movement, a SELL signal appears above the corresponding candlestick. The purpose of this signal is to identify developing bearish opportunities while reducing dependence on isolated MACD crossovers.

"SELL+" Signal
A SELL+ signal represents a potential continuation opportunity within an established bearish trend. During a downward movement, temporary buying pressure may produce an upward correction, causing the negative MACD Histogram to contract toward the zero line. Although bearish momentum temporarily weakens, the broader market structure may remain bearish.
The indicator monitors the depth of this correction and looks for renewed selling pressure. When the Histogram begins expanding negatively again, price confirms downward movement, and the bearish trend conditions remain valid, a SELL+ signal appears above the candlestick. This helps traders distinguish between a temporary bullish correction and the resumption of bearish momentum, particularly during sustained downward trends.
"SELL R" Signal
A SELL R signal identifies potential bearish reactions after price extends toward the upper Trend Channel bands. The setup begins when price reaches or penetrates the selected upper band while the MACD Histogram remains positive. However, an extended bullish movement does not automatically indicate a selling opportunity, especially when price continues advancing with strong directional momentum.
For confirmation, the system monitors whether price returns inside the selected band, whether the MACD Histogram begins contracting, and whether price breaks below recent short-term lows. The MACD Line must also show weakening bullish momentum. When these conditions align, a SELL R diamond appears above the candlestick. If the broader bullish trend remains particularly strong, the system requires stronger bearish confirmation before issuing a reversal signal. This approach helps distinguish a potential bearish reversal setup from ordinary price fluctuations near the upper channel bands.

🔵Settings
Fast Length: Sets the fast EMA period used in the MACD calculation.
Slow Length: Sets the slow EMA period used in the MACD calculation.
Signal Length: Adjusts the smoothing period of the MACD Signal Line.
Signal Sensitivity: Selects Responsive, Balanced, or Conservative signal confirmation.
Reversal Zone: Selects the channel band used to identify potential reversal setups.
Channel EMA Length: Sets the period of the central moving average.
Band Smoothing: Adjusts the smoothing of channel-width changes.
Band Spacing (ATR): Controls the ATR-based distance between consecutive bands.
Show MACD Cloud: Shows or hides the shaded area between the MACD and Signal lines.
Show Cross Points: Displays markers at MACD Line and Signal Line crossovers.
Show Channel: Shows or hides the EMA channel and its upper and lower bands.
Show Channel Fill: Enables or disables the transparent shading near the central EMA.
Show Buy & Sell: Shows or hides trading signals on the price chart.
Show "Buy+" & "Sell+": Enables or disables trend continuation signals.
Show Reversal Signals: Shows or hides BUY R and SELL R signals.
🔵Conclusion
MACD momentum analysis offers valuable information about market direction, momentum acceleration, and potential trend changes, but traditional MACD crossover signals become more informative when evaluated alongside price structure and volatility. By combining the MACD Histogram, Signal Line, trend-quality conditions, and an EMA 200 Trend Channel, this approach provides additional context for interpreting bullish and bearish price movements. The five upper and five lower ATR bands help traders evaluate price extension, while the momentum signals distinguish between developing trends, continuation opportunities, and potential reversal areas.
The combination of BUY/SELL, BUY+/SELL+, and BUY R/SELL R signals allows traders to examine different phases of market movement without relying on a single type of MACD crossover. Momentum signals provide directional confirmation, continuation setups highlight potential entries after corrections, and reversal signals identify developing reactions around volatility-based channel levels. Together, these features support a more structured approach to MACD trading, trend following, price action analysis, and reversal identification across Forex, Crypto, Stocks, and other financial markets.
The Moving Average Convergence Divergence (MACD) is one of the most widely used momentum indicators in technical analysis, helping traders identify changes in trend direction, momentum strength, and potential price reversals. The MACD calculation is based on the difference between two Exponential Moving Averages (EMA), typically the 12-period and 26-period averages. A 9-period Signal Line is then applied to the MACD Line, while the MACD Histogram represents the distance between them. When the Histogram expands above zero, bullish momentum is strengthening relative to the Signal Line; when it expands below zero, bearish momentum is gaining strength. Changes in the Histogram can also reveal when an existing price movement begins losing momentum.
However, a MACD crossover does not always represent a reliable buying or selling opportunity. During strong trends, bearish crossovers may appear while the broader market remains bullish, and bullish crossovers can occur during temporary corrections within a downtrend. In sideways markets, frequent MACD crossovers often produce conflicting trading signals without establishing a clear directional movement. Another challenge appears when price has already traveled a considerable distance from its average. Even when momentum remains strong, entering an extended movement can expose traders to unfavorable entry locations. For this reason, MACD momentum analysis becomes more meaningful when combined with price action, trend strength, and volatility-based price levels.
The combination of MACD Momentum Signals and a dynamic Trend Channel provides a broader perspective on these market conditions. Alongside the classic MACD oscillator, an EMA 200 Trend Channel uses Average True Range (ATR) to calculate five upper bands and five lower bands around the central moving average. These volatility-based bands help identify the position of price relative to its long-term average, distinguish normal price fluctuations from extended movements, and locate areas where bullish or bearish momentum may begin weakening. As market volatility increases or decreases, the distance between channel levels adjusts accordingly, allowing traders to evaluate price movements under changing market conditions.
The signal system combines MACD crossovers, momentum acceleration, trend quality, price confirmation, and channel interactions to identify different trading scenarios. Standard BUY and SELL signals focus on developing directional movements, while BUY+ and SELL+ signals highlight potential trend continuation opportunities following temporary corrections. Reversal signals examine price reactions around selected channel bands and changes in MACD momentum to identify possible turning points. By separating Momentum Shift, Trend Continuation, and Reversal setups, traders can interpret bullish and bearish signals according to the current market structure instead of relying on traditional MACD crossovers alone.
🔵How to Use
The MACD oscillator and the Trend Channel work together to evaluate both momentum and price positioning. The oscillator displays the MACD Line in purple and the Signal Line in turquoise, accompanied by a four-color MACD Histogram. Turquoise histogram bars indicate positive momentum, while pink bars represent negative momentum. Lighter colors highlight periods when momentum is weakening in its current direction. Cross points mark interactions between the MACD and Signal lines, while the shaded area between them provides an additional visual reference for momentum changes.
On the price chart, the 200-period EMA forms the center of the Trend Channel, with five ATR-based bands extending above and below it. The upper bands help measure bullish price extension, while the lower bands identify progressively deeper bearish price extensions. These levels can serve as dynamic reference zones for evaluating trend continuation, corrections, and potential reversals. The signal engine combines this information with MACD momentum, shorter-term trend conditions, price action, and directional quality. BUY and SELL signals appear as triangles, while BUY R and SELL R signals use diamond markers. To reduce entries after excessive price extensions, new BUY signals are restricted above the third upper band, and new SELL signals are restricted below the third lower band.
🟣Bullish Trend
BUY Signal
A BUY signal appears when bullish momentum begins developing and the price structure provides sufficient confirmation of an upward movement. The initial condition involves a bullish MACD crossover, where the MACD Line moves above the Signal Line and the Histogram becomes positive. The indicator then examines whether bullish momentum is accelerating, price action supports the upward movement, and the trend-quality conditions are strong enough to validate the setup.
For example, after a period of downward movement or consolidation, the MACD Histogram may begin expanding into positive territory while price starts closing higher and recovering above a shorter-term moving average. If directional strength improves and the bullish movement satisfies the required conditions, a BUY signal appears below the candlestick. The confirmation can occur shortly after the initial MACD crossover, allowing the system to evaluate the developing movement rather than requiring every condition to align on the crossover candle itself.
"BUY+" Signal
A BUY+ signal identifies potential continuation opportunities during an existing bullish trend. After an upward movement, the market may enter a temporary correction in which price pulls back and the positive MACD Histogram begins contracting. This weakening momentum does not necessarily indicate a bearish reversal; it may represent a short pause before buyers regain control.
The indicator evaluates the depth of the momentum correction, the behavior of price during the pullback, and the subsequent recovery of bullish pressure. When the MACD Histogram begins expanding again, the price confirms renewed upward movement, and the broader bullish conditions remain valid, a BUY+ signal appears below the candlestick. This signal is particularly useful for traders looking for opportunities to participate in trend continuation rather than entering only at the initial bullish MACD crossover.
"BUY R" Signal
A BUY R signal focuses on potential bullish reversals following an extended downward movement. The initial setup develops when price reaches or penetrates a selected lower Trend Channel band while the MACD Histogram remains negative. This interaction identifies a possible reversal area, but touching the band alone is not sufficient to generate a buying signal.
The indicator monitors whether price moves back inside the selected channel level, whether bearish momentum begins weakening, and whether price establishes a bullish reaction. A recovery in the MACD Histogram, an improving MACD Line, and a bullish close above recent short-term highs provide the required confirmation. When these conditions align, a BUY R diamond appears below the price chart. In particularly strong bearish trends, additional confirmation is required to reduce premature countertrend signals. This setup identifies a potential bullish reaction rather than guaranteeing a complete reversal of the prevailing downtrend.
🟣Bearish Trend
SELL Signal
A SELL signal appears when bearish momentum begins developing alongside weakening price conditions. The process starts with a bearish MACD crossover, where the MACD Line moves below the Signal Line and the Histogram enters negative territory. The signal engine then evaluates bearish momentum acceleration, price direction, trend strength, and the quality of the emerging downward movement.
For example, after an upward correction or a period of consolidation, the MACD Histogram may turn negative while price begins closing lower and moving below its shorter-term average. When bearish momentum gains sufficient strength and price action confirms the downward movement, a SELL signal appears above the corresponding candlestick. The purpose of this signal is to identify developing bearish opportunities while reducing dependence on isolated MACD crossovers.
"SELL+" Signal
A SELL+ signal represents a potential continuation opportunity within an established bearish trend. During a downward movement, temporary buying pressure may produce an upward correction, causing the negative MACD Histogram to contract toward the zero line. Although bearish momentum temporarily weakens, the broader market structure may remain bearish.
The indicator monitors the depth of this correction and looks for renewed selling pressure. When the Histogram begins expanding negatively again, price confirms downward movement, and the bearish trend conditions remain valid, a SELL+ signal appears above the candlestick. This helps traders distinguish between a temporary bullish correction and the resumption of bearish momentum, particularly during sustained downward trends.
"SELL R" Signal
A SELL R signal identifies potential bearish reactions after price extends toward the upper Trend Channel bands. The setup begins when price reaches or penetrates the selected upper band while the MACD Histogram remains positive. However, an extended bullish movement does not automatically indicate a selling opportunity, especially when price continues advancing with strong directional momentum.
For confirmation, the system monitors whether price returns inside the selected band, whether the MACD Histogram begins contracting, and whether price breaks below recent short-term lows. The MACD Line must also show weakening bullish momentum. When these conditions align, a SELL R diamond appears above the candlestick. If the broader bullish trend remains particularly strong, the system requires stronger bearish confirmation before issuing a reversal signal. This approach helps distinguish a potential bearish reversal setup from ordinary price fluctuations near the upper channel bands.
🔵Settings
Fast Length: Sets the fast EMA period used in the MACD calculation.
Slow Length: Sets the slow EMA period used in the MACD calculation.
Signal Length: Adjusts the smoothing period of the MACD Signal Line.
Signal Sensitivity: Selects Responsive, Balanced, or Conservative signal confirmation.
Reversal Zone: Selects the channel band used to identify potential reversal setups.
Channel EMA Length: Sets the period of the central moving average.
Band Smoothing: Adjusts the smoothing of channel-width changes.
Band Spacing (ATR): Controls the ATR-based distance between consecutive bands.
Show MACD Cloud: Shows or hides the shaded area between the MACD and Signal lines.
Show Cross Points: Displays markers at MACD Line and Signal Line crossovers.
Show Channel: Shows or hides the EMA channel and its upper and lower bands.
Show Channel Fill: Enables or disables the transparent shading near the central EMA.
Show Buy & Sell: Shows or hides trading signals on the price chart.
Show "Buy+" & "Sell+": Enables or disables trend continuation signals.
Show Reversal Signals: Shows or hides BUY R and SELL R signals.
🔵Conclusion
MACD momentum analysis offers valuable information about market direction, momentum acceleration, and potential trend changes, but traditional MACD crossover signals become more informative when evaluated alongside price structure and volatility. By combining the MACD Histogram, Signal Line, trend-quality conditions, and an EMA 200 Trend Channel, this approach provides additional context for interpreting bullish and bearish price movements. The five upper and five lower ATR bands help traders evaluate price extension, while the momentum signals distinguish between developing trends, continuation opportunities, and potential reversal areas.
The combination of BUY/SELL, BUY+/SELL+, and BUY R/SELL R signals allows traders to examine different phases of market movement without relying on a single type of MACD crossover. Momentum signals provide directional confirmation, continuation setups highlight potential entries after corrections, and reversal signals identify developing reactions around volatility-based channel levels. Together, these features support a more structured approach to MACD trading, trend following, price action analysis, and reversal identification across Forex, Crypto, Stocks, and other financial markets.

💎Paid Space (VIP): tradingview.com/spaces/TradingFinder/
✅Telegram support team: t.me/TFLABS
🧠Free Forex, Crypto & Stock Trading tutorial, same as ICT, Smart Money & Price Action:
tradingfinder.com/education/forex/
✅Telegram support team: t.me/TFLABS
🧠Free Forex, Crypto & Stock Trading tutorial, same as ICT, Smart Money & Price Action:
tradingfinder.com/education/forex/
Disclaimer
The information and publications are not meant to be, and do not constitute, financial, investment, trading, or other types of advice or recommendations supplied or endorsed by TradingView. Read more in the Terms of Use.
💎Paid Space (VIP): tradingview.com/spaces/TradingFinder/
✅Telegram support team: t.me/TFLABS
🧠Free Forex, Crypto & Stock Trading tutorial, same as ICT, Smart Money & Price Action:
tradingfinder.com/education/forex/
✅Telegram support team: t.me/TFLABS
🧠Free Forex, Crypto & Stock Trading tutorial, same as ICT, Smart Money & Price Action:
tradingfinder.com/education/forex/
Disclaimer
The information and publications are not meant to be, and do not constitute, financial, investment, trading, or other types of advice or recommendations supplied or endorsed by TradingView. Read more in the Terms of Use.