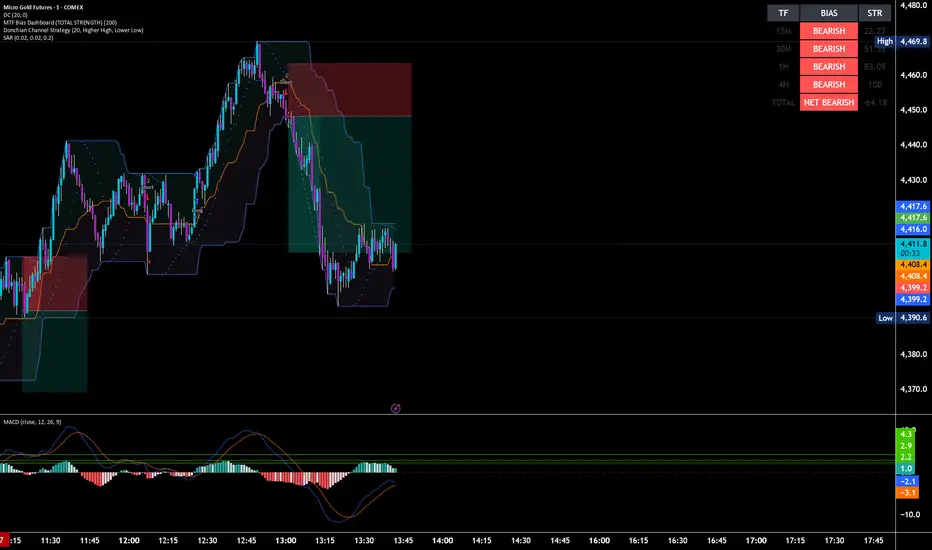
MTF Bias Dashboard (TOTAL STRENGTH)📊 Multi-Timeframe Bias Dashboard (Total Strength)
This indicator gives a clear, no-noise view of market direction by analyzing multiple timeframes and combining them into a single actionable bias.
It tracks the relationship between price and the 200 EMA across key timeframes (15M, 30M, 1H, 4H) to determine whether the market is bullish or bearish, while also measuring the strength of each trend.
🔍 What It Shows
Directional Bias (Bullish / Bearish) for each timeframe
Trend Strength (0–100) based on distance from the 200 EMA
A Total Strength Score that combines all timeframes into one number
This gives you both:
The bigger picture trend
The immediate trading environment
⚡ How It Works
Each timeframe contributes to an overall score:
Bullish trends add positive strength
Bearish trends add negative strength
These values are combined into a Net Strength reading, which tells you who’s in control of the market.
🧠 How to Read It
Strong Positive Total → Market is bullish → Focus on longs
Strong Negative Total → Market is bearish → Focus on shorts
Near Zero → Market is choppy → Avoid trading
Higher timeframe alignment (1H + 4H) defines the main bias, while lower timeframes (15M + 30M) help time entries.
🎯 Why This Is Useful
Eliminates guesswork and conflicting signals
Keeps you trading with trend, not against it
Helps avoid low-quality trades in choppy markets
Perfect for day traders and prop firm traders
🚀 Best Use Case
Use this as a trend filter + bias confirmation tool, then pair it with your entry model (price action, MACD, liquidity, etc.) for precision entries. Indicator

Momentum Confluence SystemCredit: This indicator builds upon the Moving Average Shaded
Fill Area Crossover concept originally developed by @aballard11 The core visual
approach of using filled EMA ribbons to represent trend states was adapted and
significantly expanded with institutional-grade filtering, multi-layered
confluence logic, and professional risk management tools.
What This Indicator Does
The Momentum Confluence System is a multi-timeframe
trend-following indicator designed for day trading across all markets. It
identifies high-probability trade entries by requiring alignment across three
distinct layers of analysis before generating a signal:
-Macro Layer: A higher-timeframe directional filter that
determines whether the broader trend favors longs or shorts
-Slow Momentum Layer: An intermediate EMA ribbon that
confirms the underlying trend on the current timeframe
-Fast Momentum Layer: A responsive EMA ribbon that
generates the actual entry trigger when it crosses in the direction confirmed
by the other layers
A signal only fires when all three layers agree. This triple
confluence approach filters out many false signals that occur in
single-indicator systems.
How It Works - The Core Mechanism
The indicator operates on a hierarchical confirmation
system:
-Macro Bias
The script pulls data from a configurable higher timeframe
(default: 4-hour) and calculates an EMA. When the current price is above this
higher-timeframe EMA, the macro bias is bullish and only long signals are
permitted. When price is below, the macro bias is bearish and only short
signals are allowed. An optional background color overlay (disabled by default
for a cleaner chart) can be enabled to provide immediate visual feedback on the
current macro state—white for bullish, black for bearish.
-Slow Trend and Fast Momentum (Dual EMA Ribbon System)
Two separate EMA ribbons are calculated on the current
timeframe:
-The Slow Trend ribbon uses longer-period EMAs (default: 16
and 30) and represents the intermediate trend. The area between these EMAs is
filled with color—green tones when the fast EMA is above the slow, red tones
when below.
-The Fast Momentum ribbon uses shorter-period EMAs
(default: 8 and 16) and captures momentum shifts. When the fast EMA of this
ribbon crosses above the slow EMA, it generates a potential long signal. A
cross below generates a potential short signal.
Signal Generation
A confirmed long entry requires:
-Macro Bias bullish (price > higher-timeframe EMA)
-Slow Trend bullish (16 EMA > 30 EMA)
-Fast Momentum crossover (8 EMA crosses above 16 EMA)
All active confluence filters passing (volume, ADX,
session, cooldown)
A confirmed short entry requires the inverse conditions
across all layers.
Signal Visualization
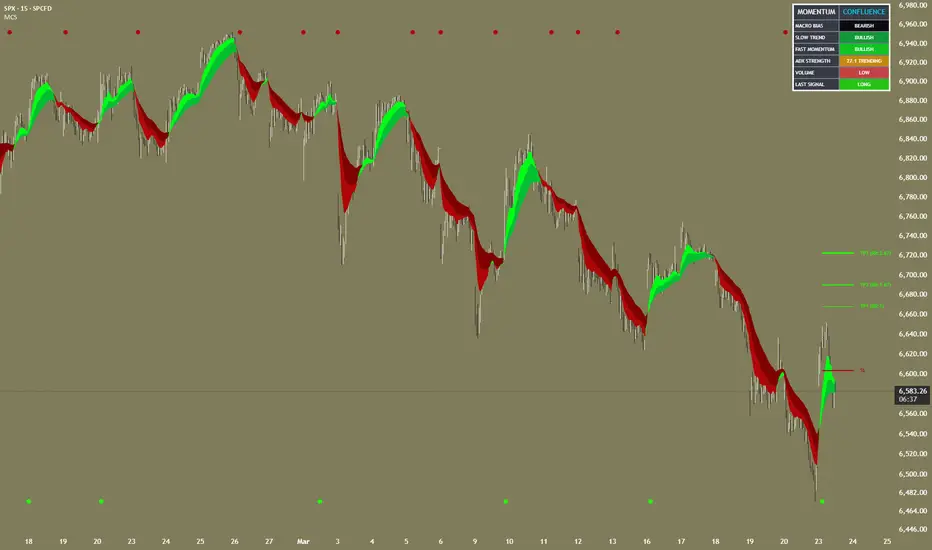
When a signal triggers, a small circle marker appears on the
chart:
-Long signals appear as tiny green circles at the very
bottom of the chart pane
-Short signals appear as tiny red circles at the very top
of the chart pane
This positioning ensures signals remain clearly visible
regardless of price action and do not overlap with candles or indicators.
-Confluence Filters - The Edge
Beyond the core triple-layer system, the indicator includes
several optional filters that add further confluence requirements:
-Volume Confirmation
When enabled, signals only trigger if the current bar's
volume exceeds a moving average of volume. This filters out signals occurring
during low-participation periods, where price moves are more likely to fail or
reverse. You can adjust the lookback period and require volume to be a multiple
above average (e.g., 1.2x means volume must be 20% above the average). This
filter is disabled by default to provide cleaner out-of-the-box signals—enable
it if you want additional volume-based confluence.
-ADX Trend Strength Filter
The Average Directional Index measures trend strength
regardless of direction. When enabled, signals only fire when ADX is above your
threshold (default: 20). ADX below 20 typically indicates a ranging or choppy
market where trend-following entries have lower probability. ADX above 25-30
indicates a strong trend where momentum strategies tend to perform well. This
filter is disabled by default to allow signals in all market conditions—enable
it to restrict signals to confirmed trending environments.
-RSI Divergence Confirmation
This optional filter looks for divergences between price and
RSI. For long signals, it checks whether price is making lower lows while RSI
makes higher lows (bullish divergence), suggesting downward momentum is
exhausting. For shorts, it looks for the opposite pattern. This adds a
mean-reversion element to the momentum-based system.
-Signal Cooldown
Prevents consecutive signals within a specified number of
bars. This serves two purposes: it prevents overtrading in volatile conditions,
and it ensures that once you enter a position, you have time for the trade to
develop before the system suggests another entry.
-Session Filter
Restricts signals to specific hours of the trading day.
Useful for focusing on high-liquidity sessions (such as the overlap between
London and New York for forex) or avoiding pre-market and after-hours periods
for stocks where spreads widen and false breakouts are more common.
Risk Management System
ATR-Based Stop Loss and Take Profit
The indicator calculates Average True Range and uses it to
set dynamic stop loss and take profit levels that adapt to current volatility.
In high-volatility conditions, stops and targets widen automatically to avoid
premature exits. In low-volatility conditions, they tighten to protect profits.
Multi-Target System
Rather than a single take profit level, the indicator
displays three targets:
-TP1 (default: 1.5x ATR) - Suggested for taking 50% of the
position off to lock in profit
-TP2 (default: 2.5x ATR) - Suggested for taking another 30%
and moving stop to breakeven
-TP3 (default: 4.0x ATR) - Runner target for the remaining
20%
Each target displays its risk-to-reward ratio on the chart,
helping you assess whether the trade setup meets your minimum RR requirements.
Trailing Stop Visualization
When enabled, displays a trailing stop line that follows
price by a configurable ATR distance. This is a visualization tool—you execute
the trailing stop manually or via your broker's platform.
Historical Signal Zones
The indicator can draw persistent boxes on the chart showing
the TP and SL zones from previous signals. This lets you review how past setups
played out relative to their projected targets, which is useful for refining
your settings.
Non-Repainting Architecture
The indicator includes a "Wait for Bar Close"
toggle that is enabled by default. When active, signals only fire after the
current bar has closed and all conditions are confirmed. This prevents signals
from appearing during bar formation and then disappearing—a phenomenon known as
repainting that can lead to false backtesting results.
For live trading, always keep this enabled. The only reason
to disable it is for visual exploration of real-time crossover detection during
chart study.
Dashboard Panel
A real-time information panel displays:
-Current macro bias state (bullish or bearish based on
higher timeframe)
-Slow trend state (direction of the intermediate EMA
ribbon)
-Fast momentum state (direction of the responsive EMA
ribbon)
ADX value and strength classification
(Weak/Trending/Strong)
Volume status relative to average (Low/Normal/High)
Last signal direction (Long/Short/None)
The dashboard provides all confluence conditions at a
glance, allowing you to quickly assess whether the market structure supports
your trading direction without scanning the chart.
Alert System
The following alerts can be configured:
-Long Entry Signal (fully filtered, confirmed signal)
-Short Entry Signal (fully filtered, confirmed signal)
-Any Entry Signal (either direction)
-Fast EMA Bullish Cross (unfiltered, for early awareness)
-Fast EMA Bearish Cross (unfiltered, for early awareness)
-Macro Trend Change (price crossing the higher-timeframe
EMA)
-ADX Entered Trending Zone
-ADX Exited Trending Zone
Alert messages include the ticker symbol, timeframe, and
price level for immediate context.
Recommended Settings by Style
-Day Trading (Primary Use Case - Default Settings)
-Macro Timeframe: 240 (4-hour)
-Fast Ribbon: 8/16
-Slow Ribbon: 16/30
-Volume Filter: Disabled by default (enable for additional
confluence)
-ADX Filter: Disabled by default (enable to filter ranging
markets)
Works across all liquid markets including forex majors,
indices, commodities, and large-cap stocks
Scalping Adaptation
Macro Timeframe: 60 (1-hour)
Fast Ribbon: 5/10
Slow Ribbon: 10/20
ADX Threshold: 25 (require stronger trend)
Cooldown: 3 bars
Best on high-liquidity pairs with tight spreads
Swing Trading Adaptation
Macro Timeframe: D (Daily)
Fast Ribbon: 10/21
Slow Ribbon: 21/50
ADX Threshold: 18
Cooldown: 10 bars
Session Filter: Disabled
What Makes This Indicator Unique
The value of this system lies not in any single
component—EMAs and ADX are well-established tools—but in how the components are
structured to work together as a coherent decision framework:
The hierarchical three-layer confirmation prevents the
common problem of entering trades against the prevailing trend
The confluence filters add further gates that signals must pass, reducing noise
The ATR-based risk management automatically adjusts to volatility
The multi-target system provides a complete trade
management framework rather than just entries
The dashboard consolidates state information that would
otherwise require multiple indicators
The non-repainting architecture ensures that what you see
in backtesting reflects actual live behavior
The combination creates a complete trading workflow in a
single indicator: trend identification, entry timing, position sizing guidance
(via RR ratios), and exit management.
Disclaimer
This indicator is a technical analysis tool, not financial
advice. No indicator can predict future price movement with certainty. Always
use proper risk management, never risk more than you can afford to lose, and
consider paper trading any new system before committing real capital. Past
performance of any trading system is not indicative of future results. The
indicator is suitable for all markets including forex, stocks, commodities,
indices, and cryptocurrencies. Performance will vary based on market conditions,
timeframe selection, and user-configured settings.
Indicator

Indicator

Strategy

US Market TimingDisclaimer: Results are hypothetical and do not take into account taxes and fees. This is for informational purposes only and is not financial advice. People can and do lose money investing and trading. Invest responsibly.
US Market Timing strategy designed for long-only position trading. It focuses on multi-month trends rather than day trading, specifically optimized for major US indices like the Nasdaq-100 (QQQ) and S&P 500 (SPY).
Here is a breakdown of how the strategy operates:
Core Strategy Logic
The system uses a "dual-index confirmation" approach. It looks at the S&P 500 (SPX) for the broad market regime and the Nasdaq-100 (QQQ) for specific execution signals.
Entry Conditions (The "Buy" Signal)
To enter a trade, four specific conditions must be met simultaneously:
Broad Market Strength: The SPX daily low must stay above its 21-day EMA for 4 consecutive days.
Growth Confirmation: The QQQ daily low must be above both its 14-day and 21-day EMAs.
Momentum Check: The current QQQ close must not be weaker than the previous three days (preventing buying into a dip that's turning into a slide).
Trend Intensity: The SPX ADX (Average Directional Index) must be above 16, ensuring the market is actually trending and not just chopping sideways.
Exit Conditions (The "Sell" Signal)
The strategy uses two distinct methods to get out of a trade:
The Trend-Based Exit (Loose Stop): This triggers if the SPX 7-day SMA crosses below the 107-day SMA while the QQQ is showing price weakness (closing below its 21-day EMA). This is designed to capture the bulk of a major bull run.
The Safety Exit (Tight Stop): A hard stop is set at 3.5% below the entry price. However, it only triggers if the QQQ is also trading below its 50-day SMA, acting as a double-confirmation to avoid being "shaken out" by minor volatility.
Key Technical Components
21-day EMA - Used as the primary "floor" for price action.
ADX (13-period) - Filters out "flat" markets; requires a value > 16 to trade.
7/107 SMA Cross - Determines the long-term trend shift for exits.
QQQ/SPX Correlation - Uses SPX for the macro trend and QQQ for the micro timing.
Performance Notes
Best Results: QQQ, MDY, IWM, SPY and their leveraged counterparts (QLD, SSO).
Drawdown : Historically, it has significantly outperformed "Buy and Hold" in terms of risk-adjusted returns, often cutting the Max Drawdown of the Nasdaq in half (e.g., QQQ ~28% drawdown vs. much higher during the dot-com era).
Timeframe : Designed for daily charts with trades lasting several months.
Strategy

Indicator

Indicator

Dual Timeframe Slope ConfluenceWhat the indicator does
This indicator transforms the traditional approach to moving average analysis by focusing not on price position relative to an EMA, but on the directional momentum embedded within the EMA itself. Rather than asking "is price above or below the average?", this tool asks a fundamentally different question: "is the structural trend accelerating, decelerating, or stagnating?" The answer comes in the form of a dual-histogram oscillator that visualizes slope dynamics across two independent timeframes, then synthesizes them into actionable confluence signals.
Theoretical Foundation: Why Slope Matters More Than Position
The 200-period EMA has achieved near-universal adoption among institutional participants as the definitive boundary between bull and bear market structure. Fund managers, algorithmic trading systems, and risk committees worldwide reference this level when making allocation decisions. However, a critical insight often overlooked is that the EMA itself is a dynamic entity with its own velocity characteristics.
Consider two scenarios where price trades above the 200 EMA. In the first, the EMA is rising at +0.3% per measurement interval, indicating that the average purchase price of market participants over the lookback window is steadily increasing. Buyers are consistently paying higher prices, and each new bar pushes the institutional cost basis upward. In the second scenario, the EMA is flat at +0.01% — technically still "bullish" by position, but revealing that buying pressure has exhausted itself. The structural foundation that appeared solid is actually stagnating.
This indicator captures precisely this distinction. The slope percentage calculation — expressed as ((EMA_current - EMA_n_bars_ago) / close) × 100 — normalizes the rate of change against current price, making the measurement comparable across instruments trading at vastly different nominal prices. A 0.15% slope on Bitcoin means the same structural momentum intensity as a 0.15% slope on Apple stock, despite their price difference of several orders of magnitude.
Architectural Design: The Two-Layer Confluence System
The indicator operates on a hierarchical timeframe structure that separates macro structural context from micro execution timing.
Layer 1 — Micro Slope (EMA 1)
The Micro layer monitors slope dynamics on an intermediate higher timeframe, defaulting to the 4-hour chart. This timeframe sits in the critical zone between intraday noise and multi-day positioning. The default 200-period EMA represents the institutional standard for market structure analysis — the same level monitored by professional traders, hedge funds, and algorithmic systems worldwide. On a 4-hour chart, a 200-period EMA encompasses 800 hours of price data — approximately 33-34 trading days or roughly 6-7 weeks. This window captures significant structural momentum that filters out minor fluctuations while identifying genuine trend direction that institutional participants respect.
The choice of 200 periods creates a robust temporal framework when combined with the default 10-bar slope lookback. Each slope reading reflects how much the EMA has moved over the past 40 hours (10 bars × 4 hours), providing a multi-day momentum snapshot that captures meaningful directional shifts. The 200 EMA's inherent smoothness means that when its slope changes direction, the shift represents a significant structural event rather than minor price fluctuations.
The Micro histogram displays as the primary visual element, with wider columns (default width: 4) to emphasize its importance. When the slope exceeds the flat threshold in the positive direction, columns render in the bullish color (default: bright green #1fff00). Negative slopes beyond the threshold render in bearish red (#cb0000). Slopes falling within the flat threshold zone render in the sideways color (default: yellow #f0ff00), indicating structural indecision.
The Slope Lookback parameter (default: 10 bars) determines how far back the slope calculation references. On a 4-hour timeframe with a 10-bar lookback, the indicator measures how much the 200 EMA has moved over the past 40 hours. Shorter lookbacks increase sensitivity to recent momentum shifts; longer lookbacks smooth out oscillations and capture only sustained directional moves.
Layer 2 — Macro Slope (EMA 2)
The Macro layer operates on an even higher timeframe, defaulting to the Daily chart. A 200-period EMA on daily bars spans approximately 10 months of market data — long enough to capture complete market cycles in most instruments. The slope of this EMA reflects the fundamental structural trend that underlies all shorter-term fluctuations.
The Macro histogram displays behind the Micro histogram with narrower columns (default width: 2), creating visual depth. The color scheme (default: white for bullish, black for bearish) contrasts with the Micro colors to maintain clear visual separation. When enabled, the background tint option paints the entire oscillator background according to the Macro slope state, creating an immediate visual reference for the dominant structural regime.
The key insight of the dual-layer architecture lies in how these timeframes interact. The Macro slope establishes the structural environment — whether the market is in a rising, falling, or neutral long-term regime. The Micro slope identifies momentum shifts within that environment. A bullish Micro slope emerging while the Macro slope is already bullish represents trend continuation with structural support. A bullish Micro slope emerging while the Macro slope is bearish represents a counter-trend rally fighting against structural headwinds.
Confluence Signal Generation Logic
The indicator generates explicit entry signals only when both layers align in the same direction, implementing a confluence filter that dramatically reduces false signals compared to single-timeframe approaches. Critically, the signal system recognizes that confluence can be achieved through two distinct pathways, and both must trigger actionable signals.
The four signal types:
Micro Buy: This signal fires when the Micro slope (EMA 1) transitions from non-bullish (either bearish or flat) to bullish, while the Macro slope (EMA 2) is already in a bullish state. This represents the classic scenario where the higher timeframe has established an uptrend, and the lower timeframe finally confirms by rotating positive. The signal appears as a bright green circle (#1fff00) with "MICRO BUY" text at the bottom of the oscillator panel. This is often the safer entry — the macro structure is already supportive, and micro momentum has now aligned.
Macro Buy: This signal fires when the Macro slope transitions to bullish while the Micro slope is already bullish. This represents a different market dynamic: the short-term momentum led the way upward, and now the structural regime has confirmed by rotating positive. The signal appears as a darker green circle (#03bf31) with "MACRO BUY" text, visually distinct from micro signals. This signal often occurs after extended base-building periods where micro momentum established itself before the slower structural EMA caught up. Macro buy signals can indicate the beginning of a more sustained trend phase since both timeframes are now freshly aligned.
Micro Sell: This signal fires when the Micro slope transitions from non-bearish to bearish while the Macro slope is already bearish. Short-term momentum has capitulated into alignment with an already-bearish structural regime. The signal appears as a bright red circle (#cb0000) with "MICRO SELL" text at the top of the oscillator panel. This typically marks the point of maximum downward pressure initiation — sellers controlled the macro timeframe, and now they've broken through on the micro level as well.
Macro Sell: This signal fires when the Macro slope transitions to bearish while the Micro slope is already bearish. The structural regime has confirmed what short-term momentum was already indicating: bearish conditions. The signal appears as a darker red circle (#a51212) with "MACRO SELL" text, visually distinct from micro signals. This often signals the transition from a corrective phase into a full structural breakdown.
The color differentiation between micro and macro signals serves a practical purpose: at a glance, traders can immediately identify whether the triggering layer was the faster micro timeframe or the slower macro timeframe without reading the text label. Bright colors indicate micro-triggered signals (the faster, more reactive layer completed alignment), while darker/deeper colors indicate macro-triggered signals (the slower, more structural layer completed alignment).
The distinction between micro and macro signal types carries analytical significance beyond mere labeling. Micro-triggered signals (where micro completes the alignment) tend to occur earlier in momentum rotations and may offer tighter stop placement but require the macro layer to already be positioned correctly. Macro-triggered signals (where macro completes the alignment) tend to occur later but often mark more decisive structural shifts. Some traders prefer one type over the other; the labeling allows for this distinction.
The transition detection uses one-shot logic: each signal fires exactly once at the moment of state change, not continuously while conditions remain true. This prevents signal spam during sustained trending periods and provides clean, actionable entry points.
Wait state:
When the confluence conditions are not met — such as when Micro is bullish but Macro is bearish (bullish divergence), Macro is bullish but Micro is bearish (bearish divergence), or when either layer is in the sideways/flat zone — the Status Matrix displays "wait" and no entry signals fire. These periods represent either counter-trend conditions or structural indecision, neither of which provides favorable risk/reward for directional entries.
The Flat Threshold: Detecting Momentum Exhaustion
The flat threshold parameter (default: 0.05%) serves as the boundary between trending and sideways classification. When the absolute value of the slope percentage falls below this threshold, the histogram colors shift to yellow and the state registers as "SIDEWAYS" in the Status Matrix.
This classification has profound analytical implications. A transition from bullish to sideways indicates that upward momentum has exhausted — the EMA is no longer rising at a meaningful rate, suggesting that buying pressure has dried up. A transition from bearish to sideways indicates selling pressure exhaustion. Both scenarios often precede reversals or significant consolidation periods.
The optimal flat threshold varies by instrument volatility. For highly volatile assets like cryptocurrencies or small-cap stocks, a threshold of 0.10% to 0.20% prevents excessive sideways classifications during normal price action. For slower-moving instruments like bonds or large-cap indices, a threshold of 0.02% to 0.03% may be more appropriate. The default 0.05% serves as a balanced starting point for forex majors and mid-volatility equities.
Gradient Visualization System
When gradient colors are enabled (default: on), the indicator applies dynamic intensity scaling to histogram columns based on slope strength. This creates an immediate visual distinction between weak and strong momentum.
The gradient calculation uses a 200-bar rolling maximum of the absolute slope value as the upper reference. A slope at 20% of this maximum appears heavily faded; a slope at 100% of the maximum appears at full color intensity. This relative scaling automatically adapts to each instrument's characteristic volatility — a "strong" slope on a slow-moving instrument renders at the same visual intensity as a "strong" slope on a volatile instrument.
The practical benefit is rapid visual pattern recognition. Experienced users learn to identify momentum acceleration (brightening columns) and deceleration (fading columns) at a glance, providing early warning of potential state transitions before they officially trigger.
Status Matrix: Real-Time Confluence Dashboard
The Status Matrix table provides at-a-glance state information without requiring visual interpretation of histogram colors. It displays four columns and multiple rows:
Micro row: Shows the current state of EMA 1 slope (bullish, bearish, or sideways) with the configured timeframe in parentheses, plus the exact slope percentage value. The background color matches the state — green for bullish, red for bearish, yellow for sideways.
Macro row: Shows the current state of EMA 2 slope with its timeframe and precise slope percentage. Provides immediate visibility into the structural environment with quantitative data.
Confluence row: Displays the synthesized signal state — "buy" when both layers are bullish, "sell" when both are bearish, "wait" for all other conditions. This row answers the fundamental question: "Should I be looking for entries right now, and in which direction?"
Magnitude row (conditional): When the signal magnitude filter is enabled, an additional row appears showing whether the current slopes pass or are blocked by the magnitude requirement. This row also displays the active threshold value, providing immediate feedback on why a signal may or may not be firing.
The slope percentage column allows users to monitor exact momentum readings without enabling the slope labels, keeping the histogram visually clean while still providing quantitative reference in the matrix.
The matrix position is configurable to any corner of the oscillator panel, allowing users to avoid overlap with price action on compressed chart layouts.
Non-Repainting Architecture
The indicator implements a rigorous non-repainting design through three interlocking mechanisms:
Mechanism 1 — Historical bar offset: The security function applies a offset to all higher-timeframe data requests. This ensures that only the previous (fully closed) HTF bar's data is used in calculations. The current forming HTF bar is never referenced.
Mechanism 2 — Lookahead prevention: All request.security() calls use lookahead=barmerge.lookahead_off, preventing historical data leakage during backtesting. This ensures that what you see on historical bars is exactly what would have been visible at that moment in real-time.
Mechanism 3 — Wait for bar close option: When enabled (default: on), the indicator routes all calculations through the non-repainting security functions. When disabled, live (current bar) data is used — this may cause the histogram to update during bar formation, but once a bar closes, its value becomes permanent.
For users running alerts or making trading decisions, the "wait for bar close" option should remain enabled. This guarantees that signals will never disappear or change after they appear.
Alert System: Twelve Configurable Conditions
The indicator provides twelve distinct alert conditions, each independently toggleable:
Signal-specific alerts (four types):
• Micro buy — Fires when the Micro slope transitions to bullish while Macro is already bullish. The faster layer has confirmed alignment with the established structural trend.
• Macro buy — Fires when the Macro slope transitions to bullish while Micro is already bullish. The structural regime has confirmed what short-term momentum was indicating.
• Micro sell — Fires when the Micro slope transitions to bearish while Macro is already bearish. Short-term momentum has capitulated into the bearish structural regime.
• Macro sell — Fires when the Macro slope transitions to bearish while Micro is already bearish. The structural breakdown has been confirmed.
Combined confluence alerts:
• Any buy signal — Fires on either micro buy or macro buy. Useful when you want a single alert for all bullish confluence completions.
• Any sell signal — Fires on either micro sell or macro sell. Useful when you want a single alert for all bearish confluence completions.
Layer-specific transition alerts:
• EMA 1 turns bullish — Micro slope transitions to bullish, regardless of Macro state. Early momentum shift detection.
• EMA 1 turns bearish — Micro slope transitions to bearish.
• EMA 2 turns bullish — Macro structural shift upward. Often precedes sustained trend moves.
• EMA 2 turns bearish — Macro structural shift downward.
Momentum exhaustion alerts:
• EMA 1 turns flat — Micro momentum exhaustion. Potential reversal or consolidation incoming.
• EMA 2 turns flat — Macro momentum exhaustion. Structural regime may be ending.
All alerts include dynamic placeholders for ticker symbol and timeframe, providing context when monitoring multiple instruments. The separation between micro and macro signal alerts allows traders to customize their notification strategy based on which completion type they prefer to act upon.
Signal Magnitude Filter: Eliminating Weak Transitions
The indicator includes an optional signal magnitude filter that adds a second layer of quality control beyond the basic flat threshold. While the flat threshold determines whether a slope is considered trending at all (bullish/bearish versus sideways), the magnitude filter determines whether a trending slope is strong enough to warrant a trade signal.
The core insight: A slope might be technically bullish (above the flat threshold of 0.05%), but if it reads only 0.08%, this represents barely-trending momentum. The magnitude filter allows users to require a minimum slope strength of, for example, 0.35% before any buy or sell signal fires. This filters out marginal transitions that occur when momentum is technically present but unconvincing.
Filter target options:
EMA 1 only — Requires the micro slope to meet the magnitude threshold. Useful when you want strong short-term momentum regardless of macro strength.
EMA 2 only — Requires the macro slope to meet the magnitude threshold. Useful when you trust the structural trend but want confirmation of strong underlying momentum.
Both EMAs — Requires both micro and macro slopes to meet the threshold. Most selective mode, producing the fewest signals. Use when you want only high-conviction setups where momentum is strong across both timeframes.
Either EMA — Requires at least one slope to meet the threshold. Least selective mode, useful when strong momentum on either layer is sufficient justification for a trade.
When the magnitude filter is enabled, the status matrix displays an additional row showing whether the current state passes or is blocked by the filter, along with the active threshold value.
Practical example: With the default flat threshold of 0.05% and a magnitude filter of 0.35%, a transition from sideways to bullish will only generate a buy signal if the bullish slope immediately exceeds 0.35%. A gradual transition where the slope rises from 0.04% to 0.06% to 0.12% would be classified as bullish (above flat threshold) but would not trigger a buy signal until magnitude reaches 0.35%. This prevents trading marginal momentum shifts that lack conviction.
Configuration Guidance by Trading Style
Intraday momentum trading (holding periods: 1-8 hours)
• EMA 1 timeframe: 60 (1 hour)
• EMA 2 timeframe: 240 (4 hour)
• Slope lookback: 8
• Flat threshold: 0.03%
This configuration captures momentum shifts suitable for sessions-length holds, with the 4-hour structural filter preventing trades against the day's dominant direction.
Swing trading (holding periods: 2-10 days)
• EMA 1 timeframe: 240 (4 hour)
• EMA 2 timeframe: 1D (daily)
• Slope lookback: 10
• Flat threshold: 0.05%
The default configuration, optimized for multi-day position trades aligned with weekly structural momentum.
Position trading (holding periods: 2-8 weeks)
• EMA 1 timeframe: 1D (daily)
• EMA 2 timeframe: 1W (weekly)
• Slope lookback: 15
• Flat threshold: 0.08%
Captures major trend inflections suitable for larger capital allocation and reduced monitoring frequency.
Aggressive scalping (holding periods: 5-60 minutes)
• EMA 1 timeframe: 15
• EMA 2 timeframe: 60
• Slope lookback: 5
• Flat threshold: 0.02%
Faster-reacting configuration for high-frequency directional trades. Requires active monitoring and tight risk management.
Market Suitability and Environmental Factors
Optimal conditions:
The indicator performs best in markets exhibiting sustained directional moves with intermittent pullbacks — essentially, trending markets with measurable momentum characteristics. Forex majors, equity indices, large-cap stocks, and liquid cryptocurrencies during trending phases all provide favorable environments.
Challenging conditions:
Extended sideways consolidation produces frequent flat-state readings and few confluence signals. This is by design — the indicator correctly identifies that no clear directional edge exists during these periods. Additionally, news-driven volatility events can produce slope spikes that do not represent sustainable momentum; waiting for bar close helps filter these anomalies.
Instruments to avoid:
Illiquid instruments with erratic price action, thinly traded options, and assets subject to frequent gaps may produce unreliable slope calculations. The indicator assumes continuous price discovery typical of liquid markets.
Understanding the Slope Percentage Calculation
The core mathematical operation underlying this indicator deserves explicit explanation, as it differs fundamentally from typical moving average derivative calculations.
The formula:
Slope percentage = ((EMA_current - EMA_n_bars_ago) / current_price) × 100
This formula produces a dimensionless percentage that represents how much the EMA has moved as a proportion of current price over the lookback period. The division by current price (rather than by the EMA value itself) is a deliberate design choice with specific analytical benefits.
Why divide by price, not EMA:
When the EMA rises from 100 to 101, the absolute change is 1 unit. If we divided by the EMA value (101), we would get approximately 0.99%. However, if price simultaneously moved from 105 to 110, this EMA movement represents a smaller structural shift relative to overall market activity. By dividing by current price (110), the slope becomes approximately 0.91%, correctly reflecting that the EMA's movement is modest relative to price expansion.
This normalization ensures that slope readings remain interpretatively consistent during strong momentum phases. A 0.2% slope reading carries the same structural meaning whether price is at 50 or 500, and whether the EMA is lagging behind price by 5% or 15%.
Lookback period implications:
The slope lookback parameter directly controls the measurement window. A 10-bar lookback on a 4-hour timeframe spans 40 hours. The slope value at any moment represents the average rate of change over that entire window. Short lookbacks (3-5 bars) make the indicator reactive to recent momentum bursts but produce noisier readings. Long lookbacks (15-25 bars) capture only sustained directional moves but introduce lag in transition detection.
The default 10-bar lookback represents a balance — responsive enough to identify meaningful slope transitions within a few bars of their occurrence, yet stable enough to avoid frequent state changes from temporary price fluctuations.
Interpreting Slope Magnitude
While the three-state classification (bullish/bearish/sideways) provides clear categorical guidance, experienced users extract additional information from slope magnitude.
Low magnitude trending (0.05% - 0.15%):
Slopes in this range indicate that the EMA is moving directionally but without strong conviction. These readings often appear during early trend development or during corrective phases within larger moves. The gradient visualization renders these columns with reduced intensity, providing visual confirmation of the modest momentum.
Moderate magnitude trending (0.15% - 0.35%):
This range represents healthy, sustainable trending momentum. The EMA is moving decisively in one direction, reflecting genuine accumulation (bullish) or distribution (bearish) by market participants. Most reliable confluence signals occur when both Micro and Macro slopes fall within this range.
High magnitude trending (0.35%+):
Slopes exceeding 0.35% often indicate climactic momentum — either the acceleration phase of a strong trend or the exhaustion blow-off preceding a reversal. The gradient visualization renders these columns at maximum intensity. While powerful when correctly interpreted, extremely high slopes warrant caution as they frequently precede sharp corrections.
Negative slope with price above EMA:
A scenario worth noting: price can trade above the EMA while the EMA slope is negative. This occurs during pullbacks within uptrends, where the EMA begins declining (negative slope) while price has not yet broken below the average. The indicator correctly identifies this as bearish slope momentum, providing early warning that structural support may be weakening.
Confluence Versus Divergence States
The interaction between Micro and Macro slope states creates four distinct market regimes:
Bullish confluence (Micro: bullish, Macro: bullish):
Both timeframes exhibit positive slope momentum. This represents the highest-probability environment for long positions. The Macro layer confirms structural uptrend; the Micro layer confirms that shorter-term momentum supports continuation. Trend-following entries during these periods benefit from aligned multi-timeframe momentum.
Bearish confluence (Micro: bearish, Macro: bearish):
Both timeframes exhibit negative slope momentum. This represents the highest-probability environment for short positions or cash positions for long-only traders. Structural damage on the Macro layer combines with active selling pressure on the Micro layer.
Bullish divergence (Micro: bullish, Macro: bearish):
The Micro layer shows positive slope while the Macro layer remains negative. This represents a counter-trend rally within a structural downtrend. While such rallies can produce tradeable moves, they fight against the dominant regime. Risk management should be tighter, and profit targets more conservative.
Bearish divergence (Micro: bearish, Macro: bullish):
The Micro layer shows negative slope while the Macro layer remains positive. This represents a pullback within a structural uptrend — often the highest-probability entry point for trend-following traders. Waiting for Micro slope to return to bullish (creating bullish confluence) provides confirmation that the pullback has concluded.
The Status Matrix synthesizes these states into the simple buy/sell/wait classification, but understanding the underlying dynamics allows for more nuanced interpretation.
The 200-Period EMA: Institutional Standard
The default 200-period setting for EMA 1 reflects the institutional standard that has become deeply embedded in global market structure. Understanding why this particular value matters provides insight into the indicator's design philosophy.
Institutional significance:
The 200-period moving average is arguably the most widely monitored technical level across all asset classes. Hedge funds, algorithmic trading systems, and institutional desks incorporate the 200 MA into their models. When price approaches or crosses this level, order flow often increases as multiple participants react simultaneously. By measuring the slope of this specific EMA, the indicator captures the directional momentum of a level that genuinely influences market behavior.
Structural lookback window:
On the default 4-hour timeframe, 200 periods represents 800 hours or approximately 33-34 trading days — roughly 6-7 weeks of market data. This extended window filters out weekly oscillations and captures only significant structural trends. When the 200 EMA on the 4H chart changes slope direction, it represents a meaningful shift in intermediate-term market structure, not a temporary fluctuation.
Dual 200 EMA architecture:
The default configuration uses 200-period EMAs on both layers: the 4H (Micro) and Daily (Macro) timeframes. This creates a coherent analytical framework where both layers reference the same institutionally-significant period, but across different temporal scales. The Daily 200 EMA represents roughly 10 months of data; the 4H 200 EMA represents roughly 6-7 weeks. Both capture structural trends at their respective scales while maintaining conceptual consistency.
Slope stability:
The 200 EMA's inherent smoothness means its slope changes are meaningful. Unlike faster EMAs that oscillate frequently, the 200 EMA slope tends to establish a direction and maintain it through minor pullbacks. This stability reduces signal noise and ensures that slope transitions represent genuine shifts in market character.
Users seeking faster signal generation may reduce EMA 1 length to 100 or 150, accepting more frequent slope transitions in exchange for earlier momentum detection.
Practical Workflow Examples
Example 1 — Swing trade entry:
A trader monitoring EUR/USD observes the Status Matrix showing Macro: bullish and Confluence: wait (because Micro is currently sideways after a recent pullback). The trader sets an alert for "bullish confluence" and waits. Two days later, the alert fires as Micro transitions to bullish. The buy signal appears on the chart. The trader enters long, placing stops below the recent swing low formed during the sideways period.
Example 2 — Momentum exhaustion exit:
A trader holds a long position in AAPL entered during a previous bullish confluence signal. The gradient colors begin fading (slope magnitude decreasing) despite the histogram remaining green. Shortly after, the "EMA 1 turns flat" alert fires. The Micro slope has fallen below the flat threshold, indicating momentum exhaustion. The trader reduces position size or tightens stops, recognizing that the immediate bullish pressure has dissipated.
Example 3 — Avoiding counter-trend traps:
A trader observes a strong rally in BTC/USD on the 1-hour chart. However, the Status Matrix shows Macro: bearish. Despite the impressive short-term move, the Confluence reads wait because the rally is fighting against structural bearish momentum on the daily timeframe. The trader avoids entering long, recognizing the elevated risk of trading against the dominant regime.
Originality Statement
While this indicator utilizes the EMA calculation — a public domain formula built into Pine Script — its originality lies in the following architectural decisions:
1. Slope as primary metric: Traditional EMA indicators focus on price position relative to the average. This indicator inverts the paradigm by treating the EMA's own rate of change as the primary analytical output.
2. Dual-timeframe confluence architecture: The hierarchical Micro/Macro structure with explicit confluence requirements creates a signal generation framework distinct from standard multi-timeframe approaches.
3. Percentage-normalized slope: Expressing slope as a percentage of current price enables cross-instrument comparison and consistent interpretation across markets.
4. Three-state classification: The flat/sideways state provides information absent from binary bull/bear systems, explicitly flagging momentum exhaustion periods.
5. Gradient intensity mapping: Dynamic visual scaling based on rolling slope extremes creates an intuitive representation of momentum strength unavailable in standard histogram implementations.
6. Integrated status matrix: The real-time confluence dashboard synthesizes multiple data streams into actionable state classifications, reducing cognitive load during live trading.
Disclaimer
This indicator is provided for educational and analytical purposes. It does not constitute financial advice, investment recommendations, or trading signals. Past performance of any methodology does not guarantee future results. All trading involves substantial risk of loss. Users should perform their own analysis, employ appropriate risk management, and consider their individual financial situation before making trading decisions. The indicator is suitable for any liquid market across forex, equities, indices, commodities, and cryptocurrencies. Timeframe suitability ranges from 5-minute charts (for scalping with adjusted settings) through weekly charts (for position trading). Always use in conjunction with your complete trading methodology and risk management framework.
Indicator

Cascade Confluence MatrixWhat the indicator does
-Cascade Confluence Matrix is a triple-timeframe trend alignment system built on the principle that sustainable price movements require confirmation across multiple temporal dimensions. Unlike single-timeframe indicators that generate signals in isolation, this tool synthesizes trend data from three distinct market perspectives—macro, intermediate, and micro—to identify moments when all three layers agree on directional bias. The result is a filtration mechanism that significantly reduces false signals by requiring confluence before any entry or exit is flagged.
-The core philosophy stems from institutional trading practices where position sizing and entry timing depend on alignment between strategic trend direction (higher timeframes) and tactical execution windows (lower timeframes). Retail traders often struggle because they enter trades that look valid on one timeframe but contradict the broader market context. This indicator addresses that disconnect by making multi-timeframe agreement a prerequisite for signal generation.
The Three-Layer Architecture
-Layer 1: Macro Trend Filter (Strategic Direction)
The first condition operates on the highest timeframe (default: 4-hour) and serves as the directional gatekeeper. It answers a fundamental question: Is price trading above or below a smoothed representation of recent price action?
This layer uses a single Exponential Moving Average. When price closes above this EMA, the macro environment is classified as bullish. When price closes below, it is bearish. There is no neutral state at the macro level—the market is always leaning one direction or the other.
The EMA length (default: 8 periods on a 4-hour chart, representing 32 hours of price data) is intentionally short for a higher timeframe. This keeps the macro filter responsive to genuine trend changes while still filtering out noise that would be visible on lower timeframes. A longer EMA would provide more stability but would also delay recognition of legitimate trend reversals, potentially causing late entries and exits.
The strategic purpose of this layer is elimination. It removes approximately half of all potential signals by disqualifying any setup that contradicts the higher timeframe bias. A short setup during a macro uptrend, regardless of how technically perfect it appears on lower timeframes, is filtered out entirely.
-Layer 2: Intermediate Momentum (Tactical Confirmation)
The second condition operates on the middle timeframe (default: 1-hour) and introduces a more sophisticated analysis using dual EMA crossover systems running in parallel.
Fast Momentum Pair**: A short EMA (default: 8) compared against a longer EMA (default: 12). This pair is highly responsive and captures early momentum shifts. When the short EMA crosses above the long EMA, buying pressure is accelerating. When it crosses below, selling pressure is accelerating.
Slow Momentum Pair**: A short EMA (default: 16) compared against a longer EMA (default: 30). This pair is more stable and confirms whether the momentum shift detected by the fast pair has structural backing. It filters out momentum spikes that lack follow-through.
For a bullish intermediate signal, BOTH pairs must show the shorter EMA above the longer EMA simultaneously. This dual-confirmation requirement within a single timeframe creates an internal filter—capturing momentum that is both emerging (fast pair) and sustained (slow pair).
The intermediate layer functions as the bridge between strategic direction and tactical execution. It ensures that not only is the macro trend favorable, but current momentum within the trend is actively supporting directional continuation. A macro uptrend with deteriorating intermediate momentum would fail this condition, keeping traders out of potential pullback phases.
-Layer 3: Entry Timing (Execution Precision)
The third condition operates on the lowest timeframe (default: 15-minute) and mirrors the dual-crossover logic of Layer 2 but with different parameters optimized for entry timing rather than momentum confirmation.
Fast Entry Pair**: EMAs of 30 and 50 periods. On a 15-minute chart, this represents 7.5 to 12.5 hours of price action—substantial enough to avoid noise while sensitive enough to capture genuine entry opportunities.
Slow Entry Pair**: EMAs of 50 and 150 periods. The 150-period EMA on a 15-minute chart represents over 37 hours of data, providing a local trend baseline that must be exceeded before entries are permitted.
The deliberately longer EMA periods on the entry timeframe serve a specific purpose: they prevent premature entries during minor retracements within the intermediate trend. A trader might see price dip briefly on the 15-minute chart while the 1-hour and 4-hour remain bullish. The longer EMAs on the entry layer require price to demonstrate sustained strength before triggering, avoiding entries at temporary highs during pullbacks.
Signal Generation Logic
State vs. Event Detection
The indicator distinguishes between two fundamentally different types of information:
State: A continuous condition where all three layers agree. Visualized through background coloring—green when all layers are bullish, red when all layers are bearish. States can persist for extended periods across dozens or hundreds of bars.
Event: A discrete moment when a state transition occurs. Entry signals trigger when moving from non-aligned to aligned. Exit signals trigger when moving from aligned to non-aligned. Events occur only once per transition, marked with labeled shapes on the chart.
This distinction matters for practical trading. States define the directional environment and can inform position management, scaling, or bias. Events define actionable moments for discrete entries and exits.
Long Entry Conditions
A long entry event requires:
1. Current bar: All three layers bullish (price > macro EMA, both intermediate pairs bullish, both entry pairs bullish)
2. Previous bar: At least one layer was NOT bullish (full confluence did not exist)
This ensures the long entry marker appears exactly once when confluence is achieved, not continuously throughout a bullish state.
Short Entry Conditions
A short entry event requires:
1. Current bar: All three layers bearish (price < macro EMA, both intermediate pairs bearish, both entry pairs bearish)
2. Previous bar: At least one layer was NOT bearish (full confluence did not exist)
Exit Logic and Risk Management Philosophy
-Long exits trigger when a bullish state ends—any single layer turning non-bullish breaks confluence and generates the exit event. Short exits trigger when a bearish state ends—any single layer turning non-bearish breaks confluence.
-This asymmetry between entry and exit is intentional and reflects a specific risk management philosophy. Entries require ALL conditions to align simultaneously (conservative, high-conviction entry). Exits require only ONE condition to break (aggressive, capital-protective exit). This structure prioritizes capital preservation by exiting at the first sign of confluence breakdown rather than waiting for a complete trend reversal across all layers.
-The rationale: A trend that has fully aligned across three timeframes and then loses even one layer of support may be showing early signs of exhaustion. The conservative approach is to exit and await a fresh confluence event rather than hoping the trend resumes.
Non-Repainting Architecture
Repainting occurs when an indicator displays signals that would not have been visible in real-time, creating a misleading historical record that appears more profitable than actual trading would have been. This indicator implements multiple safeguards against this common problem:
Historical Bar Reference**: All security requests use a offset, meaning calculations reference the previous bar's confirmed data rather than the current bar's evolving data. The EMA values, crossover states, and price closes used in calculations are always from completed bars whose values can no longer change.
Lookahead Prevention**: The security function explicitly sets lookahead=barmerge.lookahead_off, preventing Pine Script from using future data that would not have been available at the historical moment being calculated. This is critical for accurate backtesting and historical analysis.
**Bar Confirmation Option**: The "Wait for Bar Close" toggle adds an additional layer by requiring barstate.isconfirmed before any signal can trigger. This ensures that even on the current bar, signals only appear after the bar has closed and cannot be altered by subsequent price movement within that bar.
When "Wait for Bar Close" is enabled (the default setting), every signal displayed on the chart is exactly what a trader would have seen trading in real-time. No signal will ever disappear or move to a different bar after the fact. This is essential for developing trust in the indicator's historical performance and for accurate strategy development.
The Status Table: Real-Time Confluence Dashboard
The on-chart table provides instant visibility into the confluence state without requiring manual analysis of each timeframe separately. This is particularly valuable when awaiting a signal or trying to understand why a signal has not yet triggered.
Header Row: Identifies the condition categories and directional columns (Long/Short).
**Row 1 - Macro**: Displays whether Layer 1 (highest timeframe price vs EMA) currently favors long, short, or neither direction. A checkmark indicates the condition is met; a dash indicates it is not.
**Row 2 - Intermediate**: Displays whether Layer 2 (dual crossover on middle timeframe) currently favors long, short, or neither. Remember that both the fast AND slow crossover pairs must agree for a checkmark to appear.
Row 3 - Entry**: Displays whether Layer 3 (dual crossover on lowest timeframe) currently favors long, short, or neither. These longer-period EMAs on the shortest timeframe are often the last to confirm.
Row 4 - Signal**: Displays the overall confluence state. "LONG" appears only when all three condition rows show bullish checkmarks. "SHORT" appears only when all three show bearish checkmarks. "NEUTRAL" appears when there is any disagreement between layers.
The table updates in real-time (or on bar close if that option is enabled) and serves as a diagnostic tool. If a trader expects a long signal but sees NEUTRAL, they can immediately identify which specific layer—Macro, Intermediate, or Entry—is currently blocking the signal. This prevents frustration and enables anticipation of upcoming signals as individual layers turn favorable.
Alert System Configuration
Six distinct alert conditions enable comprehensive automated monitoring:
-Long Entry: Fires exactly once when transitioning from non-bullish-confluence to full bullish confluence. Use this for entry notifications when going long.
-Short Entry: Fires exactly once when transitioning from non-bearish-confluence to full bearish confluence. Use this for entry notifications when going short.
-Long Exit: Fires exactly once when bullish confluence breaks (any layer turns non-bullish). Use this for managing existing long positions and knowing when to close or scale out.
-Short Exit: Fires exactly once when bearish confluence breaks (any layer turns non-bearish). Use this for managing existing short positions.
-Long State Active: Fires on every bar where full bullish confluence exists. Useful for monitoring ongoing conditions rather than just transitions—for example, to confirm a long bias persists before adding to positions.
-Short State Active: Fires on every bar where full bearish confluence exists. Useful for monitoring ongoing bearish conditions.
All alerts automatically include the ticker symbol, making them suitable for watchlist-style monitoring across multiple instruments simultaneously. Traders can set alerts on multiple assets and receive notifications when any of them achieve confluence, enabling opportunity scanning without constant manual chart monitoring.
Configuration Profiles for Different Trading Styles
Aggressive Scalping (Forex Majors, Liquid Crypto, Index Futures)
For rapid setups on highly liquid markets during active sessions:
- Macro Timeframe: 60 (1-hour), EMA 8
- Intermediate Timeframe: 15, Fast 5/8, Slow 8/21
- Entry Timeframe: 5 or 3, Fast 13/21, Slow 21/55
This configuration compresses all three layers into a tighter temporal range, generating more frequent signals with faster entries and exits. Best used during high-volume sessions (London-New York overlap for forex, US market hours for indices) where momentum follows through reliably. Expect 5-15 signals per day depending on volatility. Holding periods range from minutes to 1-2 hours.
Risk consideration: More signals means more exposure to whipsaws. Aggressive scalping configuration should be paired with tight stops and smaller position sizes.
Intraday Momentum Trading (Stocks, ETFs, Crypto, Indices)
For intraday setups with meaningful move potential:
- Macro Timeframe: 240 (4-hour), EMA 8
- Intermediate Timeframe: 60, Fast 8/12, Slow 16/30
- Entry Timeframe: 15, Fast 30/50, Slow 50/150
This is the default configuration, balancing signal frequency with reliability. Typically generates 1-4 signals per day on actively traded instruments. Positions may be held for 2-8 hours, capturing intraday momentum waves that align across timeframes.
Best suited for traders who can monitor positions during market hours but do not want the intensity of pure scalping.
Swing Trading (Any Liquid Market)
For multi-day position holding:
- Macro Timeframe: D (Daily), EMA 10
- Intermediate Timeframe: 240, Fast 8/13, Slow 13/34
- Entry Timeframe: 60, Fast 21/55, Slow 55/144
This configuration uses daily macro filtering, meaning the highest timeframe evaluates whether price closed above or below the EMA on the previous daily candle. Signals are less frequent—perhaps a few per week—but aim to capture multi-day momentum swings.
Fibonacci-sequence EMA periods (8/13, 13/34, 21/55, 55/144) on the intermediate and entry layers align with natural market rhythms observed in swing price action.
Position Trading and Trend Following (Commodities, Macro Assets, Long-Term Crypto)
For capturing extended directional moves over weeks or months:
- Macro Timeframe: W (Weekly), EMA 8
- Intermediate Timeframe: D, Fast 8/21, Slow 21/55
- Entry Timeframe: 240, Fast 34/89, Slow 89/233
This long-term configuration may generate only a handful of signals per quarter but aims for substantial trend participation. The weekly macro filter ensures positions align with the dominant trend visible on weekly charts. Daily intermediate momentum confirms the current phase of that trend. 4-hour entry timing pinpoints the moment to commit capital.
Understanding Why Signals Do or Do Not Occur
When analyzing the chart and wondering why an expected signal has not appeared, follow this diagnostic process using the status table:
1. Check Macro First: Is price above (for long) or below (for short) the macro EMA? If not, no signal is possible regardless of lower timeframe behavior. Wait for price to reclaim or break the macro EMA.
2. Check Intermediate Second: Are BOTH the fast and slow crossover pairs aligned on the intermediate timeframe? A single misaligned pair blocks the signal. The fast pair might be bullish while the slow pair remains bearish during early momentum shifts—this creates a "pending" state where confluence is building but not complete. Patience is required.
3. Check Entry Third: Are BOTH entry crossover pairs aligned on the entry timeframe? These longer-period EMAs are typically the last to confirm, serving as final validation that the lowest timeframe structure supports the trade.
4. Check Bar Confirmation: If "Wait for Bar Close" is enabled (default), no signal appears until the bar finalizes. A setup that appears valid mid-bar may change if price reverses before close.
5. Consider Timeframe Hierarchy: Higher timeframe conditions change less frequently. A bearish macro condition might persist for days while lower timeframes whipsaw. The macro layer is the most important gate—when it's against you, no amount of favorable lower timeframe action will generate a signal.
Market Suitability and Environmental Considerations
Performs Optimally In:
- Trending markets with clear directional phases where momentum builds and sustains
- Liquid instruments where EMAs track price efficiently without gaps distorting calculations
- Markets with sufficient volatility to generate meaningful crossover events
- Instruments commonly analyzed across multiple timeframes by institutional participants (forex pairs, equity indices, major cryptocurrencies, liquid commodities)
Performs Sub optimally In:
- Ranging or choppy market conditions where price oscillates around EMAs without committing to direction—signals may be infrequent and quickly invalidated
- Low-liquidity instruments where price gaps and irregular trading can cause EMA distortions
- During major news events (FOMC, NFP, earnings) where price moves faster than any EMA-based system can adapt—consider pausing around scheduled high-impact events
- Instruments with limited trading hours where higher timeframe data may be sparse (some regional stock markets)
- Highly mean-reverting instruments where trend-following approaches generally underperform
Environmental Awareness: Before applying to any new instrument, observe several signal cycles without trading to understand how the indicator behaves on that specific market's volatility and trend characteristics. What works on a trending forex pair may need adjustment for a range-bound stock or a volatile cryptocurrency.
What Makes This Indicator Original
While Exponential Moving Averages are fundamental tools available in every charting platform, this indicator's value derives from its specific architectural decisions and their combined effect:
1. Hierarchical Three-Layer Cascade: Most multi-timeframe tools use two timeframes (higher for trend, lower for entry). Adding a dedicated intermediate momentum layer between strategic direction and tactical execution creates an additional filter that catches false signals occurring when macro and micro temporarily align but lack genuine momentum backing. This three-layer architecture reduces signals compared to two-layer systems, but the signals that remain have passed an additional quality check.
2. Dual-Crossover Validation Per Layer: Layers 2 and 3 each require two separate EMA pairs to agree before passing. This internal redundancy means a single whipsaw crossover cannot trigger a signal—both the fast-reacting pair AND the slower-confirming pair must independently reach the same directional conclusion. The probability of both pairs simultaneously giving false readings is meaningfully lower than a single crossover failing.
3. Inverse Period Scaling Across Timeframes: Conventional logic suggests using shorter indicator periods on lower timeframes and longer periods on higher timeframes. This indicator deliberately inverts that relationship: short EMAs on the macro layer for responsiveness, longer EMAs on the entry layer for noise filtration. The macro layer is meant to capture trend changes quickly (hence short EMA). The entry layer is meant to prevent premature commitment to trades (hence longer EMAs that require sustained momentum before confirming).
4. Asymmetric Entry-Exit Logic: The aggressive exit approach (any layer breaking ends the signal) contrasted with the conservative entry approach (all layers must align) creates a risk profile tilted toward capital preservation. This asymmetry is a deliberate design choice reflecting the reality that protecting gains and limiting losses is more important than maximizing trade frequency.
5. State and Event Separation: Distinguishing between being in a favorable state (background color) and entering a favorable state (marker) allows the indicator to serve multiple purposes without redundancy. The background provides ongoing context; the markers provide actionable signals. Traders can use states for bias confirmation while using events for discrete trade management.
6. Diagnostic Status Table: The real-time display of each layer's status transforms the indicator from a black-box signal generator into a transparent system where traders understand exactly what is happening and why. This educational component accelerates learning and builds genuine understanding of multi-timeframe dynamics.
Disclaimer
This indicator is a technical analysis tool that processes historical price data through mathematical transformations. It identifies patterns based on past data and displays information to assist with analysis. It does not predict future price movements, guarantee trading profits, or constitute financial advice.
All trading and investing involves risk of loss. Past performance, including any backtested results visible on historical charts, is not indicative of future results. Markets can and do behave differently than historical patterns suggest they will.
Never risk capital you cannot afford to lose. Consider consulting a qualified financial advisor before making trading decisions. Indicator

Indicator

Adaptive Statistical Smoother [Pineify]Adaptive Statistical Smoother
The Adaptive Statistical Smoother is an overlay trend-following indicator that combines a forward-backward zero-lag EMA approximation with an R-Squared trend filter to produce an adaptive moving average that tightly tracks price during trending markets and deliberately diverges during ranging conditions — solving the core problem of traditional moving averages that generate excessive whipsaw signals in sideways price action. Instead of using a fixed smoothing period or a single-pass EMA, the indicator first constructs a bidirectional (zero-phase-shift) EMA baseline that virtually eliminates the lag inherent in standard exponential averages, then modulates how closely the final adaptive MA follows this baseline based on the real-time R-Squared coefficient of determination. When R-Squared confirms a strong linear trend, the MA converges toward the zero-lag target proportionally to trend strength; when R-Squared indicates a ranging market, the MA actively pushes away from price in the last known trend direction, creating a natural buffer zone that suppresses false crossovers. Dynamic standard-deviation volatility bands and R-Squared-filtered buy/sell signals complete the system, giving traders a statistically grounded, self-adjusting trend tool with built-in noise rejection.
Key Features
Forward-backward zero-lag EMA approximation — a two-pass EMA computation (forward pass followed by a backward iteration over historical values) that closely approximates a bidirectional filter, virtually eliminating the phase lag that causes standard EMAs to react late to trend changes.
R-Squared adaptive trend filter — the Pearson correlation coefficient squared (R²) between price and bar index measures how well a linear trend fits recent data. Values above 0.5 indicate trending conditions; values below indicate ranging. This statistical metric drives the core adaptive behavior of the MA.
Dual-regime moving average — during trending markets (R² > 0.5), the adaptive MA blends toward the zero-lag target proportionally to R², tracking price closely. During ranging markets (R² ≤ 0.5), the MA diverges from price in the last known direction, creating a buffer that prevents whipsaw crossovers.
Dynamic volatility bands — standard deviation of the source price over the statistical window, scaled by a user-defined multiplier, creates upper and lower bands that automatically expand during volatile periods and contract during quiet ones.
R-Squared-filtered buy/sell signals — crossover signals between price and the adaptive MA are only generated when R² exceeds 0.3, ensuring signals fire only when there is statistically meaningful trend strength and suppressing noise during flat markets.
Trend-adaptive coloring — the MA line, volatility cloud fill, and bar colors all dynamically switch between bullish and bearish colors based on the current trend state, providing instant visual identification of the prevailing direction.
How It Works
The indicator follows a multi-stage calculation pipeline that transforms raw price data into an adaptive, statistically filtered trend line:
Forward-backward zero-lag baseline: A standard EMA is first computed on the source price. Then a second pass iterates backward over the historical EMA values, applying the same EMA alpha (2 / (smooth + 1)) at each step across the lookback window. This two-pass approach approximates a zero-phase-shift filter — the resulting baseline tracks price turns almost immediately, without the half-period delay of a conventional EMA. This baseline serves as the "target" that the adaptive MA will converge toward when the market is trending.
R-Squared trend detection: The Pearson correlation between closing prices and bar indices over the statistical window is squared to produce R². This coefficient of determination measures the proportion of price variance explained by a linear trend. R² near 1.0 means price is moving in a clean, directional manner; R² near 0.0 means price is oscillating without a clear direction. The 0.5 threshold divides the market into "trending" and "ranging" regimes.
Adaptive MA computation: In trending mode (R² > 0.5), the adaptive MA is computed as a weighted blend: R² × target + (1 − R²) × previous MA. Stronger trends (higher R²) pull the MA closer to the zero-lag target; weaker trends allow it to lag slightly, providing natural smoothing. In ranging mode (R² ≤ 0.5), the MA moves away from price by the magnitude of the target's recent change, in the direction of the last known trend bias. This deliberate divergence creates separation between price and the MA, preventing the repeated false crossovers that plague fixed-parameter moving averages in choppy markets.
Volatility bands and signal generation: Standard deviation bands are added around the adaptive MA to visualize the current volatility regime. Buy and sell signals are generated on price crossovers of the MA, but only when R² exceeds 0.3 — a secondary filter that ensures even the crossover signals carry minimum statistical trend evidence.
Trading Ideas and Insights
Trend-following entries with lag reduction: The zero-lag baseline allows the adaptive MA to respond to trend initiations significantly faster than a standard EMA of equivalent smoothing. When a BUY signal fires (price crosses above the MA with R² > 0.3), the entry is closer to the actual trend start than what a conventional moving average crossover would provide, improving the risk/reward ratio of trend-following trades.
Whipsaw avoidance in ranging markets: The adaptive divergence mechanism during low-R² periods is specifically designed to prevent the most common failure mode of moving average systems — repeated false crossovers during sideways consolidation. Traders can trust that when a signal does fire, the statistical environment supports a directional move.
Volatility band breakout confirmation: When price breaks above the upper band or below the lower band while the adaptive MA is already in the corresponding trend state, it confirms a high-volatility directional expansion. These breakouts can be used to add to existing positions or to set trailing stops at the opposite band.
R-Squared as a standalone filter: Even without acting on the buy/sell signals, traders can use the implicit R-Squared regime (visible through the MA's behavior — tight tracking vs. divergence) as a filter for other strategies. Apply your existing entry rules only when the MA is tightly tracking price (trending regime), and stand aside when the MA visibly separates from price (ranging regime).
Multi-timeframe trend alignment: Apply the indicator on both a higher timeframe (e.g., daily) and a lower timeframe (e.g., 1-hour). Take lower-timeframe BUY signals only when the higher-timeframe adaptive MA is in bullish state, and SELL signals only when the higher-timeframe is bearish. This multi-timeframe alignment leverages the adaptive nature of the indicator across different time horizons.
How Multiple Indicators Work Together
The Adaptive Statistical Smoother integrates three distinct analytical components into a unified adaptive system, each addressing a specific weakness of traditional moving averages:
Forward-backward zero-lag EMA (lag elimination): Standard moving averages inherently lag price by approximately half their lookback period. The bidirectional EMA approximation addresses this by running a second smoothing pass in reverse over historical values, canceling out the phase shift. This gives the adaptive MA a responsive baseline to track during trends — without the noise sensitivity that comes from simply using a very short-period EMA.
R-Squared trend filter (regime detection): The R-Squared coefficient provides an objective, statistical answer to the question "is the market trending right now?" This replaces subjective visual assessment or fixed-threshold approaches (like ADX) with a measure rooted in linear regression theory. R² directly controls how the adaptive MA behaves — it is not merely a signal filter but the core adaptive mechanism that switches the MA between trend-tracking and range-diverging modes.
Standard deviation volatility bands (context visualization): The bands add a volatility dimension that neither the zero-lag baseline nor the R-Squared filter provides. They show traders the expected range of price movement around the adaptive MA, helping to distinguish between normal retracements within a trend (price stays within bands) and genuine trend reversals (price breaks through bands and crosses the MA).
The synergy is structural: zero-lag EMA (responsive baseline) → R-Squared (regime classification) → adaptive blending/divergence (the adaptive MA itself) → volatility bands (context envelope) → R²-filtered crossover signals (actionable entries/exits). The zero-lag baseline ensures the MA has a fast, accurate target to track; R-Squared determines whether to track it or diverge; and the volatility bands provide the visual context for interpreting the MA's position relative to price. Each component compensates for a specific weakness — lag, false signals in ranges, and lack of volatility context — that would undermine the system if any single component were used alone.
Unique Aspects
Statistical regime switching: Unlike adaptive moving averages that use volatility or momentum to adjust their speed (e.g., KAMA, VIDYA), the Adaptive Statistical Smoother uses R-Squared — a measure of trend linearity — to switch between two fundamentally different behaviors: convergence toward a target during trends and deliberate divergence during ranges. This is a qualitatively different approach that directly addresses the root cause of whipsaw (lack of trend) rather than a symptom (high volatility).
Bidirectional EMA approximation in Pine Script: True zero-phase-shift filters require processing the entire dataset in both directions, which is not natively possible in real-time bar-by-bar computation. The forward-backward loop in this indicator approximates this by iterating over historical forward-EMA values within the lookback window, achieving near-zero lag without requiring future data — a practical implementation of signal processing theory within Pine Script's constraints.
Directional divergence mechanism: During ranging markets, the adaptive MA does not simply freeze or slow down — it actively moves away from price in the last known trend direction. This creates increasing separation that requires a genuine trend resumption (not just noise) to produce a crossover, providing a self-adjusting buffer proportional to the ranging market's volatility.
Dual-threshold R-Squared filtering: The indicator uses two R-Squared thresholds for different purposes: 0.5 for the MA's adaptive regime switch (trending vs. ranging behavior) and 0.3 for signal generation (minimum trend evidence for crossover signals). This layered approach means the MA adapts its behavior at a stricter threshold while still allowing signals in moderately trending conditions, balancing responsiveness with noise rejection.
How to Use
Add the indicator to your chart. It overlays directly on the price chart, displaying the adaptive MA line, upper and lower volatility bands, and a shaded volatility cloud between the bands.
Observe the adaptive MA line (thick colored line). When it is green and tightly tracking price, the market is in a statistically confirmed uptrend. When it is red and tracking price closely, the market is in a confirmed downtrend. When the MA visibly separates from price, the R-Squared filter has detected a ranging market and the MA is in divergence mode.
Watch for BUY signals (green "BUY" labels below bars) — these fire when price crosses above the adaptive MA and R-Squared exceeds 0.3, indicating a bullish crossover with minimum statistical trend support. Consider entering long positions or closing short positions.
Watch for SELL signals (red "SELL" labels above bars) — these fire when price crosses below the adaptive MA and R-Squared exceeds 0.3, indicating a bearish crossover with trend confirmation. Consider entering short positions or closing long positions.
Use the volatility bands (shaded cloud) to gauge the expected price range around the adaptive MA. Price touching the upper band in an uptrend suggests extended momentum; price touching the lower band in a downtrend suggests extended selling pressure. Reversals from band extremes back toward the MA can serve as mean-reversion opportunities within the prevailing trend.
Monitor bar colors for a quick visual scan of the current trend state across the chart — green bars indicate bullish trend, red bars indicate bearish trend.
Adjust the Statistical Window to match your trading timeframe. Shorter windows (10–15) make the R-Squared filter more responsive to recent price behavior — suitable for intraday or short-term swing trading. Longer windows (25–50) provide a more stable trend assessment — suitable for position trading on daily or weekly charts.
Customization
Statistical Window (default: 20): The lookback period for both the R-Squared calculation and the standard deviation bands. This is the most impactful parameter. Shorter values make the indicator more responsive — the R-Squared filter reacts faster to regime changes and the volatility bands adjust more quickly. Longer values produce smoother, more stable readings that filter out short-term noise but may delay regime detection. Start with 20 for daily charts and adjust based on your asset's typical trend duration.
Forward-Backward Smoothing (default: 10): Controls the EMA period used in the zero-lag approximation. Lower values (5–7) produce a baseline that tracks price very closely, making the adaptive MA highly responsive during trends but potentially more sensitive to noise. Higher values (15–20) produce a smoother baseline with slightly more residual lag but better noise rejection. The interaction between this parameter and the Statistical Window determines the overall character of the indicator.
Volatility Multiplier (default: 1.5): Scales the standard deviation bands around the adaptive MA. Higher values (2.0–3.0) produce wider bands that contain more price action — useful for volatile assets or for identifying only extreme deviations. Lower values (0.5–1.0) produce tighter bands that price breaks more frequently — useful for identifying smaller volatility expansions or for more active trading styles.
Bullish / Bearish Colors: Fully customizable colors applied to the adaptive MA line, volatility bands, cloud fill, signal labels, and bar coloring. Adjust to match your chart theme or to improve visibility on different background colors.
Conclusion
The Adaptive Statistical Smoother brings a statistically rigorous approach to trend following by combining a forward-backward zero-lag EMA approximation with an R-Squared-driven adaptive regime filter. The zero-lag baseline eliminates the inherent delay of conventional moving averages, while the R-Squared coefficient provides an objective, real-time assessment of whether the market is trending or ranging. During trends, the adaptive MA converges toward the responsive baseline proportionally to trend strength; during ranges, it deliberately diverges to create a whipsaw-resistant buffer zone. Dynamic volatility bands add a contextual envelope, and dual-threshold R-Squared filtering ensures that buy and sell signals carry minimum statistical trend evidence. Whether used as a standalone trend-following system or as an adaptive trend filter for other strategies, the Adaptive Statistical Smoother provides a self-adjusting framework that adapts its behavior to the current market regime — tracking trends closely when they exist and stepping aside when they do not.
Indicator
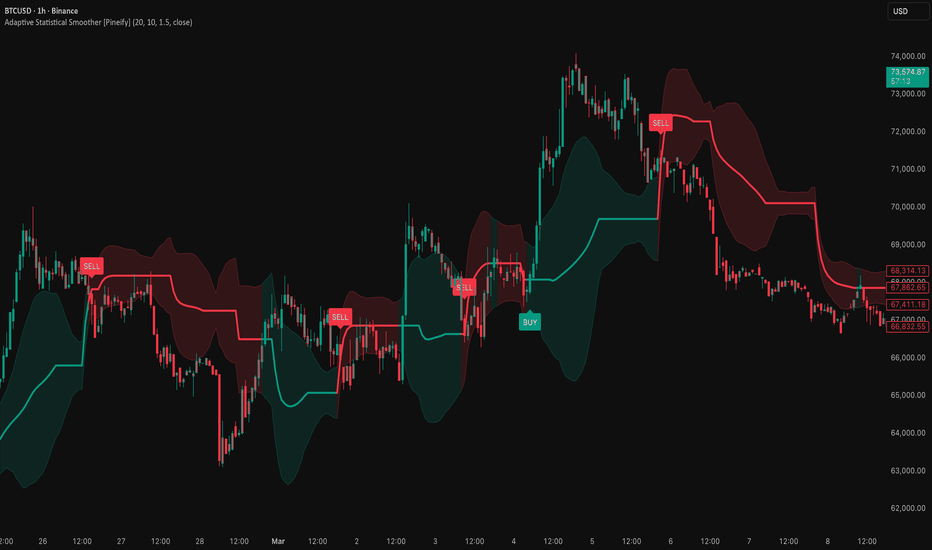
Indicator
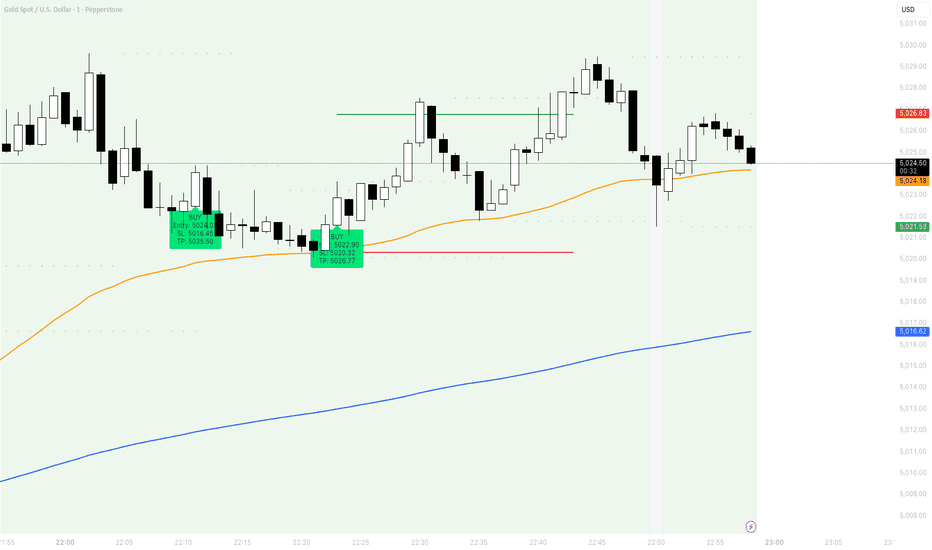
Support Band of TrendSupport Band of Trend
by MasterTony
**Support Band with Dynamic Ichimoku Boundaries**
This indicator combines three layered tools into a single clean overlay: a trend-adaptive support/resistance band using golden moving averages, dynamic Ichimoku Tenkan/Kijun boundaries, and price pivot S/R levels. Together they define a structured zone where price is expected to find support in bull trends and resistance in bear trends.
---
**How It's Calculated**
**Trend Direction (ADX + 200 SMA)**
The indicator continuously reads market direction using two inputs. The DMI system compares DI+ against DI− to determine which side has directional dominance. The 200-period SMA acts as a tiebreaker when DI+ and DI− are equal. There is no neutral state — the indicator always commits to bull or bear based on whichever side is dominant at that moment.
**Inner Support Band (SMA 20 / EMA 21)**
The core of the indicator is a filled zone between the 20-period Simple Moving Average and the 21-period Exponential Moving Average. Because the SMA and EMA are nearly identical in length but calculated differently, the fill between them defines a tight dynamic zone that price frequently interacts with. In a bull trend the band is green, acting as a floor. In a bear trend it turns red, acting as a ceiling.
**Outer Boundary (Tenkan-Sen / Kijun-Sen Band)**
Wrapping the inner band is a filled zone between the Tenkan-Sen and Kijun-Sen, ported from a full adaptive Ichimoku engine. Both lines use dynamic lengths driven by a volume oscillator (OBV), ATR volatility, and a Chikou trend filter. When conditions are bullish the lengths compress toward their minimums (9 and 20), making the lines react faster. When conditions are bearish the lengths expand toward their maximums (30 and 60), making them slower and more resistant. The Tenkan and Kijun lines themselves are colored teal when Tenkan is above Kijun and purple when below. The filled zone between them matches the overall bull/bear color of the indicator.
**Price Pivot S/R Lines**
The indicator identifies the last three swing highs and swing lows using a 5-bar left/5-bar right pivot calculation. Each level is drawn as a horizontal dashed line extended to the right — red for resistance, green for support. These are static reference points showing where price has previously reversed.
**200 SMA**
Plotted as a light blue reference line. Used internally for trend bias and visually as the macro trend anchor.
---
**How to Read It**
The indicator is designed to be read as a layered zone, not a single line.
When the bands are **green**, the entire filled area from the outer TK boundary down to the inner SMA/EMA band is a **support zone**. Price pulling back into this zone during an uptrend is expected behavior. The tighter the band compression, the stronger the trend.
When the bands are **red**, the same zone becomes **resistance**. Price rallying back up into it during a downtrend is a selling opportunity. A failure to break above the zone confirms bearish continuation.
The **Tenkan/Kijun color** gives you a secondary read. Teal means the fast line is above the slow line — momentum is bullish within the Ichimoku framework. Purple means the fast line has crossed below — momentum has shifted bearish. When the band color and the TK color agree, the signal is stronger.
The **pivot S/R lines** give you price memory. A green pivot level sitting just below the band in a bull trend creates a confluence support cluster. A red pivot level just above the band in a bear trend creates a confluence resistance cluster.
---
**How to Trade With It**
**Bull Trend Pullback Entry**
Wait for the band to be green. Let price pull back into the inner SMA/EMA band or the wider TK zone. Look for a candle reversal or momentum shift back upward while inside the zone. Enter long with a stop below the outer TK boundary. The nearest green pivot S/R line below acts as your invalidation level.
**Bear Trend Rally Entry**
Wait for the band to be red. Let price rally back up into the inner band or TK zone. Look for rejection or a momentum shift downward while inside the zone. Enter short with a stop above the outer TK boundary. The nearest red pivot S/R line above acts as your invalidation level.
**Trend Change Warning**
When the band flips from green to red or red to green, it signals a shift in directional dominance. This is not an immediate entry signal — it is a warning to stop trading in the previous direction and wait for the new color to confirm with a pullback setup.
**Confluence Filter**
The highest probability setups occur when all three layers agree: the band color matches the trade direction, the Tenkan is above Kijun (for longs) or below (for shorts), and a pivot S/R level is nearby providing additional structure.
---
Indicator

Aura: Adaptive Statistical Smoother [Pineify]Aura: Adaptive Statistical Smoother
The Aura: Adaptive Statistical Smoother is an overlay trend-following indicator that combines a forward-backward zero-lag EMA approximation with an R-Squared trend filter to produce an adaptive moving average that tightly tracks price during trending markets and deliberately diverges during ranging conditions — solving the core problem of traditional moving averages that generate excessive whipsaw signals in sideways price action. Instead of using a fixed smoothing period or a single-pass EMA, the indicator first constructs a bidirectional (zero-phase-shift) EMA baseline that virtually eliminates the lag inherent in standard exponential averages, then modulates how closely the final Aura MA follows this baseline based on the real-time R-Squared coefficient of determination. When R-Squared confirms a strong linear trend, the Aura MA converges toward the zero-lag target proportionally to trend strength; when R-Squared indicates a ranging market, the MA actively pushes away from price in the last known trend direction, creating a natural buffer zone that suppresses false crossovers. Dynamic standard-deviation volatility bands and R-Squared-filtered buy/sell signals complete the system, giving traders a statistically grounded, self-adjusting trend tool with built-in noise rejection.
Key Features
Forward-backward zero-lag EMA approximation — a two-pass EMA computation (forward pass followed by a backward iteration over historical values) that closely approximates a bidirectional filter, virtually eliminating the phase lag that causes standard EMAs to react late to trend changes.
R-Squared adaptive trend filter — the Pearson correlation coefficient squared (R²) between price and bar index measures how well a linear trend fits recent data. Values above 0.5 indicate trending conditions; values below indicate ranging. This statistical metric drives the core adaptive behavior of the Aura MA.
Dual-regime moving average — during trending markets (R² > 0.5), the Aura MA blends toward the zero-lag target proportionally to R², tracking price closely. During ranging markets (R² ≤ 0.5), the MA diverges from price in the last known direction, creating a buffer that prevents whipsaw crossovers.
Dynamic volatility bands — standard deviation of the source price over the statistical window, scaled by a user-defined multiplier, creates upper and lower bands that automatically expand during volatile periods and contract during quiet ones.
R-Squared-filtered buy/sell signals — crossover signals between price and the Aura MA are only generated when R² exceeds 0.3, ensuring signals fire only when there is statistically meaningful trend strength and suppressing noise during flat markets.
Trend-adaptive coloring — the Aura MA line, volatility cloud fill, and bar colors all dynamically switch between bullish and bearish colors based on the current trend state, providing instant visual identification of the prevailing direction.
How It Works
The indicator follows a multi-stage calculation pipeline that transforms raw price data into an adaptive, statistically filtered trend line:
Forward-backward zero-lag baseline: A standard EMA is first computed on the source price. Then a second pass iterates backward over the historical EMA values, applying the same EMA alpha (2 / (smooth + 1)) at each step across the lookback window. This two-pass approach approximates a zero-phase-shift filter — the resulting baseline tracks price turns almost immediately, without the half-period delay of a conventional EMA. This baseline serves as the "target" that the adaptive Aura MA will converge toward when the market is trending.
R-Squared trend detection: The Pearson correlation between closing prices and bar indices over the statistical window is squared to produce R². This coefficient of determination measures the proportion of price variance explained by a linear trend. R² near 1.0 means price is moving in a clean, directional manner; R² near 0.0 means price is oscillating without a clear direction. The 0.5 threshold divides the market into "trending" and "ranging" regimes.
Adaptive MA computation: In trending mode (R² > 0.5), the Aura MA is computed as a weighted blend: R² × target + (1 − R²) × previous Aura MA. Stronger trends (higher R²) pull the MA closer to the zero-lag target; weaker trends allow it to lag slightly, providing natural smoothing. In ranging mode (R² ≤ 0.5), the MA moves away from price by the magnitude of the target's recent change, in the direction of the last known trend bias. This deliberate divergence creates separation between price and the MA, preventing the repeated false crossovers that plague fixed-parameter moving averages in choppy markets.
Volatility bands and signal generation: Standard deviation bands are added around the Aura MA to visualize the current volatility regime. Buy and sell signals are generated on price crossovers of the Aura MA, but only when R² exceeds 0.3 — a secondary filter that ensures even the crossover signals carry minimum statistical trend evidence.
Trading Ideas and Insights
Trend-following entries with lag reduction: The zero-lag baseline allows the Aura MA to respond to trend initiations significantly faster than a standard EMA of equivalent smoothing. When a BUY signal fires (price crosses above the Aura MA with R² > 0.3), the entry is closer to the actual trend start than what a conventional moving average crossover would provide, improving the risk/reward ratio of trend-following trades.
Whipsaw avoidance in ranging markets: The adaptive divergence mechanism during low-R² periods is specifically designed to prevent the most common failure mode of moving average systems — repeated false crossovers during sideways consolidation. Traders can trust that when a signal does fire, the statistical environment supports a directional move.
Volatility band breakout confirmation: When price breaks above the upper band or below the lower band while the Aura MA is already in the corresponding trend state, it confirms a high-volatility directional expansion. These breakouts can be used to add to existing positions or to set trailing stops at the opposite band.
R-Squared as a standalone filter: Even without acting on the buy/sell signals, traders can use the implicit R-Squared regime (visible through the MA's behavior — tight tracking vs. divergence) as a filter for other strategies. Apply your existing entry rules only when the Aura MA is tightly tracking price (trending regime), and stand aside when the MA visibly separates from price (ranging regime).
Multi-timeframe trend alignment: Apply the Aura indicator on both a higher timeframe (e.g., daily) and a lower timeframe (e.g., 1-hour). Take lower-timeframe BUY signals only when the higher-timeframe Aura MA is in bullish state, and SELL signals only when the higher-timeframe is bearish. This multi-timeframe alignment leverages the adaptive nature of the indicator across different time horizons.
How Multiple Indicators Work Together
The Aura indicator integrates three distinct analytical components into a unified adaptive system, each addressing a specific weakness of traditional moving averages:
Forward-backward zero-lag EMA (lag elimination): Standard moving averages inherently lag price by approximately half their lookback period. The bidirectional EMA approximation addresses this by running a second smoothing pass in reverse over historical values, canceling out the phase shift. This gives the Aura MA a responsive baseline to track during trends — without the noise sensitivity that comes from simply using a very short-period EMA.
R-Squared trend filter (regime detection): The R-Squared coefficient provides an objective, statistical answer to the question "is the market trending right now?" This replaces subjective visual assessment or fixed-threshold approaches (like ADX) with a measure rooted in linear regression theory. R² directly controls how the Aura MA behaves — it is not merely a signal filter but the core adaptive mechanism that switches the MA between trend-tracking and range-diverging modes.
Standard deviation volatility bands (context visualization): The bands add a volatility dimension that neither the zero-lag baseline nor the R-Squared filter provides. They show traders the expected range of price movement around the Aura MA, helping to distinguish between normal retracements within a trend (price stays within bands) and genuine trend reversals (price breaks through bands and crosses the MA).
The synergy is structural: zero-lag EMA (responsive baseline) → R-Squared (regime classification) → adaptive blending/divergence (the Aura MA itself) → volatility bands (context envelope) → R²-filtered crossover signals (actionable entries/exits). The zero-lag baseline ensures the MA has a fast, accurate target to track; R-Squared determines whether to track it or diverge; and the volatility bands provide the visual context for interpreting the MA's position relative to price. Each component compensates for a specific weakness — lag, false signals in ranges, and lack of volatility context — that would undermine the system if any single component were used alone.
Unique Aspects
Statistical regime switching: Unlike adaptive moving averages that use volatility or momentum to adjust their speed (e.g., KAMA, VIDYA), the Aura MA uses R-Squared — a measure of trend linearity — to switch between two fundamentally different behaviors: convergence toward a target during trends and deliberate divergence during ranges. This is a qualitatively different approach that directly addresses the root cause of whipsaw (lack of trend) rather than a symptom (high volatility).
Bidirectional EMA approximation in Pine Script: True zero-phase-shift filters require processing the entire dataset in both directions, which is not natively possible in real-time bar-by-bar computation. The forward-backward loop in this indicator approximates this by iterating over historical forward-EMA values within the lookback window, achieving near-zero lag without requiring future data — a practical implementation of signal processing theory within Pine Script's constraints.
Directional divergence mechanism: During ranging markets, the Aura MA does not simply freeze or slow down — it actively moves away from price in the last known trend direction. This creates increasing separation that requires a genuine trend resumption (not just noise) to produce a crossover, providing a self-adjusting buffer proportional to the ranging market's volatility.
Dual-threshold R-Squared filtering: The indicator uses two R-Squared thresholds for different purposes: 0.5 for the MA's adaptive regime switch (trending vs. ranging behavior) and 0.3 for signal generation (minimum trend evidence for crossover signals). This layered approach means the MA adapts its behavior at a stricter threshold while still allowing signals in moderately trending conditions, balancing responsiveness with noise rejection.
How to Use
Add the indicator to your chart. It overlays directly on the price chart, displaying the Aura MA line, upper and lower volatility bands, and a shaded volatility cloud between the bands.
Observe the Aura MA line (thick colored line). When it is green and tightly tracking price, the market is in a statistically confirmed uptrend. When it is red and tracking price closely, the market is in a confirmed downtrend. When the MA visibly separates from price, the R-Squared filter has detected a ranging market and the MA is in divergence mode.
Watch for BUY signals (green "BUY" labels below bars) — these fire when price crosses above the Aura MA and R-Squared exceeds 0.3, indicating a bullish crossover with minimum statistical trend support. Consider entering long positions or closing short positions.
Watch for SELL signals (red "SELL" labels above bars) — these fire when price crosses below the Aura MA and R-Squared exceeds 0.3, indicating a bearish crossover with trend confirmation. Consider entering short positions or closing long positions.
Use the volatility bands (shaded cloud) to gauge the expected price range around the Aura MA. Price touching the upper band in an uptrend suggests extended momentum; price touching the lower band in a downtrend suggests extended selling pressure. Reversals from band extremes back toward the MA can serve as mean-reversion opportunities within the prevailing trend.
Monitor bar colors for a quick visual scan of the current trend state across the chart — green bars indicate bullish trend, red bars indicate bearish trend.
Adjust the Statistical Window to match your trading timeframe. Shorter windows (10–15) make the R-Squared filter more responsive to recent price behavior — suitable for intraday or short-term swing trading. Longer windows (25–50) provide a more stable trend assessment — suitable for position trading on daily or weekly charts.
Customization
Statistical Window (default: 20): The lookback period for both the R-Squared calculation and the standard deviation bands. This is the most impactful parameter. Shorter values make the indicator more responsive — the R-Squared filter reacts faster to regime changes and the volatility bands adjust more quickly. Longer values produce smoother, more stable readings that filter out short-term noise but may delay regime detection. Start with 20 for daily charts and adjust based on your asset's typical trend duration.
Forward-Backward Smoothing (default: 10): Controls the EMA period used in the zero-lag approximation. Lower values (5–7) produce a baseline that tracks price very closely, making the Aura MA highly responsive during trends but potentially more sensitive to noise. Higher values (15–20) produce a smoother baseline with slightly more residual lag but better noise rejection. The interaction between this parameter and the Statistical Window determines the overall character of the indicator.
Volatility Multiplier (default: 1.5): Scales the standard deviation bands around the Aura MA. Higher values (2.0–3.0) produce wider bands that contain more price action — useful for volatile assets or for identifying only extreme deviations. Lower values (0.5–1.0) produce tighter bands that price breaks more frequently — useful for identifying smaller volatility expansions or for more active trading styles.
Bullish / Bearish Colors: Fully customizable colors applied to the Aura MA line, volatility bands, cloud fill, signal labels, and bar coloring. Adjust to match your chart theme or to improve visibility on different background colors.
Conclusion
The Aura: Adaptive Statistical Smoother brings a statistically rigorous approach to trend following by combining a forward-backward zero-lag EMA approximation with an R-Squared-driven adaptive regime filter. The zero-lag baseline eliminates the inherent delay of conventional moving averages, while the R-Squared coefficient provides an objective, real-time assessment of whether the market is trending or ranging. During trends, the Aura MA converges toward the responsive baseline proportionally to trend strength; during ranges, it deliberately diverges to create a whipsaw-resistant buffer zone. Dynamic volatility bands add a contextual envelope, and dual-threshold R-Squared filtering ensures that buy and sell signals carry minimum statistical trend evidence. Whether used as a standalone trend-following system or as an adaptive trend filter for other strategies, the Aura indicator provides a self-adjusting framework that adapts its behavior to the current market regime — tracking trends closely when they exist and stepping aside when they do not.
Indicator
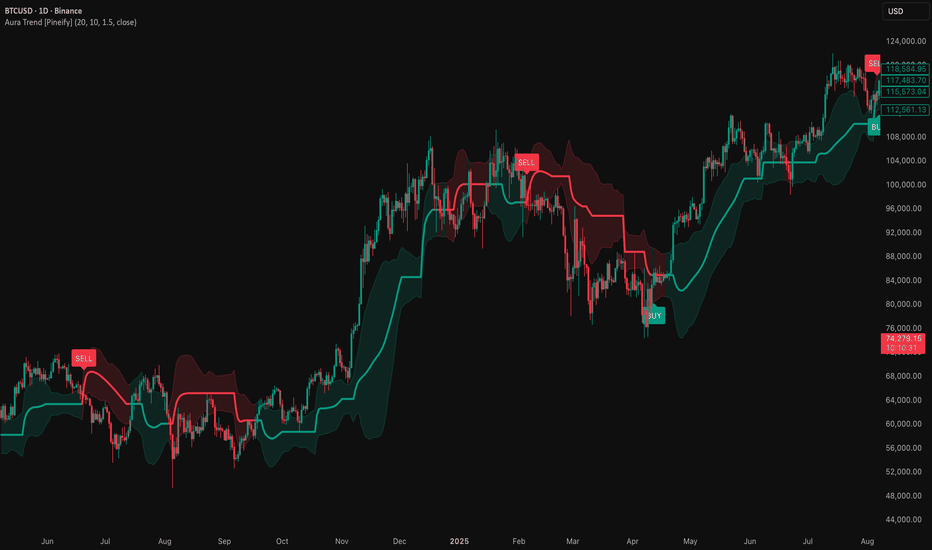
Indicator

Indicator

EMA20 Pullback Target FinderThe EMA Touch Price Predictor is designed to estimate the exact price level where the market will intersect with the EMA in real time. Because the Exponential Moving Average continuously adjusts as price moves, the actual price that will touch the EMA is not always obvious while the market is moving.
This indicator solves that problem by calculating the dynamic price level at which the current price would equal the EMA, based on the EMA’s recursive formula. It then displays this level directly on the chart as a horizontal line and label, allowing traders to clearly see where a real-time EMA touch is likely to occur.
Instead of waiting for price to visually reach the moving average, traders can anticipate the interaction in advance and position entries or exits more precisely.
Key Features
1. Real-time EMA touch prediction based on the EMA calculation formula
2. Displays the projected price where the current bar will intersect with EMA
3. Draws a horizontal line marking the predicted touch level directly on the chart
4. Optional label showing EMA value, touch price, and distance from current price
5. Customizable line style, width, and colors
6. Works on any timeframe and any EMA length
How It Works
The indicator calculates the EMA normally, but also determines the price level required for the current price to equal the EMA at that moment. This level effectively represents the true dynamic target where price and the EMA will meet if price continues moving in the current bar.
This tool is especially useful for traders who rely on EMA-based strategies, helping them anticipate interactions with the moving average instead of reacting after the fact. Indicator

Multiple EMA20Multi-Timeframe EMA20 Levels
This indicator displays the latest EMA(20) values from multiple higher timeframes directly on the current chart. Each selected timeframe calculates its own EMA20 and plots it as a horizontal level, allowing traders to quickly see where important higher-timeframe dynamic support and resistance levels are located.
Instead of switching between different charts, you can view several timeframe EMAs simultaneously. This helps identify confluence zones, track trend alignment, and monitor how price interacts with higher-timeframe moving averages in real time.
Key Features
Multi-timeframe EMA20 levels plotted on a single chart
Dropdown menu for timeframe selection (e.g., 1H, 4H, 1D, 2D, etc.)
Displays the latest EMA value based on the current market price
Customizable line style and width (solid, dashed, or dotted)
Color-coded levels for easy visual distinction
Optional labels showing timeframe and EMA value
Designed to quickly highlight higher-timeframe support and resistance
Typical Use Cases
Identify higher-timeframe dynamic support/resistance
Spot EMA confluence across multiple timeframes
Improve entry timing on lower timeframes
Monitor trend structure and pullback zones
This tool is especially useful for traders who combine top-down analysis with intraday execution, allowing them to stay aware of key higher-timeframe levels without leaving the current chart. Indicator

BoaBias: Multi-Timeframe EMA AnalysisWhat it does
BoaBias: Multi-Timeframe EMA Analysis displays Exponential Moving Averages (EMAs) across six timeframes (15m, 1H, 4H, 1D, 3D, 1W) on a single chart and tracks session statistics: how long price stays above or below each EMA, average session lengths, and deviation from the EMA. It marks crossover and crossunder events with labels and projects estimated time to the next cross based on historical averages. Candles are colored by position relative to configurable slow and fast EMAs.
How it works
The indicator uses EMA crossover logic: price above EMA = bullish session (L), price below EMA = bearish session (S). For each timeframe, it counts consecutive bars in each state and detects crosses when the state flips. Session lengths are computed natively on each timeframe (via request.security with barmerge.lookahead_off to avoid repainting). Average session length is calculated over a rolling window (default 200 bars). Deviation is the percentage distance of price from the EMA: (EMA - close) / close * 100. Projected lines extend from the last cross by the average session length in chart bars, scaled to the current chart timeframe—these are estimates, not guarantees.
Originality
This combines multi-timeframe EMA display with session-run statistics and deviation metrics in one overlay. Unlike simple MTF EMA scripts, it adds: (1) average and current session lengths per TF, (2) deviation percentages, (3) cross labels with session length at cross, (4) projected ETA lines based on average session duration, (5) configurable candle coloring by EMA position with entry and retest highlighting. The session logic runs on each TF natively for accurate bar counts.
How to use
EMA lines: Six colored lines (15m yellow, 1H red, 4H green, 1D blue, 3D purple, 1W orange). Adjust lengths in EMA Settings.
Cross labels (S/L): S = price crossed from below EMA up; L = from above down. Number shows bars in the completed session. Enable per TF in Cross Labels.
Final labels (right side): Show deviation %, Avg S/L, Cur S/L, event counts. Enable per TF in Final Labels.
Projected lines: Horizontal lines extend from last cross; vertical ETA lines show estimated next cross. Limit with "Max bars ahead for projections."
Candle coloring: Select slow EMA (default 4H) and fast EMA (default 1H) in Candle Coloring.
Colors indicate:
Lime — price above slow EMA (bullish)
Red — price below slow EMA (bearish)
Gray — price between fast and slow EMA (correction from fast toward slow)
Teal — entry long (price crosses slow EMA up)
Maroon — entry short (price crosses slow EMA down)
Aqua — retest of fast EMA in uptrend, continuation
Orange — retest of fast EMA in downtrend, continuation
Settings: EMA lengths (default 16/24/42/29/30/52), average window (200), label toggles, candle color scheme.
Limitations
Projected ETA lines are based on historical average session lengths and do not predict future price. Use them as context, not as entry signals. Session statistics require sufficient history within the averaging window. Indicator

MTF 200 EMA from 1m to MonthlyThe 200 Exponential Moving Average (EMA) is one of the most widely respected indicators by institutional and retail traders alike for determining long-term trend direction and identifying dynamic support or resistance.
This Multi-Timeframe 200 EMA Tracker allows you to monitor the 200 EMA across 10 different timeframes simultaneously on a single chart. Instead of constantly switching between timeframes to find major levels, this indicator plots them all for you, providing a complete macro and micro view of the market's trend.
Key Features:
10 Timeframes in One: Tracks the 200 EMA for the 1m, 5m, 15m, 30m, 1H, 2H, 4H, Daily, Weekly, and Monthly timeframes.
Dynamic Color Coding: Visualizes momentum at a glance. The EMA lines dynamically change color based on the current price's position:
Green: Price is above the specific timeframe's 200 EMA (Bullish context).
Red: Price is below the specific timeframe's 200 EMA (Bearish context).
Visual Hierarchy: Line thickness increases with higher timeframes to reduce chart clutter and emphasize the most important macro levels. (e.g., the Monthly EMA is thicker than the 5m EMA).
How to Use This Indicator:
Trend Alignment (Confluence): Look for multiple EMA lines to turn green or red simultaneously. When the 1H, 4H, and Daily EMAs are all green, you have strong bullish confluence.
Dynamic Support/Resistance & Magnet Zones: Higher timeframe 200 EMAs (like the 4H, Daily, or Weekly) often act as strong support or resistance. If you are day-trading on a 5m chart, knowing exactly where the Daily 200 EMA is resting can help you set realistic take-profit targets or find high-probability bounce zones.
Breakout Confirmation: Watch for the price to cross and hold above/below a cluster of EMAs to signal a potential macro trend reversal.
⚠️ Important Technical Notes:
Timeframe Compatibility: Pine Script’s request.security() function is designed to pull data from higher timeframes to lower timeframes (e.g., viewing a Daily EMA on a 15m chart). If you attach this indicator to a Daily chart, the lower timeframe EMAs (like 1m or 5m) will only reflect the last known value and will not plot historically accurately across the whole chart. For the best experience, use this on lower timeframe charts (like 5m, 15m, or 1H).
Historical Data: By default, standard MTF indicators use the closing price of the higher timeframe, which means historical visual data might look slightly different than real-time formation. This is standard TradingView behavior. Indicator

EMA and Dow Theory Strategies V4━━━━━━━━━━━━━━━━━━━━━━━━━━━━━━
Overview
EMA and Dow Theory Strategies V4 is a refinement of V3, focused on one core problem: protecting profits on trades that moved in your favor but reversed before reaching the take-profit levels.
The entry logic is unchanged from V3 — EMA slope direction, Dow Theory swing structure, and ADX trend filter. V4 adds a Break Even Stop mechanism that automatically moves the stop-loss to the entry price once floating profit reaches a defined threshold. This single addition meaningfully improves the risk-adjusted performance without sacrificing the strategy's core edge.
The visual interface has also been fully redesigned — gradient Dow Theory zones, a neon EMA glow effect, minimal trade labels, and a real-time status table showing all entry conditions at a glance.
──────────────────────────────
What Changed from V3
Added:
- Break Even Stop (BE Stop) — When floating profit reaches the BE Trigger % threshold, the stop-loss automatically moves to entry price (+ 0.1% buffer for fees). Trades that previously resulted in a loss after being in profit now exit at breakeven instead.
- Real-time Status Table — Displays EMA direction, Dow Theory trend, ADX value, position status, and BE state. Supports Japanese / English toggle.
- Per-element display toggles — Each visual element can be shown or hidden independently via checkboxes.
- Higher TF swing repainting fix — Rebuilt using lookahead_off and confirmed pivot bars to reduce repainting. Note: the higher timeframe swing lines have always been display-only and were never used in entry conditions, so this change does not affect strategy logic.
- Bilingual support — Full Japanese / English language toggle.
Redesigned:
- EMA line now uses a 3-layer glow effect (neon teal / neon red)
- Dow Theory gradient zones simplified from 5 layers to 2 layers
- TP lines changed to semi-transparent lines (TP1 faint → TP3 visible)
- Trade labels now show only final exit results
- Higher TF swing lines thinned and made semi-transparent as reference-only
──────────────────────────────
Parameters & Recommended Ranges
EMA Period — Default: 58 — Range: 30–100
Shorter for high-volatility assets, longer for stable ones.
ATR Factor — Default: 3.8 — Range: 2.5–6.0
Controls TP distance. Higher = wider targets.
Stop Loss (%) — Default: -5.0 — Range: -4 to -10
Wider for volatile assets, tighter for BTC/ETH.
ADX Threshold — Default: 20.5 — Range: 15–28
Higher = stricter range filter, fewer but higher-quality trades.
Swing Length — Default: 13 — Range: 2–20
Larger = less sensitive to minor swings.
BE Trigger (%) — Default: 9.0 — Range: 3.0–15.0
Set below TP1 distance for protection before TP1 is reached.
──────────────────────────────
Recommended Settings by Asset Type
Meme coins (DOGE, SHIB, etc.)
EMA: 44–58 / ATR: 3.5–5.0 / SL: -5 to -8% / ADX: 18–22 / Swing: 10–15 / BE: 7–10%
Major assets (BTC, ETH)
EMA: 55–80 / ATR: 2.5–4.0 / SL: -4 to -6% / ADX: 20–25 / Swing: 8–15 / BE: 5–8%
Mid-cap alts (SOL, SUI, etc.)
EMA: 35–55 / ATR: 4.0–5.5 / SL: -5 to -7% / ADX: 18–23 / Swing: 8–15 / BE: 6–10%
Small-cap alts
EMA: 30–50 / ATR: 4.5–6.0 / SL: -7 to -10% / ADX: 18–22 / Swing: 5–12 / BE: 8–12%
──────────────────────────────
Recommended Settings by Timeframe
1–5 min: ADX threshold 15–20
15 min – 1 hour: ADX threshold 18–23
2–4 hour: ADX threshold 20–25 (default settings optimized for 2H)
──────────────────────────────
Entry Conditions
Long: EMA slope rising AND Dow Theory trend up AND ADX > threshold
Short: EMA slope falling AND Dow Theory trend down AND ADX > threshold
──────────────────────────────
Exit Conditions
TP1: Entry + ATR x Factor x 1 → close 30%
TP2: Entry + ATR x Factor x 2 → close 30%
TP3: Entry + ATR x Factor x 3 → close 30%
Stop Loss: Fixed % from entry → full close
Break Even Stop: Triggered once profit >= BE Trigger % → full close at entry price
Trend Reversal: Dow Theory swing flip → full close
──────────────────────────────
Visual Features
EMA line: 3-layer neon glow — teal when rising, red when falling
Dow Theory zones: 2-layer gradient from swing high/low to current price
Swing lines: Horizontal support/resistance at current swing high/low
TP lines: Semi-transparent lines, TP1 faint to TP3 visible
BE Stop line: Gold line shown when BE is active
Higher TF swing: Thin reference lines from the 4H timeframe
Gray background: ADX below threshold (range-bound zone, no entries)
Status Table: Real-time display of all entry conditions and current state
This strategy is designed for trend-following on crypto assets, primarily on the 1H–4H timeframe. Default settings are optimized for DOGE on the 2H chart. Always backtest on your target asset before live trading. Past performance does not guarantee future results.
━━━━━━━━━━━━━━━━━━━━━━━━━━━━━━
概要
EMA and Dow Theory Strategies V4 は、V3をベースに改良したバージョンです。解決した課題は一つ——含み益が出ていたにもかかわらず、TP到達前に相場が反転して損失になるトレードを減らすことです。
エントリーロジックはV3から変わっていません。EMAの傾き、ダウ理論のスイング構造、ADXトレンドフィルターの3条件です。V4ではこれにブレークイーブンストップを追加しました。含み益が設定したしきい値%に達すると、損切りラインが自動的にエントリー価格に移動します。このシンプルな追加一つで、ストラテジーの本質的なエッジを損なわずにリスク調整後のパフォーマンスが改善されています。
また、チャートの視覚表現も全面的に刷新しました。ダウ理論ゾーンのグラデーション、EMAのネオングロー効果、すっきりしたトレードラベル、そしてエントリー条件をひと目で確認できるステータステーブルを追加しています。
──────────────────────────────
V3からの主な変更点
追加したもの:
- ブレークイーブンストップ(BE Stop) — 含み益がBE発動しきい値%に達すると、損切りラインがエントリー価格(+手数料分0.1%バッファ)に自動移動。以前は「プラスになったのに最終的にマイナス」で終わっていたトレードがブレークイーブン撤退になります。
- ステータステーブル — EMA方向・ダウ理論トレンド・ADX値・ポジション状態・BEの状態をリアルタイムで一覧表示。日本語・英語の切り替えに対応。
- 描画要素の個別ON/OFF — 各表示要素をチェックボックスで個別に切り替え可能。
- 上位足スイングラインの再描画修正 — lookahead_off と確定済みピボットバーを使用して再描画を低減。なお、上位足スイングラインはもともとエントリー条件には使用しておらず、あくまで参考表示のみです。この修正はストラテジーのロジックに影響しません。
- 日英バイリンガル対応 — ステータステーブルと表示ラベルの日本語・英語切り替えに対応。
刷新したもの:
- EMAラインが3層グロー効果(ネオンティール / ネオンレッド)に
- ダウ理論グラデーションゾーンを5層→2層に簡略化
- TPラインを半透明ラインに変更(TP1が最も薄く、TP3が最も濃い)
- トレードラベルは最終決済時のみ表示(部分利確のラベルは非表示)
- 上位足スイングラインを細く・半透明にして参考表示に
──────────────────────────────
パラメーターと推奨設定範囲
EMA期間 — デフォルト: 58 — 推奨範囲: 30〜100
ボラが高い銘柄は短め、安定銘柄は長め。
ATR倍率 — デフォルト: 3.8 — 推奨範囲: 2.5〜6.0
TP距離の基準。大きいほど利確ラインが遠くなる。
損切り(%) — デフォルト: -5.0 — 推奨範囲: -4〜-10
ボラが高い銘柄は広め、BTC/ETHはタイトでOK。
ADXしきい値 — デフォルト: 20.5 — 推奨範囲: 15〜28
高いほどレンジ除外が厳しく、トレード数が減り精度が上がる。
スイング検出期間 — デフォルト: 13 — 推奨範囲: 2〜20
大きいほど小さなスイングに反応しにくくなる。
BE発動しきい値(%) — デフォルト: 9.0 — 推奨範囲: 3.0〜15.0
TP1到達距離より低めに設定すると、TP1到達前に元本を守れる。
──────────────────────────────
銘柄タイプ別おすすめ設定
ミーム系(DOGE・SHIBなど)
EMA: 44〜58 / ATR倍率: 3.5〜5.0 / 損切り: -5〜-8% / ADX: 18〜22 / スイング: 10〜15 / BE: 7〜10%
主要銘柄(BTC・ETH)
EMA: 55〜80 / ATR倍率: 2.5〜4.0 / 損切り: -4〜-6% / ADX: 20〜25 / スイング: 8〜15 / BE: 5〜8%
中堅アルト(SOL・SUIなど)
EMA: 35〜55 / ATR倍率: 4.0〜5.5 / 損切り: -5〜-7% / ADX: 18〜23 / スイング: 8〜15 / BE: 6〜10%
小型アルト
EMA: 30〜50 / ATR倍率: 4.5〜6.0 / 損切り: -7〜-10% / ADX: 18〜22 / スイング: 5〜12 / BE: 8〜12%
──────────────────────────────
時間足別おすすめ設定
1〜5分足: ADXしきい値 15〜20
15分〜1時間足: ADXしきい値 18〜23
2〜4時間足: ADXしきい値 20〜25(デフォルト設定は2時間足向けに最適化)
──────────────────────────────
エントリー条件
ロング: EMAが上向き AND ダウ理論トレンドが上昇 AND ADX > しきい値
ショート: EMAが下向き AND ダウ理論トレンドが下降 AND ADX > しきい値
──────────────────────────────
イグジット条件
TP1: エントリーから +ATR×倍率×1 → 30%決済
TP2: エントリーから +ATR×倍率×2 → 30%決済
TP3: エントリーから +ATR×倍率×3 → 30%決済
損切り: 設定%を超えたら全決済
BEストップ: 含み益がBE発動しきい値%以上になると自動発動 → エントリー価格で全決済
トレンド反転: ダウ理論のスイングが逆転したら全決済
──────────────────────────────
チャートの見方
EMAライン: 3層グローエフェクト。上向きのときネオンティール、下向きのときネオンレッド
ダウ理論ゾーン: スイング高値・安値から現在価格までの2層グラデーション
スイングライン: 現在のサポート・レジスタンス水平線
TPライン: 半透明ライン。TP1が最も薄く、TP3が最も濃い
BEストップライン: BE発動中にゴールドのラインで表示
上位足スイング: 4時間足のスイングレベルを参考表示(細い半透明ライン)
グレー背景: ADXがしきい値以下の横ばいゾーン(このゾーンではエントリーしません)
ステータステーブル: 全エントリー条件と現在の状態をリアルタイム表示
このストラテジーは主に1時間〜4時間足の暗号資産トレンドフォローを想定して設計されています。デフォルト設定はDOGEの2時間足で最適化されています。実運用の前に必ずご自身の対象銘柄・時間足でバックテストを行ってください。過去の結果は将来の利益を保証するものではありません。 Strategy

Indicator

Indicator