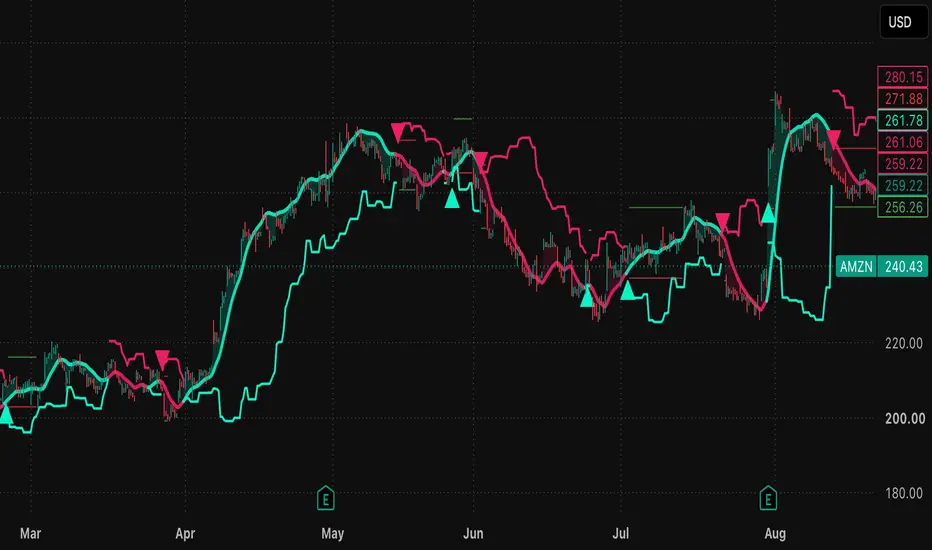
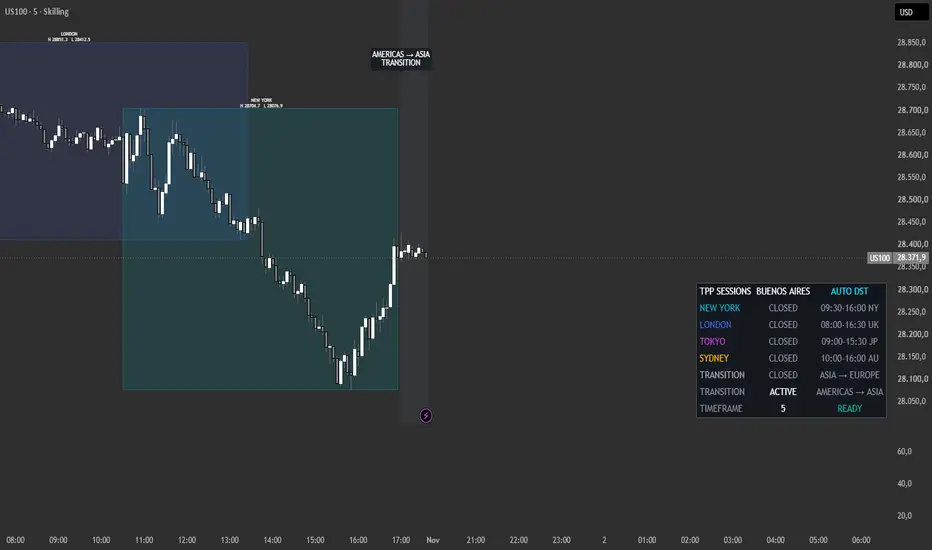
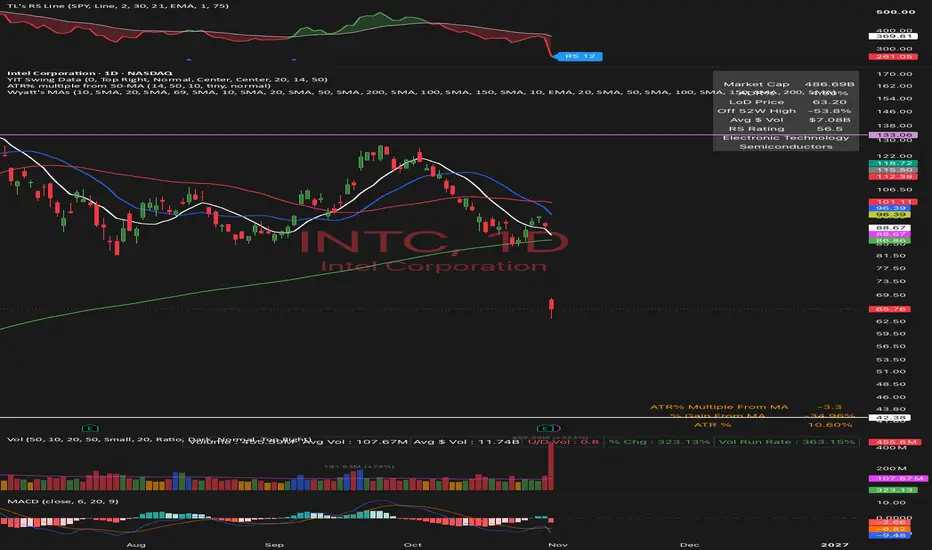
Indicator
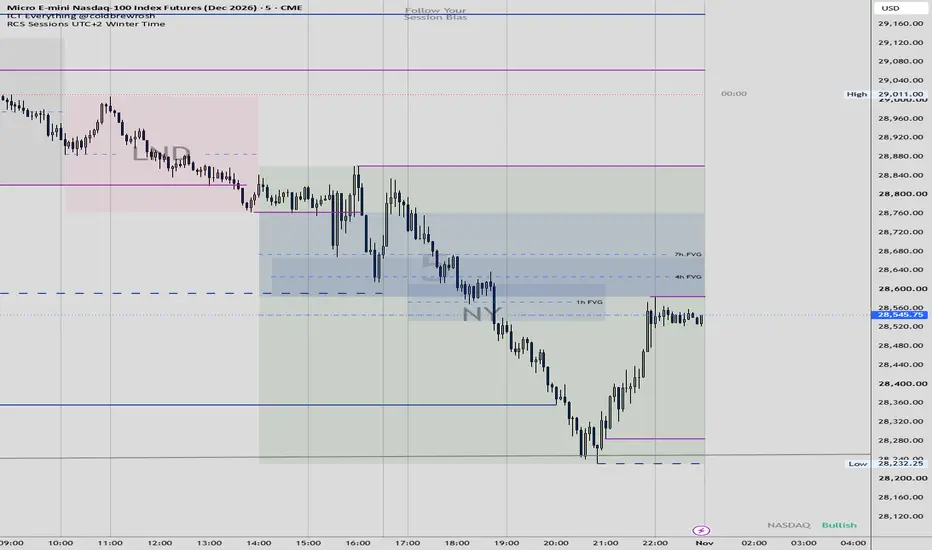
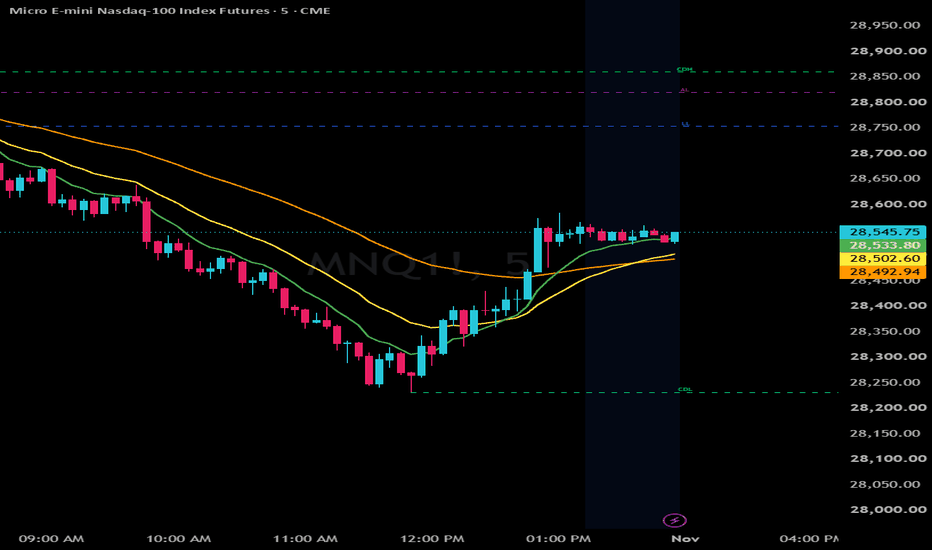
Sessions: Previous day, Asia, London, Current day : High/Low# Riding the 9 — Session Levels
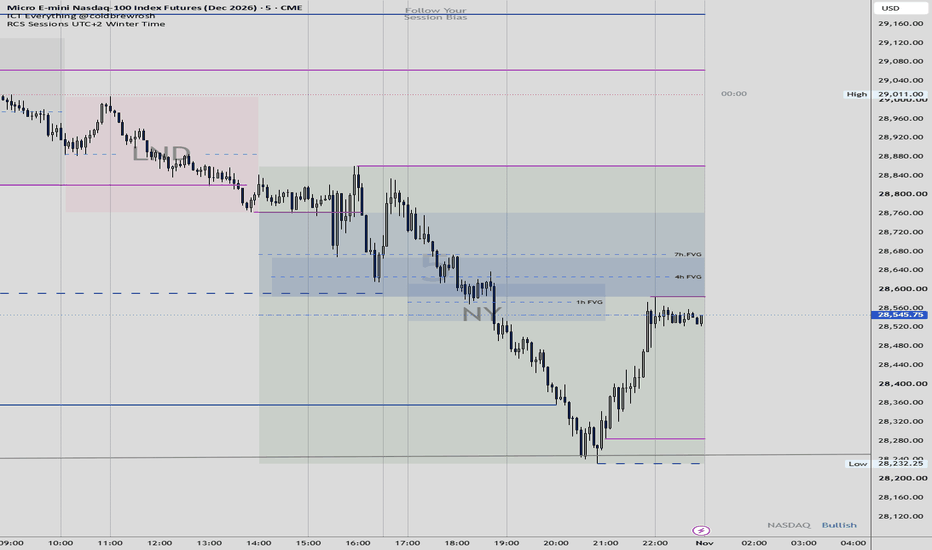
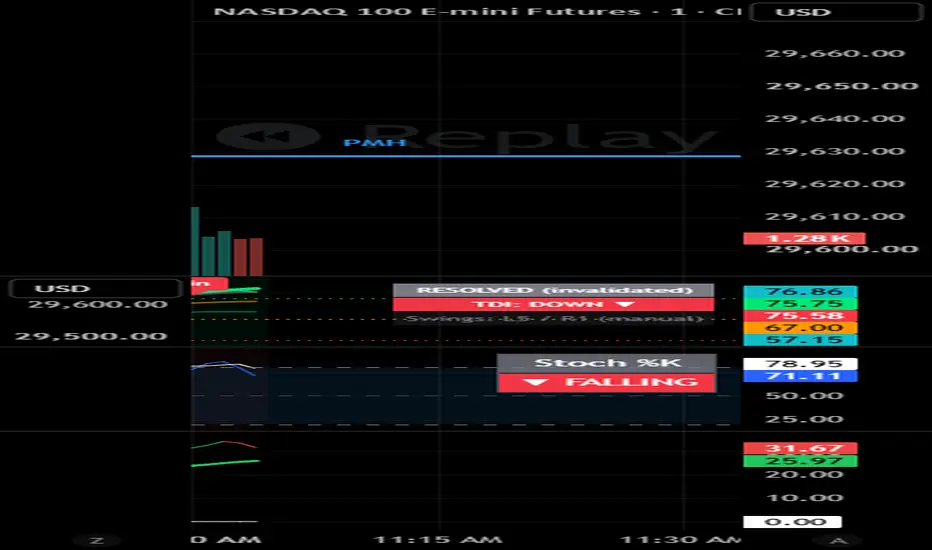
**Riding the 9 — Session Levels** is a custom TradingView indicator designed for Nasdaq futures traders who use price action, session highs and lows, and trend-following strategies to identify important areas of support, resistance, liquidity, and potential trade opportunities.
The indicator automatically tracks and displays eight key price levels across the previous futures trading day, Asian session, London session, and New York regular trading session.
## Ke Indicator
Indicator
Indicator

Strategy
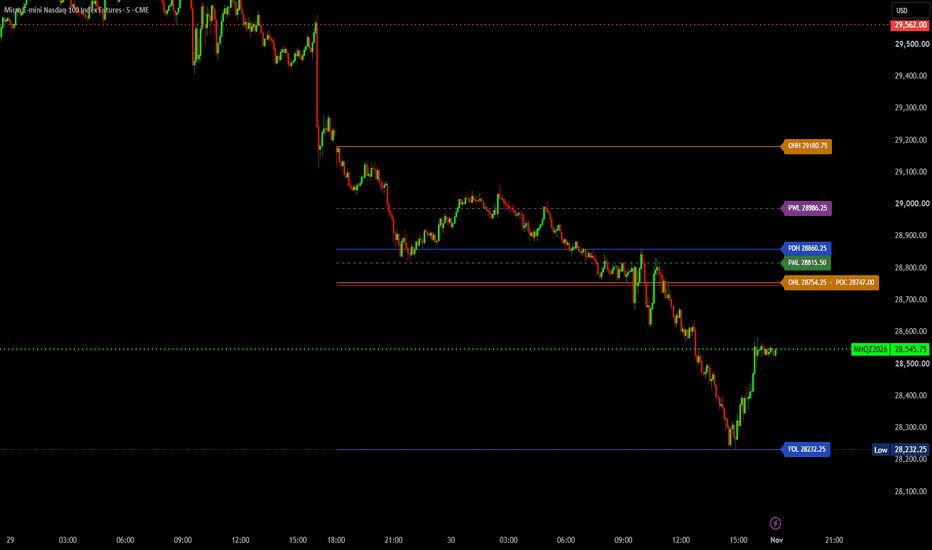
MK Levels: Day, Overnight, ORB and POC LevelsMK Levels draws the reference levels many futures day traders mark by hand each morning, so they are on the chart automatically and stay consistent from day to day.
What makes it different
Most level scripts draw one family of levels and leave every past day on the chart. MK Levels puts the levels intraday futures traders use most (prior day, overnight, opening range, prior-day POC, prior week, prior month and all-time high) in one script, draws them for the current trading day only, and merges Indicator
Strategy
Indicator
Indicator
Indicator
Indicator
Indicator
Indicator
Indicator
Indicator
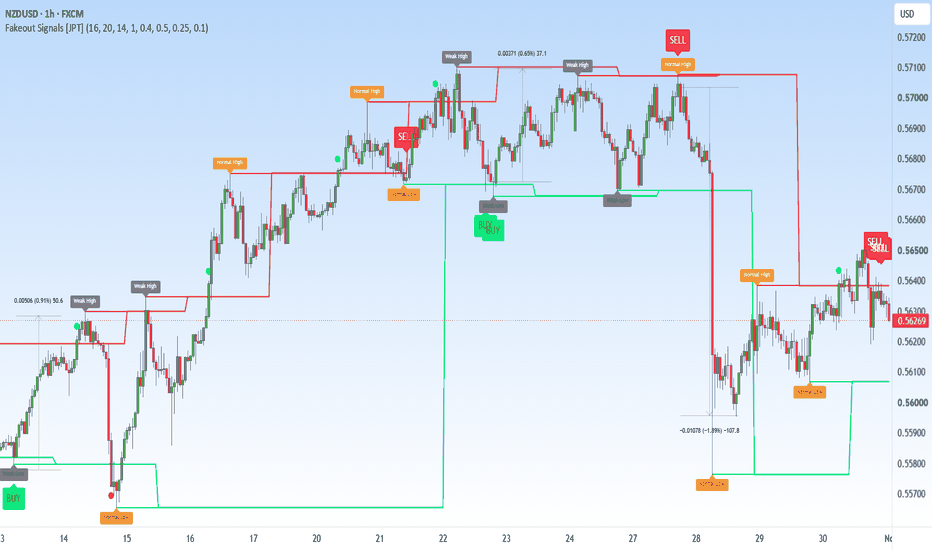
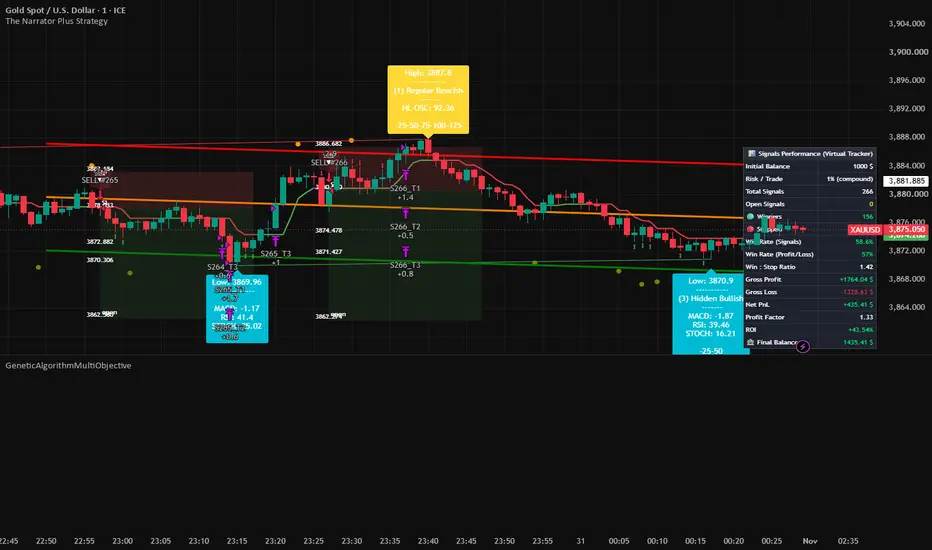
GeneticAlgorithmMultiObjectiveLibrary "GeneticAlgorithmMultiObjective"
Fast multi-objective genetic algorithm (NSGA-II) for Pine Script. All objectives are MAXIMIZED. Real-coded genes with SBX crossover and polynomial mutation, true Pareto fronts, per-front crowding distance, and elitist environmental selection.
createConfig(populationSize, geneCount, objectiveCount, minValues, maxValues, mutationRate, crossoverRate, elitismRate, tournamentSize, maxGenerations, etaCrossover, etaMutation, useSBX)
Creates a GA_Config.
Library
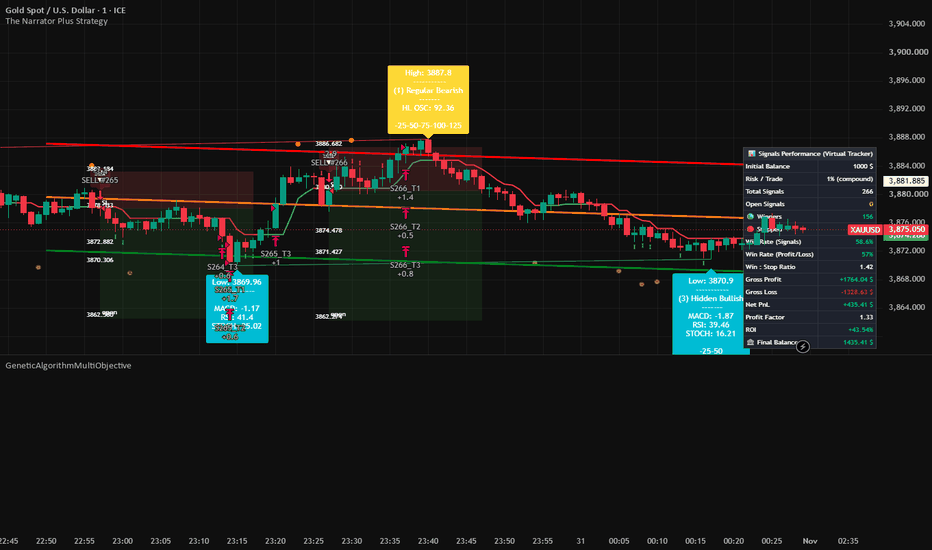
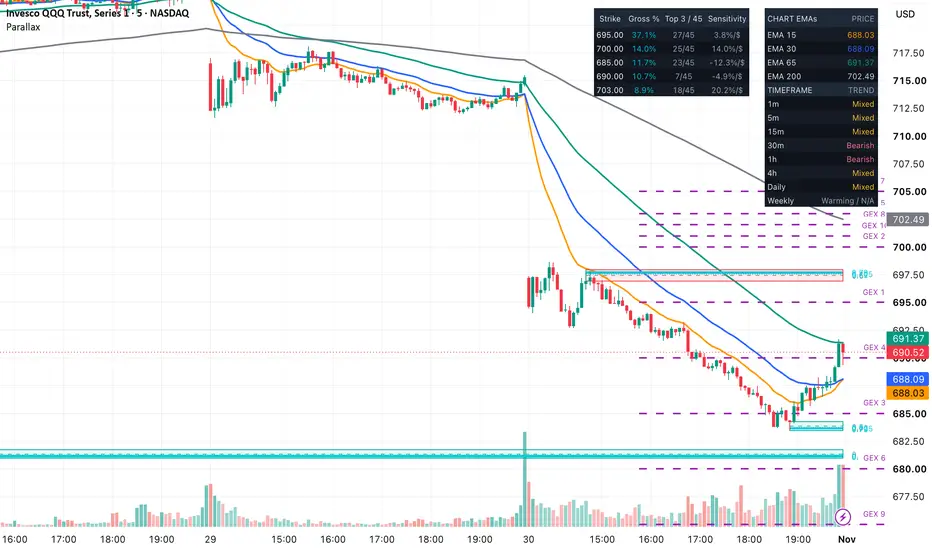
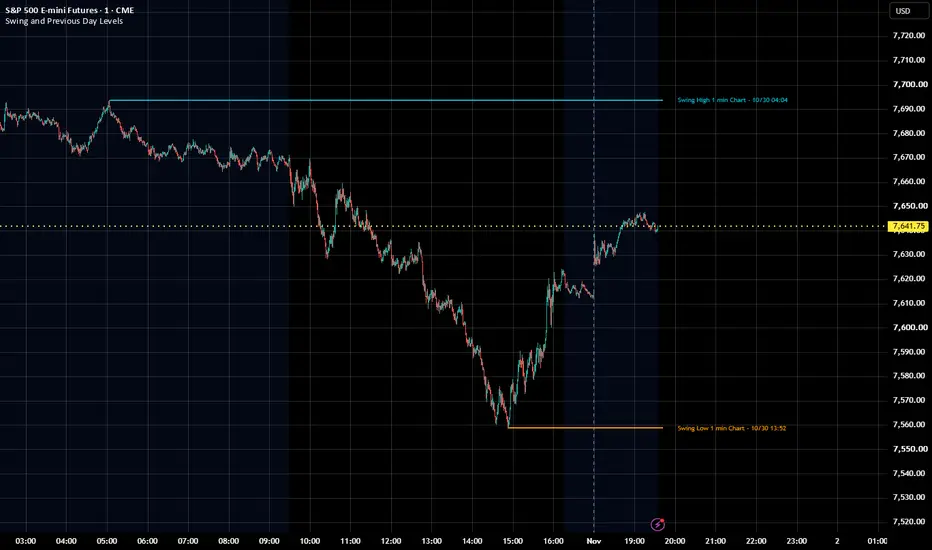
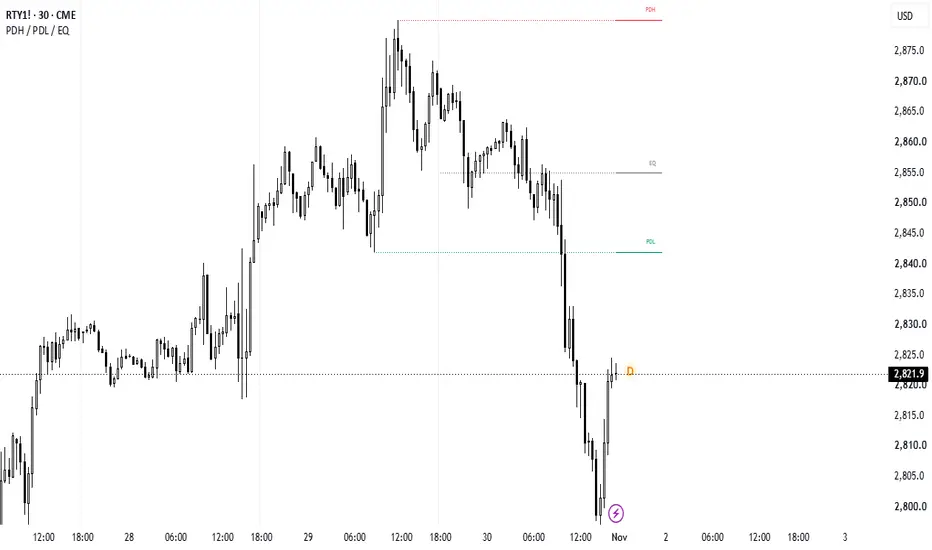
Swing and Previous Day Levels with LabelsKeep important price levels visible with descriptive labels that identify what each level represents and when it originated.
This indicator combines six manually configured levels, automatic previous-day levels, and optional EMA reference levels from the 5-minute, 15-minute, and 60-minute timeframes.
FEATURES
• Six manual levels with independent visibility, color, label text, price, and start date/time.
• Automatic previous-day high, low, and close, each independently selectable.
• Optional E Indicator
Indicator
Indicator
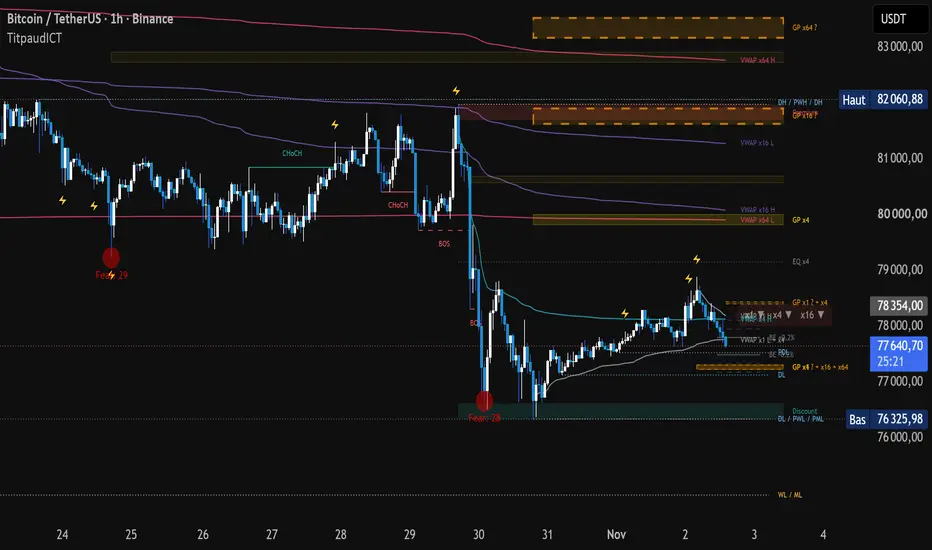
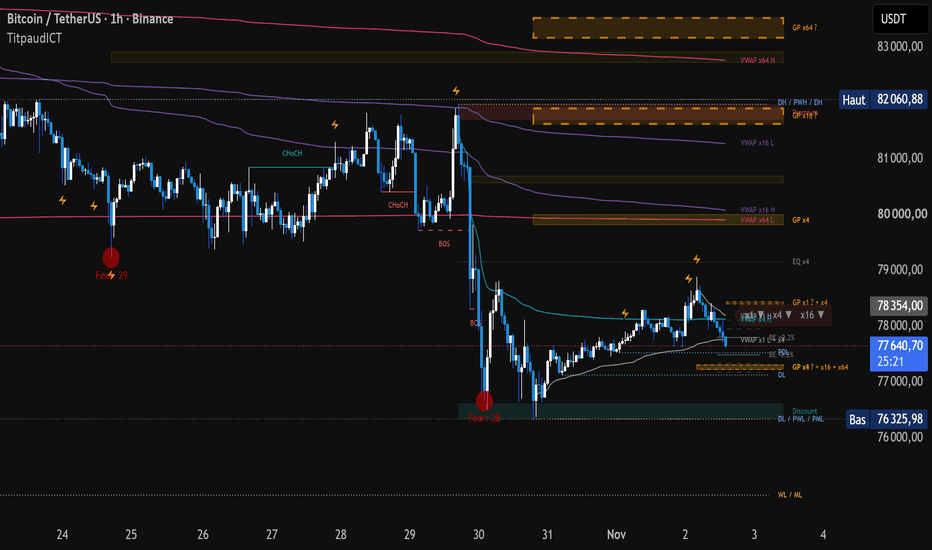
Titpaud ICTTitpaud ICT
A clean, multi-layer ICT / smart money visual aid. It does not give entries or exits: it shows where the market structure, the golden pockets, the untaken liquidity and your break-even sit, on one chart, without loading other timeframes.
ORIGINALITY
- Original code, written from scratch. The ICT concepts it draws (market structure, golden pocket, premium / discount, sweeps, equal highs / lows) are public; the premium / discount display limited to the extremes of the range follows a Indicator
Indicator
Indicator
Indicator
Indicator