Lesson 1: Why Most Traders Fail | Master Trading Psychology Most traders believe they need a better strategy to become profitable.
A better indicator.
A better entry.
A better setup.
But the truth is far simpler.
Most traders don't fail because of bad strategies. They fail because of bad decisions.
Think about your last losing trade.
Did your strategy tell you to:
Move your stop-loss?
Enter early?
Chase the market?
Hold a losing trade out of hope?
Probably not.
Those weren't strategy mistakes—they were emotional decisions.
The market doesn't re
In-depth trading ideas
Bitcoin is losing momentum after a weak retracement,Bitcoin is losing momentum after a weak retracement, with price struggling to build acceptance above recent support.
The weekly structure continues to favor sellers, and the latest candles suggest buying pressure is fading rather than expanding. Unless buyers reclaim 66k, the probability of another impulsive leg lower increases.
A break below the recent swing low would expose 58k, with the risk of an extension beneath that level if selling accelerates.
Trade Setup
Bias: Bearish
Entry: Curren
Bitcoin is in a retracement after the recent selloff, Bitcoin continues to retrace after the recent selloff, while the higher-timeframe trend remains bearish.
The daily structure suggests there is room for this recovery to extend toward the 68k region before sellers are likely to regain control. At this stage, the move appears corrective rather than the start of a new uptrend.
If Bitcoin reaches the 68k zone and fails to build acceptance above it, the broader downtrend could resume, with 58k becoming the next major downside objective.
Outlook
•
Bitcoin is stuck in a short-term range.
Price continues to respect 73,500 as the key pivot. Buyers are defending dips, but they have not shown enough strength to break above 73,900 resistance.
Key levels:
• Resistance: 73,900
• Pivot: 73,500
• Support: 73,200
The current structure suggests consolidation rather than trend expansion.
A move above 73,900 could attract fresh momentum buyers.
A break below 73,200 would shift control back to sellers.
For now, Bitcoin is building energy inside a range.
The next breakout matters more t
Bitcoin is witnessing a retracement After one of the sharpest declines seen in recent weeks.
The recovery from the 60k zone has improved short-term sentiment, but the broader structure remains under pressure as price continues to trade below major resistance levels.
The immediate focus is on the 62.8k–63.2k region. A decisive move above this zone could extend the retracement toward 64k–65k, where stronger supply is likely waiting.
On the downside, 61k remains the first important support. Losing this level would shift momentum b
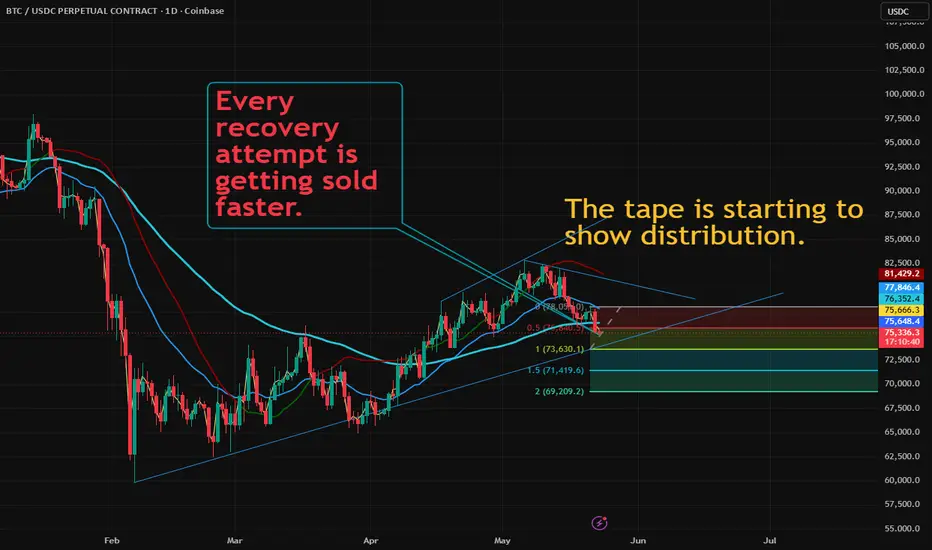
The Rally Looks ExhaustedBTC: 75.3K
The structure no longer behaves like a trend continuation chart.
It behaves like a distribution range after a relief rally.
Every recovery attempt is getting sold faster.
Momentum is weakening below the short-term averages while volatility expands on downside candles — usually an early sign that larger players are unloading into strength.
Most traders are still focused on the 75K support.
I am focused on what happens after it breaks.
Structural Outlook
The current setup suggests:
Bitcoin - Resistance was precisely predicted In my previous post I suggested as follows:-
"After Fisher on 1W turn positive, rise will be upto 1W MACD touching MACD Signal line (Not crossing over). That will make Hourly Fisher and MACD at Top. That will be the place to exit BTC from buy side."
It behave exactly as suggested. After a big rise a big fall from target upmove.
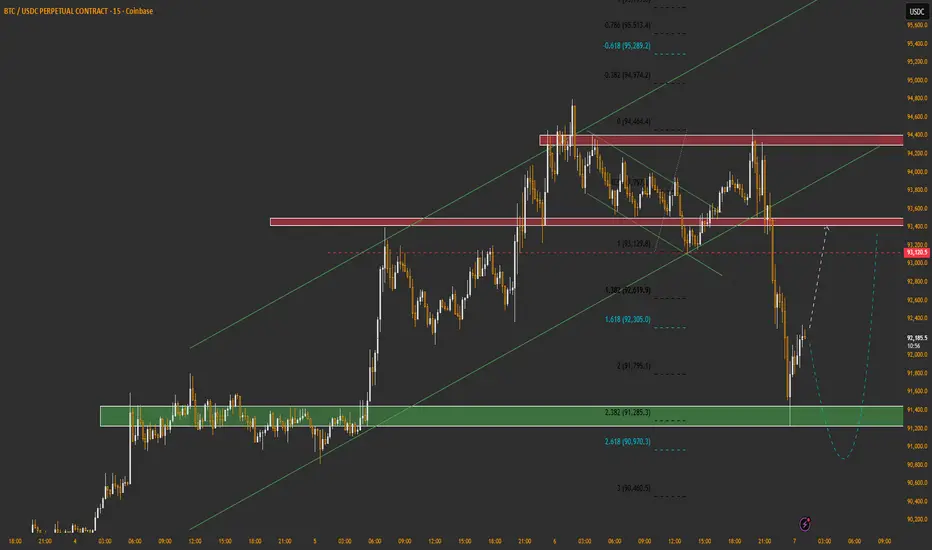
btc analysis🔍 Market Structure
Overall higher-timeframe trend is bullish (clear impulsive move up).
Price was moving inside an ascending channel (green trendlines).
Recently, price broke down from the channel → first sign of weakness.
📉 What Just Happened
Strong rejection from the upper supply zone (~94,300–94,600).
Price failed to hold the mid supply / flip zone (~93,400–93,600).
A sharp impulsive bearish candle confirms distribution → markdown.
Current move looks like liquidity sweep + stop hunt o
btc analysis1️⃣ Market Structure (Most Important)
Price broke down from a rising channel (green trend lines in the middle).
After the breakdown, BTC failed to reclaim the channel, which confirms short-term bearish structure.
Current price is below the key mid-range, showing sellers still control.
👉 Bias: Bearish to range-bound unless key resistance breaks
2️⃣ Supply & Demand Zones (Red & Green Boxes)
🔴 Major Supply (Resistance)
90,300 – 90,450
This zone rejected price multiple times.
Confluence with
BTC Levels. Bull Case. 2026Look out for ATH after over 78k range in the long run.
The Red levels are mostly as SL in Bull case scenarios and the light ones are (confidence level colored) targets. Green are entry. If I can I'll update later.
Thank you.
You are encouraged to comment your opinions as well :)
since now USDT is not compliant, lets go with BTC/USDC"All past movements" means that the last bullish or bearish trends are over, from 2020 till the past November run-up.
The price must be retraced before reaching the new targets, and the liquidity left behind must be recovered. There are too many signs to suggest selling rather than buying. Any bullish movement won't be strong enough to bring the price over the last ATH and create a new BOS, which would be significant for the long position analysis.
From a fundamental perspective, the new taxes
How to determine if price has finished pullbackWe can determine if price has finished pull back.
1) Break of 1st structure or Trend line (TL).
2) A new Extreme, another Breakout below will happen if retracement is sell.
It tells us the climax or retracement. we can look for direction entry when price signals.
BTCUSD Market Flow - 18-09-2024Direction Weekly Sell.
Direction Daily Sell.
Current flow Daily retracing upto Daily Swing High.
View Bullish until swin High.
Current View last H1 Stucture have been broken yesterday. Price started retracing back to Oring of the move. Expecting the bullish continuation.
marking EG zonesI have just published an indicator for marking trend and inside candle.
this chart will help in understanding marking EG zones.
- EG system
- Follow any 3 TF set (High (Direction), Middle (Confirm Direction), Low (Entry))
Forex
MN1/W1/D1
W1/D1/H4
D1/H4/H1
H4/H1/M15
H1/M15/M5
M15/M5/M5
Stock
MN1/W1/D1
W1/D1/H2
D1/H2/M30
M30/M5/M1
- Need to see same type EG in all Time Frame to place a trade. (EG BUY,EG BUY,EG BUY) For buy entry same is for sell Entry
- Follow only new EG, created recently,
BTC bottom in ?? Nah!In this chart I have illustrated a possible scenario which can play out (at least that's what i think).
There is still a lot of sell off left .
1. Volume decreasing on daily
2. Price is below the weekly MA for the 5th week in a row
3. Unstable macro economic conditions
For all those who are saying the pi-cyle bottom flashed. I have only 1 question:
Did bitcoin ever trade in a macro bear market ? Cause all the times pi model printed a bottom it was in a macro bull market (Just like bitcoin brok
2020.06.09 BTC Tuesday! Bloody or Eufory?BTC Tuesday!
Bloody or Eufory?
Still an exciting moment for BTC, the Bulls are not able to independently rise further, the last push is needed from a Whale it seems!
Yet BTC relies on a strong R / S level! if it continues there, the lower zones are quickly within reach!
Be safe, with Alts is the advice