Fear of Missing Out (FOMO)📌 Overview
Fear of Missing Out (FOMO) is one of the most common psychological challenges faced by traders. It occurs when traders enter a trade primarily because they fear missing a potential opportunity instead of waiting for a well-defined trading setup.
This educational infographic explains how FOMO develops, its impact on trading decisions, and practical habits that may help traders improve discipline and decision-making.
___________________________________________________________
📘 Definition
An FOMO trade is an emotional decision driven by the fear of missing a market move rather than following a predefined trading plan.
FOMO (Fear of Missing Out) – The emotional urge to enter a trade because price is already moving.
Impulsive Entry – Entering a trade without waiting for confirmation or a planned setup.
Emotional Decision – Making trading decisions based on fear, excitement, or urgency rather than analysis.
Chasing Price – Entering after a significant move simply because the market appears to be moving quickly.
Trading Discipline – Following predefined rules regardless of emotions or market excitement.
Risk Management – Using appropriate position sizing and predefined risk limits before entering a trade.
___________________________________________________________
📌 Key Points
• FOMO often occurs after a strong price movement.
• Emotional decisions may lead to poor trade entries.
• Waiting for confirmation may help improve trading discipline.
• Every market move does not require participation.
• Having a written trading plan can help reduce emotional decision-making.
• Consistency is generally built through discipline rather than impulsive actions.
___________________________________________________________
📊 Chart Explanation
• The chart illustrates a strong upward move that attracts increasing trader attention.
• Some traders may feel pressured to enter after a large price advance.
• Without a predefined plan or confirmation, emotional entries may occur near extended price levels.
• If price later reverses, impulsive entries may result in unfavorable trade outcomes.
• The example is a simplified educational illustration designed to explain trading psychology and should not be interpreted as a prediction or trading signal.
___________________________________________________________
📉 Summary
FOMO is a behavioral bias that can influence trading decisions during rapidly moving markets. Understanding how emotions affect decision-making may help traders develop greater patience, follow their trading plans, and focus on disciplined execution rather than reacting to market excitement.
___________________________________________________________
💡 Why It Matters
• Introduces one of the most common trading psychology concepts.
• Explains how emotions can influence trade entries.
• Highlights the importance of patience and discipline.
• Encourages following a structured trading plan.
• Reinforces the value of confirmation and risk management.
• Supports long-term consistency through disciplined decision-making.
___________________________________________________________
📌 Conclusion
Managing emotions is an important part of trading. Understanding FOMO and recognizing how it may influence trading decisions can help traders develop better habits, improve discipline, and approach the markets with a structured and objective mindset.
___________________________________________________________
⚠️ Disclaimer
📘 For educational purposes only.
🙅 Not SEBI registered.
❌ Not a buy/sell recommendation.
🧠 Purely a learning resource.
📊 Not Financial Advice.
British Pound vs Singaporean Dollar
No trades
No trades
In-depth trading ideas
Flag Pole and Pennant - Bullish ContinuationOverview
This chart shows a classic Bullish Pennant pattern forming after a strong impulsive upward move.
• The sharp vertical rise represents the Flag Pole, showing strong buying momentum.
• After this move, price enters a small triangular consolidation, forming the Pennant.
• This consolidation reflects a temporary pause where the market absorbs the previous rally.
⸻⸻⸻⸻⸻⸻⸻⸻⸻⸻
📊 Chart Highlights
• Strong bullish flag pole before consolidation.
• Pennant structure showing tightening price range.
• Price consolidation near the upper zone of the move.
• Breakout zone marked above pennant resistance.
• Pattern supports continuation of the prior uptrend.
⸻⸻⸻⸻⸻⸻⸻⸻⸻⸻
📉 Key Price Action
• The flag pole confirms strong bullish momentum.
• The pennant indicates short-term consolidation after the sharp rise.
• Price is compressing within converging trendlines.
• A breakout above the pennant may confirm bullish continuation.
• Sustained movement above the breakout zone can open the path for further upside.
⸻⸻⸻⸻⸻⸻⸻⸻⸻⸻
📌 Summary
This setup reflects bullish continuation behavior, where a strong rally is followed by consolidation before the next potential move higher. A clean breakout above the pennant would strengthen the bullish case.
⸻⸻⸻⸻⸻⸻⸻⸻⸻⸻
⚠️ Disclaimer
📘 For educational purposes only.
🙅 Not SEBI registered.
❌ Not a buy/sell recommendation.
🧠 Purely a learning resource.
📊 Not Financial Advice
⸻⸻⸻⸻⸻⸻⸻⸻⸻⸻
Bullish Engulfing Pattern🔎 Overview
Overview
The Bullish Engulfing Pattern is a strong price-action formation that appears after a decline or extended consolidation. It occurs when a large bullish candle completely engulfs the previous bearish candle, signaling a decisive shift in control from sellers to buyers. This pattern often reflects accumulation by stronger participants and can mark the early stage of a long-term market transition rather than a short-term reaction.
------------------------------------------------------------
📘 Concept – Bullish Engulfing
A Bullish Engulfing forms when:
• A small bearish candle is followed by a strong bullish candle
• The bullish candle’s body fully engulfs the previous bearish candle
This structure shows buyers stepping in decisively and overpowering sellers.
------------------------------------------------------------
🧭 How to Use
• Validation Line → If price holds and closes above the validation line, continuation strength is supported.
• Devalidation Line → If price closes below the devalidation line, the setup fails and weakness dominates.
------------------------------------------------------------
📊 Chart Explanation
1️⃣ Engulfing Formation
A strong bullish candle fully engulfs the prior bearish candle, signaling a momentum shift.
2️⃣ Protection Zone
The upper highlighted zone acts as a control area. Acceptance above this zone suggests follow-through potential.
3️⃣ Failure Zone
The lower zone defines risk. Price acceptance below this level invalidates the structure.
4️⃣ Price Reaction
Above the validation line → strength and continuation bias.
Below the devalidation line → loss of structure and failed setup.
------------------------------------------------------------
👀 Observation
• Engulfing patterns work best near support or after consolidation.
• Candle close is more important than intrabar movement.
• Structure confirmation improves reliability.
------------------------------------------------------------
📝 Summary
• Strong bullish candle absorbs prior selling
• Clear validation and failure zones define structure
• Confirmation depends on price acceptance, not prediction
------------------------------------------------------------
⚠️ Disclaime r
📘 For educational purposes only.
🙅 Not SEBI registered.
❌ Not a buy/sell recommendation.
🧠 Purely a learning resource.
📊 Not Financial Advice.
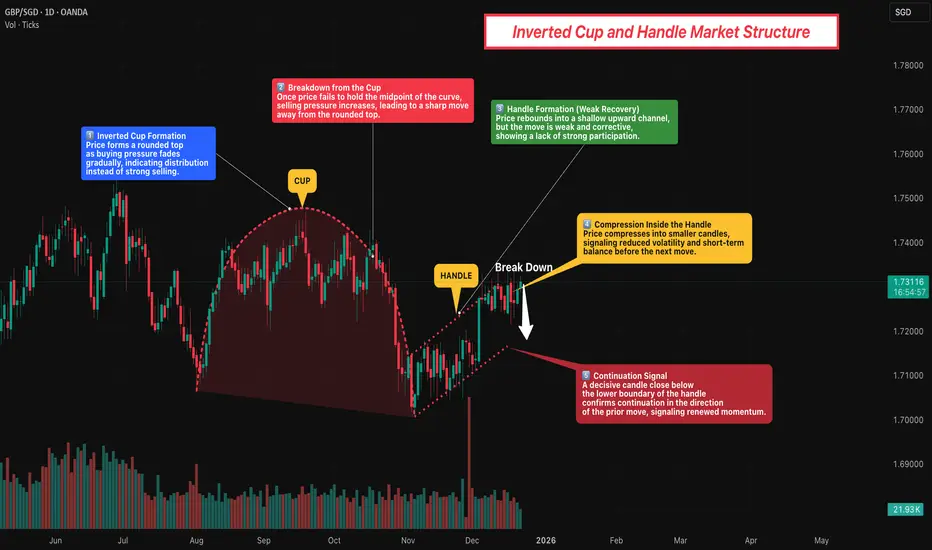
Inverted Cup and Handle Market Structure🔎 Overview
The Inverted Cup and Handle is a price structure that reflects gradual exhaustion after an upward phase, followed by a weak recovery. The pattern highlights a shift from strength to balance and then potential continuation in the direction of the prior decline. It is best viewed as a structure-based setup rather than a prediction tool.
------------------------------------------------------------
📘 Concept
The pattern begins with a rounded top (the inverted cup), where buying pressure slowly fades and distribution takes place.
After the decline from the cup , price attempts a recovery but forms a small upward-sloping channel (the handle). This recovery is corrective in nature and typically lacks strength, signaling hesitation rather than reversal.
------------------------------------------------------------
🧭 How to Use
• Validation → Successive candle closes below the lower boundary of the handle confirm the pattern.
• Devalidation → Candle closes above the upper boundary of the handle invalidate the structure and negate the setup.
------------------------------------------------------------
📊 Chart Explanation
1️⃣ Inverted Cup Formation
Price forms a rounded top as buying pressure gradually weakens, indicating distribution instead of aggressive selling.
2️⃣ Decline from the Cup
Once price fails to hold higher levels, momentum shifts and price moves away from the rounded structure.
3️⃣ Handle Formation
Price rebounds into a shallow upward channel. This move is weak and corrective, showing limited participation.
4️⃣ Compression Inside the Handle
Candles tighten within the handle, reflecting reduced volatility and short-term balance.
5️⃣ Structural Confirmation
A decisive close below the handle boundary signals the end of consolidation and confirms continuation of the prior move.
------------------------------------------------------------
👀 Observation
• Rounded tops often develop slowly and require patience.
• The handle phase represents hesitation, not strength.
• Best clarity comes from waiting for candle-close confirmation rather than early anticipation.
------------------------------------------------------------
📝 Summary
• Rounded top shows fading buying pressure
• Handle reflects weak, corrective recovery
• Compression signals indecision
• Validation occurs only after boundary acceptance
------------------------------------------------------------
⚠️ Disclaimer
📘 For educational purposes only.
🙅 Not SEBI registered.
❌ Not a buy/sell recommendation.
🧠 Purely a learning resource.
📊 Not Financial Advice.
💡Don't miss the great sell opportunity in GBPSGD
Trading suggestion:
". There is still a possibility of temporary retracement to the suggested resistance line (1.81550).
if so, traders can set orders based on Price Action and expect to reach short-term targets."
Technical analysis:
. GBPSGD is in a downtrend, and the continuation of the downtrend is expected.
. The price is below the 21-Day WEMA, which acts as a dynamic resistance.
. The RSI is at 28
Take Profits:
TP1= @ 1.8102
TP2= @ 1.8062
TP3= @ 1.8013
TP4= @ 1.7959
TP5= @ 1.7898
SL: Break Above R2
❤️ If you find this helpful and want more FREE forecasts in TradingView
. . . . . Please show your support back,
. . . . . . . . Hit the 👍 LIKE button,
. . . . . . . . . . . Drop some feedback below in the comment!
❤️ Your Support is very much 🙏 appreciated! ❤️
💎 Want us to help you become a better Forex / Crypto trader ?
Now, It's your turn !
Be sure to leave a comment; let us know how you see this opportunity and forecast.
Trade well, ❤️
ForecastCity English Support Team ❤️
💡Don't miss the great sell opportunity in GBPSGDTrading suggestion:
". There is still a possibility of temporary retracement to the suggested resistance line (1.82170).
if so, traders can set orders based on Price Action and expect to reach short-term targets."
Technical analysis:
. GBPSGD is in a downtrend, and the continuation of the downtrend is expected.
. The price is below the 21-Day WEMA, which acts as a dynamic resistance.
. The RSI is at 35.
Take Profits:
TP1= @ 1.80773
TP2= @ 1.80184
TP3= @ 1.79490
TP4= @ 1.78665
TP5= @ 1.77790
SL: Break Above R2
❤️ If you find this helpful and want more FREE forecasts in TradingView
. . . . . Please show your support back,
. . . . . . . . Hit the 👍 LIKE button,
. . . . . . . . . . . Drop some feedback below in the comment!
❤️ Your Support is very much 🙏 appreciated!❤️
💎 Want us to help you become a better Forex / Crypto trader?
Now, It's your turn!
Be sure to leave a comment; let us know how you see this opportunity and forecast.
Trade well, ❤️
ForecastCity English Support Team ❤️
💡Don't miss the great sell opportunity in GBPSGD Trading suggestion:
". There is still a possibility of temporary retracement to suggested resistance line (1.82290).
if so, traders can set orders based on Price Action and expect to reach short-term targets."
Technical analysis:
. GBPSGD is in a range bound and the beginning of downtrend is expected.
. The price is above the 21-Day WEMA which acts as a dynamic support.
. The RSI is at 61.
Take Profits:
TP1= @ 1.80800
TP2= @ 1.79550
TP3= @ 1.77320
TP4= @ 1.75630
TP5= @ 1.73310
TP6= @ 1.70910
SL: Break Above R2
❤️ If you find this helpful and want more FREE forecasts in TradingView
. . . . . Please show your support back,
. . . . . . . . Hit the 👍 LIKE button,
. . . . . . . . . . . Drop some feedback below in the comment!
❤️ Your Support is very much 🙏 appreciated! ❤️
💎 Want us to help you become a better Forex trader ?
Now, It's your turn !
Be sure to leave a comment let us know how you see this opportunity and forecast.
Trade well, ❤️
ForecastCity English Support Team ❤️
A trading opportunity to buy in GBPSGDTrading suggestion:
There is possibility of temporary retracement to suggested Trend Hunter Buy Zone (1.7190 to 1.7070). We wait during the retracement, until the price tests the zone, whether approaching, touching or entering the zone.
. Beginning of entry zone (1.7190)
. Ending of entry zone (1.7070)
Midterm forecast :
While the price is above the support 1.7070, beginning of uptrend is expected.
We make sure when the resistance at 1.7720 breaks.
If the support at 1.7070 is broken, the short-term forecast -beginning of uptrend- will be invalid.
Technical analysis:
The ascending flag taking shape suggests we will soon see another leg higher.
The RSI bounced from the support #1 at 35 and it prevented price from more losses.
A trough is formed in daily chart at 1.7070 on 06/29/2020, so more gains to resistance(s) 1.7430, 1.7605 and maximum to Major Resistance (1.7720) is expected.
Price is above WEMA21, if price drops more, this line can act as dynamic support against more losses.
Relative strength index ( RSI ) is 49.
Take Profits:
TP1= 1.7430
TP2= 1.7605
TP3= 1.7720
TP4= 1.7855
TP5= 1.8080
TP6= 1.8275
TP7= Free
Don't miss the great buy opportunity in GBPSGDTrading suggestion:
. There is a possibility of temporary retracement to suggested support line (1.6908). if so, traders can set orders based on Price Action and expect to reach short-term targets.
Technical analysis:
. GBPSGD is in a range bound and the beginning of uptrend is expected.
.The price is above the 21-Day WEMA which acts as a dynamic support.
. The RSI is at 64.
Take Profits:
TP1= @ 1.7118
TP2= @ 1.7250
TP3= @ 1.7525
SL= Break below S2