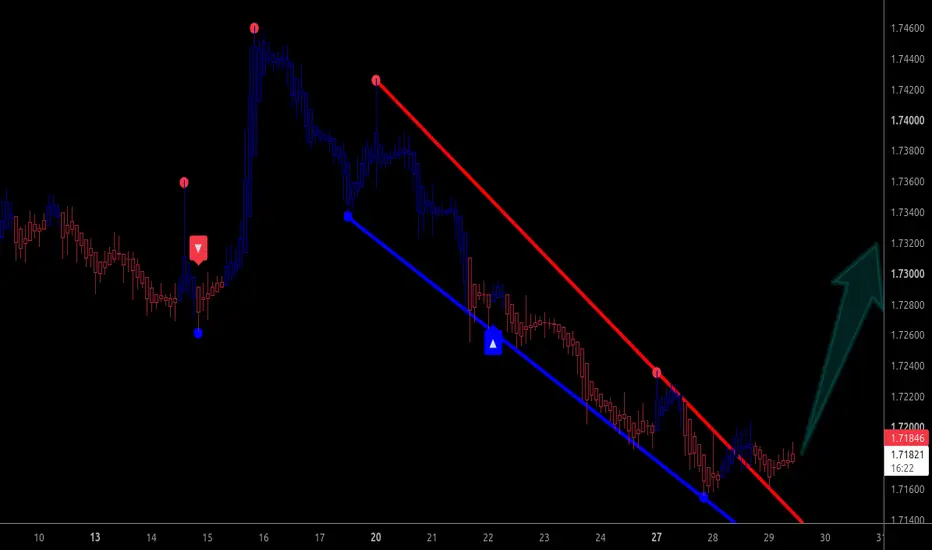
longThe price formed a downward channel, which broke to the upside. I stepped in with the buyers Longby dimitrisss2771146Updated 0
GBPSGD - Head & Shoulders Chart Pattern, 4H GBPSGD on the 4H timeframe is forming a Head & Shoulders pattern, a classic bearish reversal setup. Traders should wait for the pattern to complete and for a confirmed neckline break before considering short positions. 🎯 TP1: 1.7000 🎯 TP2: 1.6940 Patience is key—confirmation increases the probability of a successful trade. #GBPSGD #Forex #HeadAndShoulders #TechnicalAnalysis #PriceAction #ForexTrading #TradingSetup #Bearish #SwingTrading #TradingIdeasShortby SmiertSpionam1
GBPSGD Buy !GBPSGD price is sitting at strong demand zone and gave a nice rejection to the up. Now its time to buy this pair and I'm Risking 3% from the account and expecting 12% of return from this trade. 1:4.Longby realsupplydemand2
GBPSGD updatethe pair is bouncing in a channel and reaching to top of it and we are waiting for the fall .keep an eye on the pair to get into short position Shortby MtICHI0
GBPSGD IS BULLISHthe pair has bullish setup for a while .we proposed long position upon market openingLongby MtICHI110
GBPSGD is bearishaccording to price action pattern and fibo levels and trendline drawn on the chart and also reaching price to flat Kijen we believe that price has a pullback before its falling to specified target lets see what would happenShortby MtICHI3
GBPSGD LongGBPSGD is now net long on the regression break. I am not taking this trade as I feel the market doesn't have much to run upwards.Longby Rowland-Australia0
05.08.2025 #GBPSGD⬆️ Buy Entry: 1.71050 ⏹️ Stop Loss: 1.70650 *️⃣ Take Profit: 1.71450GLongby UnknownUnicorn18439089Updated 3
GBPSGD ShortGBPSGD is now net short on the regression break. I am consider all GBP pairs today.Shortby Rowland-Australia1
GBPSGD buy !!Price is sitting @ a strong resistance area and beautiful rejection from the downside . it is time to buy this pair with 1:4 risk rewards. do not risk more than 1% per trade. Longby realsupplydemandUpdated 446
GBPSGD short ideaTrading involves substantial risk and is not suitable for all investors. Past performance is not indicative of future results. Always conduct your own analysis and consider your risk tolerance before entering any trade.😉😉Shortby Yuka_Trader0
GBPSGD ShortGBPSGD is still net-short. This update was requested by meteurt7Shortby Rowland-Australia0
GBPSGD ShortGBPSGD is now net short on the regression break. I am consider the correct EA to use on the enter to maintain a limited risk.Shortby Rowland-Australia0
GBPSGD LongGBPSGD is now net long on the regression break. It has been on a run for sometime and it at all time highs. I am not taking this trade.Longby Rowland-Australia0
GBPSGD ShortGBPSGD is now net-Short on the regression break. I am considering my EA options with limited risk and profit targets.Shortby Rowland-Australia1
GBPSGD Long on the Regression BreakGBPSGD downtrend is over and price is moving back into the 12 month consolidation. I will consider this trade as price action develops throughout the day.Longby Rowland-Australia224
#003 Obvious Range GBPSGD BuyBuying. Price in obvious range for now. 1R SL to 0.66R TP. Shall see in 5 to 6 hours time. 23012025Longby ProfessionalDuckHunterUpdated 0
GBPSGD in bearish trend GBPSGD in bearish trend, RSI diversions can be seen entry with a buy stop Longby shahmir5512
GBPSGD Break Downwards inside longterm consolidationThe GBPSGD has broken again inside a long-term consolidation, running for 250 trading days. Might be a trade to follow for a small profit, but I will not take this one.Shortby Rowland-Australia0
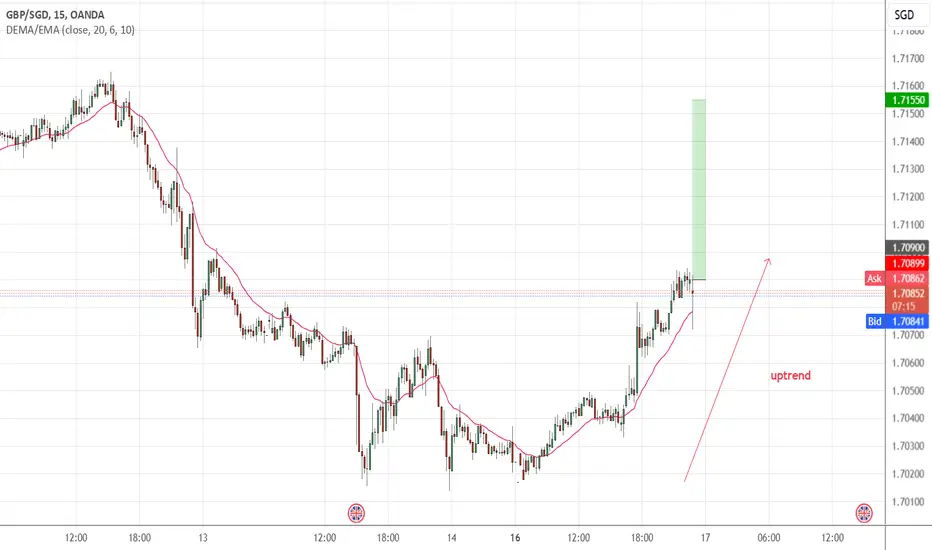
#011 NEW DCA GBPSGD 15 Minutes Up TrendAs seen on the chart, price is going upwards while trending on the 20ema (the ema doesnt matter, what matters is price is going up) We shall see what happens also on the 1H and 4H time frames, which both actually am also going up. More in the next idea log. 2252SGT 16122024Longby ProfessionalDuckHunterUpdated 0
How I trade the forbidden news & finance data. Long-GBPSGDReal I used to be a shocking chaser of news events and finance data, you know the important data that gets released at about the same time the NY session opens, give or take an hour or 2. But lets focus on the strategy that puts you in a position to win. If you like charting especilly being able to read things like where the demand levels are and where the supply candles are congregated, this will really help. If its USD pairs then I want to know which ones are weak and soft and which pairs the USD will shine and outperform over, if given the chance. So you play it best if you are super organised with your 'pairs' including the USD, I want to know basic things like support and resistance levels at the time of the announcement. One of my classic setups is being near a daily 200ema which is precisely what this trade I am in at the moment GBPSGD offers. The current daily candle is exactly intersecting (or vice versa) the 200ema, so that tells me that the trend is generally bullish. My old favourite MACD is also nicely involved here. MACD works so close to 100% reliability on the daily when a bullish cross-up is below the zero-line (as is the case here), this is another way of saying that the spring-back trade from oversold levels works better than just a run of the mill pullback with the trend. Some trading educator's won't like reading that because they feel that deep RSI thrusts well below 30 level will continue with the trend down. Perhaps this would be the case if the Instrument you are trying to revive from its oversold condition and to make it spring-back with a bullish reversal, had just lost 100% of its value and it was now worth zero, well it could crash and burn, but the initial cheaper price and change from over-supply to increased buyer demand, brings this back into vogue with buyers in the market. See on the daily macd that since crossing up on 26 November recently, the Macd-line has not even come close to touching or crossing the white signal-line. This is what you want to see and there will be no further trend reversal until such time that the Macd does in fact cross on the signal line. You want to analyse charts in advance as well to test out support and resistance levels. Working out how much RR-room you have between buy-price and SL level will be paramount to bigger profits but nobody like being stopped-out. What about in this setup when your long trade executes upon release of the economic news, are there any bullish buy-order blocks in the vicinity of your buy-price so that this will supportive of trade Long because you know that price will initially be attracted to liquidity nearby which also nearby you have your buy-order. Fibonacci-;levels can also be a big help in confirming the likelihood of price behaving like it does. As soon as you get bullish USD confirmation from the economic news do you toss in a market-buy order as fast as you can? Nah probably not because the market could be factoring in other things aside from your view of the current world of trading news. False breaks of rallys to the Longs and vice versa for the bears can be tempting to join but sometimes for example the gold price will false break and it could take the current buyers-in in the wrong direction and to place you in just enough financial pain to then take the market the intended true way. Wait, wait and wait. Even if you are unsure whether its a false break, one way to know its a real start of a trend is that a Fibonacci -retracement will soon commence to take-stock, slow the race down a tad and then in a slow and methodical way the price orders for further buys will be activated and bringing in new people to the Long position.Longby Easy_Explosive_Trading0
#005 GBPSGD DCA BuyI entered on EURUSD just now then realised that I still have USDCHF position opened, and I opened the position with USD buy on both trades. So, I closed the EURUSD short trade I opened just now when I was in 2cents profit, deducting 1cent commission, I still made 1cent profit. Anyway, as for GBPSGD, the 60sma isn't as clear, but if you were to look from top down view starting on the Daily, then 4H, 1H to 15 Minutes, you would realise that buying in the short term is alright because the price has just bounced off the lower boundaries of the range on the Daily Time Frame. We shall see. Currently, I placed 1 market buy and 3 buy limit as marked out on the charts. If I were to add on more positions, I will be updating. 1629SGT 20112024Longby ProfessionalDuckHunterUpdated 0

 Long
Long