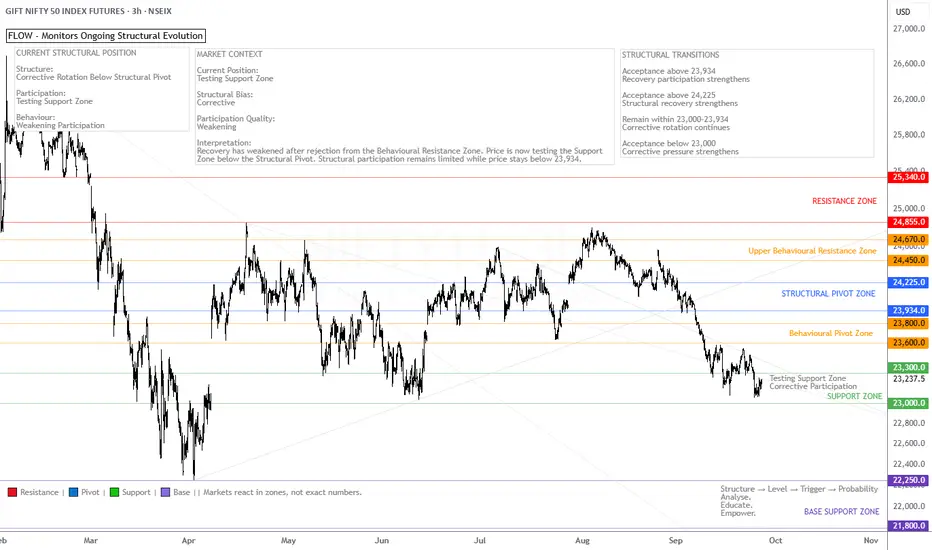
GIFT NIFTY — STRUCTURAL POSITION AND FLOWGIFT NIFTY is currently trading around 23,237, within the 23,000–23,300 Support Zone and below the 23,934–24,225 Structural Pivot Zone.
The recent recovery has weakened after rejection from the upper behavioural resistance area. Price has subsequently rotated lower and is now testing the established Support Zone.
CURRENT STRUCTURAL POSITION
Structure: Corrective rotation below Structural Pivot
Participation: Testing Support Zone
Behaviour: Weakening participation
The immediate structure rem
In-depth trading ideas
Gift Nifty Wave Structure Day time Frame📊 GIFT Nifty Elliott Wave Structural Details
Minor Degree Wave A: Formed and completed in Red Colour.Minor Degree
Wave B Completion Structure:
Wave B develops internally as a Minuette Degree abc structure in Black Colour.
The internal wave c of this black structure forms an Ending Diagonal (Wedge).
The termination of this internal wave c officially completes the entire Minor Degree Wave B.
The Motive Impulse Breakout: A powerful impulse wave breaks out of the Ending Diagonal Wedge, which is
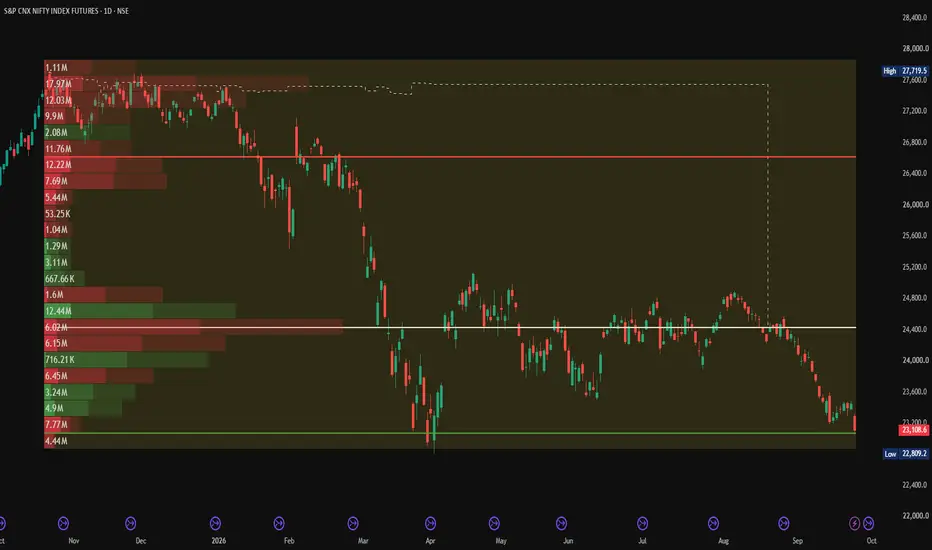
Nifty Tests Major Yearly Support — Next 3 Expiry Sessions KeyNifty futures have fallen sharply into the last 3 sessions of September expiry, now trading near 23,108, down 341 points (-1.46%) today. Zooming out to the full one-year chart tells us something important: this isn't a fall into empty space — price is now testing a major long-term support zone that has held multiple times over the past year.
The Big Picture (1-Year View):
Looking at the volume profile from November 2025 to now, there's a clear support shelf sitting around 22,809–23,230 — this
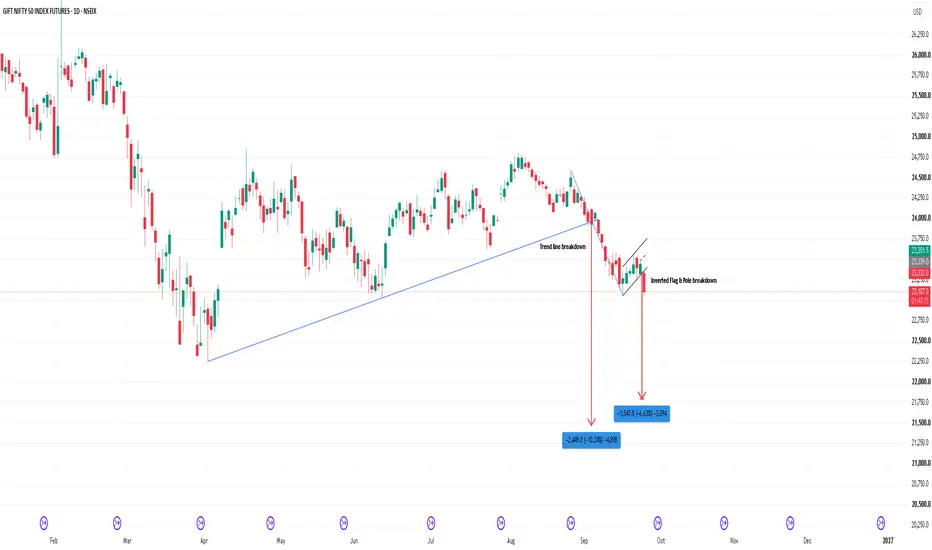
NIFTY FUTURES ( Gift Nifty ) — Day ChartBearish structure is developing: Price has broken the rising trendline and also broken down from the Inverted Flag & Pole pattern.
🔴 Bias: Bearish below 23,350–23,400
🔄 Ideal setup: Wait for a breakdown + retest + rejection around 23,300–23,400
🎯 Targets: 22,750 → 21,750 → 21,500
🛑 Invalidation: Sustained move back above 23,600–23,700
⚠️ Avoid chasing after a sharp fall; let the retest confirm the breakdown.
Key view: Trendline breakdown + Inverted Flag & Pole breakdown = bearish
Trading Road Mapoptions trading and institutional trading are important parts of modern financial markets. Options trading offers flexibility and opportunities for profit, while institutional trading provides liquidity and stability to the market. However, beginners should learn market concepts carefully before entering options trading because losses can occur quickly without proper knowledge and risk management. Education, practice, and disciplined investing are essential for long-term success in trading.
Oversold MarketsWhat is overbought?
When the market goes up too much, too fast — like it got overexcited. RSI crosses above 70. This means most people who wanted to buy have already bought. Not many buyers left. So the market will likely slow down or fall a bit.
What you do: don't buy now. If you're already in profit, book some of it. Keep your stop loss tight.
What is oversold?
When the market falls too much, too fast — like everyone panicked and sold everything. RSI drops below 30. Most of the panic sellin
Trading AnalysisOption Chain Analysis: Decoding Open Interest (OI) to find where the "Big Players" are positioned.
FII/DII Data: Understanding institutional activity and its impact on market direction.
Intraday Strategies: Scalping and swing setups using Price Action and key EMAs.
Global Market Cues: How GIFT Nifty and US Markets might influence our opening.
Nifty Intraday levels NIFTY Intraday Levels to Watch – 18 Sep 2026
Key intraday Demand & Supply zones marked on the chart for today’s session.
🔴 Supply Zones
- 23,415 – 23,435
- 23,495 – 23,525
🟢 Demand Zones
- 23,320 – 23,340
- 23,225 – 23,260
These levels are marked as areas of interest for intraday price action. Watch how price reacts when it enters or approaches each zone rather than treating the levels as guaranteed reversals.
📌 No directional bias — only key levels to watch.
#NIFTY #NIFTY50 #IntradayTrading #Tr
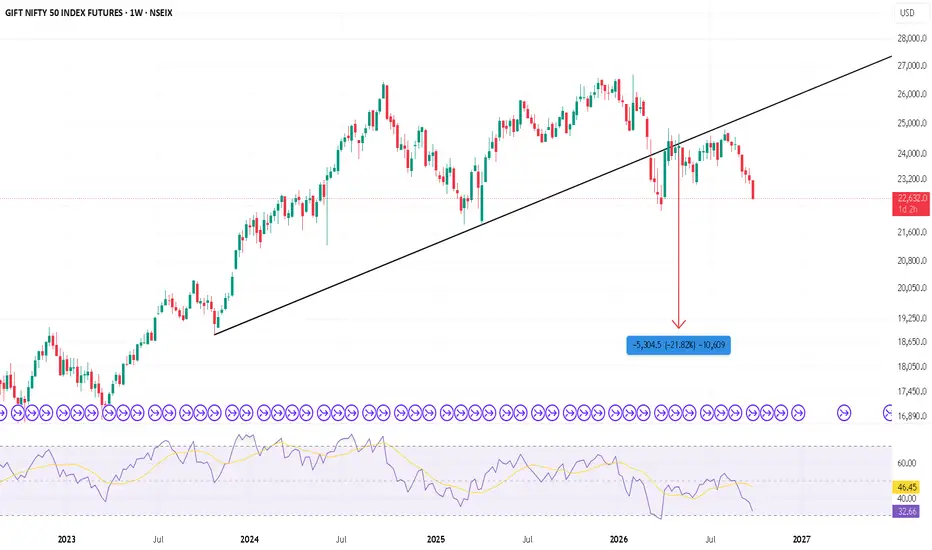
GIFT Nifty — Weekly Analysis - Alert The chart has formed a clear Double Top, followed by a neckline breakdown and retest rejection. This confirms a bearish technical structure.
🔻 Bearish Setup
Double Top neckline: around ₹24,000
Breakdown + retest: completed
Current price: ₹22,633
RSI: 32.67, showing strong bearish momentum.
🎯 Double Top Target:
The measured move shown on the chart projects approximately ₹18,650–₹18,700.
Key Levels:
Resistance: 24,000–24,300
Immediate support: 22,500–22,600
Next supports: 21,600 → 20,500
GIFT NIFTY | FLOW – Monitors Ongoing Structural Evolution|05-09GIFT NIFTY has moved out of the earlier recovery phase and is now undergoing Corrective Rotation Within the Structural Pivot.
After rejection from the Behavioural Resistance Zone, participation has weakened as the market returns to the lower part of the Structural Pivot Zone.
The immediate focus is now on whether the Structural Pivot can hold or whether corrective pressure develops further.
CURRENT STRUCTURAL POSITION
• Corrective Rotation Within Structural Pivot
• Testing Structural Pivot
HOW-TO: Read AlphaTrendPro BUY/SELL Signals & Trend ContinuationAlphaTrendPro is a multi-factor trend and continuation trading system designed to help traders evaluate market direction, momentum, confirmed trading setups, continuation opportunities and risk management within a structured chart framework.
Rather than relying on a single BUY or SELL signal, AlphaTrendPro is intended to be read as a combination of information.
The basic workflow is:
**TREND → MOMENTUM → SIGNAL → ENTRY & RISK → TRADE MANAGEMENT**
This HOW-TO explains how to read these elemen
Where are the Volumes? Nifty 50Since our last post of anticipating ascending triangle breakout in NSE:NIFTY , I talked about possibility of spurt of volume with the action. Hell, the breakout happened with below average volume, and guess what, the nullification of the pattern happened with even lower volume spread.
What happened to the volume? The only explanation is, it's a random market with no clear direction. Seems like markets are waiting for some trigger, which I believe will come from the US.
NIFTY ANALYSIS | 17 AUGUST 2026 | MONDAY# 📊 NIFTY ANALYSIS | 17 AUGUST 2026 | MONDAY
**Previous Close:** 24,395.85
**Previous High:** 24,405.30
**Previous Low:** 24,296.80
**Futures POC:** 24,403.00
## 🎯 Institutional Bias: **NEUTRAL-BEARISH**
NIFTY closed almost exactly around the **24,403 POC**, keeping Monday in a decision zone. The immediate structure is range-bound, with **24,405.30** acting as the bullish trigger and **24,296.80** as the bearish trigger.
The key battle is **24,300-24,500**.
---
## 1. MARKET STRUCTURE
* **
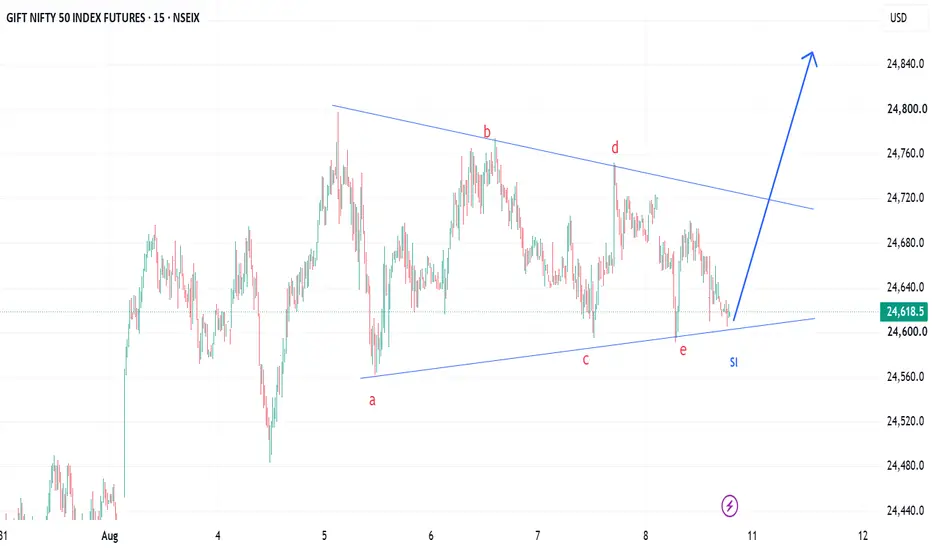
Gift Nifty 15 Min Time Frame Triangle Pattern Nifty Structure wise in strong Impulsive wave after motive wave it consolidation in phase
Gift If we read and try to understand the consolidation phase, then patterns are formed under it. If we read the pattern, then a triangle pattern is visible, which means that the next motive wave will be formed in the up direction.
Risk should be taken where the chances of being correct are higher; the rest depends on the market's response.
This is my personal research and not a recommendation to buy or
PIVOT BOSS Virgin POC
Date: 12-08-2026
Nifty has successfully closed below Virgin POC 1 and Virgin POC 2. It will consolidate at this level before it breaks Virgin POC 3 and Head towards Virgin POC 4.
Always remember when the price Gaps Up or closes above the POC of the previous day. It will revisit those POC levels called (VirgIn POC)
Regards
Aditya
Nifty Intrinsic Value Date 08.08.08 (2026)
The Behind the Scenes Math (2020 vs. 2026)
Where the probelm lies
Starting Value (2020): $281 Billion
Plus New Capital Injected (2020–2024): +$35 Billion
Pure Market Appreciation (The Bull Run): +$547 Billion
Minus Massive Cash Outflow (2024–2026): -$45 Billion
Ending Net Value (2026): $818 Billion
The MSCI Emerging Markets the Trailing P/E Ratio (Aug 2026) is 17.32X
MSCI India Index is at 24.37x
Just to compare with other asian emerging markets
China 13.96x
Indo
Nifty 50 Index Futures Trading Plan [06.08.2026: Thursday]Probable Scenario Analysis and Trade Plan for the Nifty 50 Index NSE:NIFTY for the 06th of August, 2026. The day is Thursday.
🟢 Bullish Scenario
Presently, there is no bullish scenario. The zone (24700 - 24650) is a strong resistance zone (SRZ). If the price sustains above 24700 and forms a strong 30-minute green bullish candle, a bullish scenario would emerge. Wait for price sustainability above 24700. The probable bullish targets above 24700 would be - 24750, 24800, and 24850.
🔴 Bea
Retail Traders Deserve BetterLet’s talk about that insane 200-point Nifty spike at 3:30 PM today...
If you were staring at your screen at the closing bell today wondering what the hell just happened, you're definitely not alone.
I still can't get over what happened. What hurts the most is that this wasn't triggered by some major news or an unexpected event. It all came down to the new Closing Auction. It was introduced to reduce manipulation, but today it honestly felt like traders were the ones who got trapped.
Once nor
Nifty Breakout massive UpsideOn Daily Price Chart Nifty is on Resistance. But what is the possibility of upside breakout?
Now, the good (positive) thing is that
1) on 1Day MACD it has given a breakout
2) MACD has completed a consolitation and it has bounced from 0 level
3) Weekly Fisher and MACD both are positive.
But any one can say that market will go up. But if you ask how far, there may not be a reasonable target.
When every one give a price target upside, my target is different from price. I calculate it on Fisher.