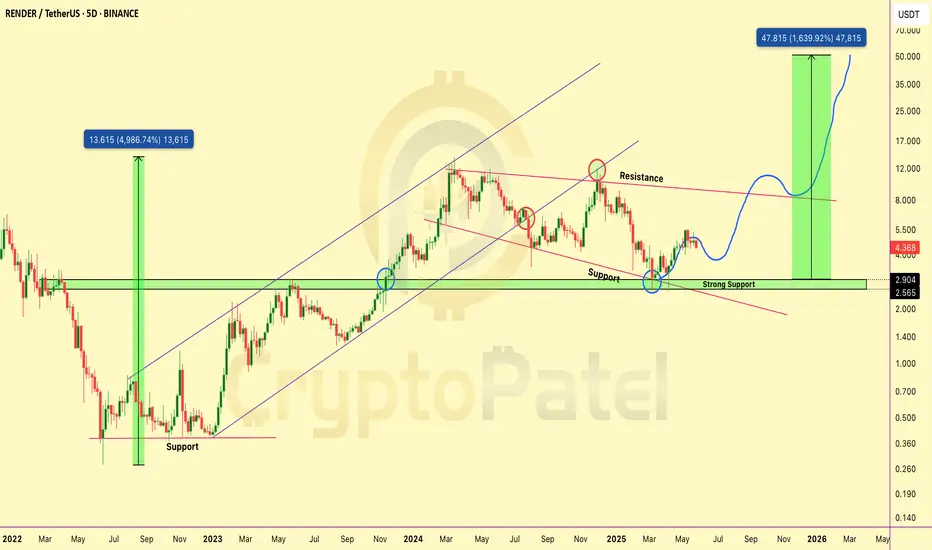
Why $RENDER Could 25x To $50 This Cycle Down 92% While Fundamentals Hit ALL-TIME HIGHS: Why CRYPTOCAP:RENDER Could 25x To $50 This Cycle 🚀
#RENDER Is Currently Positioned Within A HTF Bullish OB After Experiencing ~92% Macro Drawdown From Its ATH, Placing Price At A Key Accumulation vs Breakdown Zone.
Technical Structure
✅ Prior Cycle
Down 85% From ATH - Why $RENDER Could 25x To $50 This CycleDown 85% While Fundamentals Hit ALL-TIME HIGHS: Why CRYPTOCAP:RENDER Could 25x To $50 This Cycle 🚀
Trading At ~$2. The Token Is Priced Like It's Dying. The Fundamentals Say The Opposite.
10 Reasons CRYPTOCAP:RENDER Is The AI Infrastructure Play Of This Cycle:
1️⃣ 71 Million+ Frames Rendered.
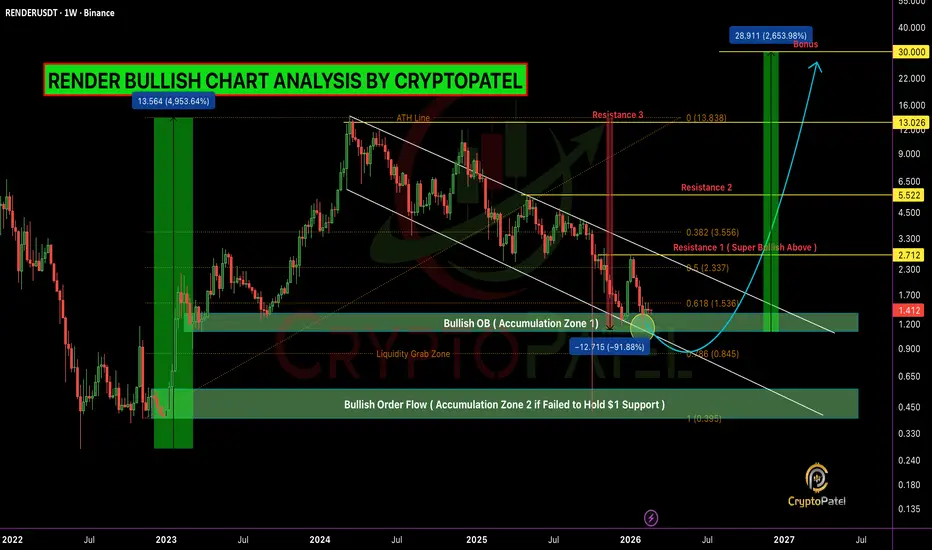
$RENDER Down 90% From ATH: HTF Bullish OB Test With 2,650% ExpanCRYPTOCAP:RENDER Down 90% From ATH: HTF Bullish OB Test With 2,650% Expansion Potential If $1 Holds
#RENDER Is Trading Inside A HTF Bullish OB After A ~90% Corrective Move From Its ATH, Positioning Price At A Critical Accumulation Vs Invalidation Zone.
Technical Structure
✅ Previous Cycle ATH At
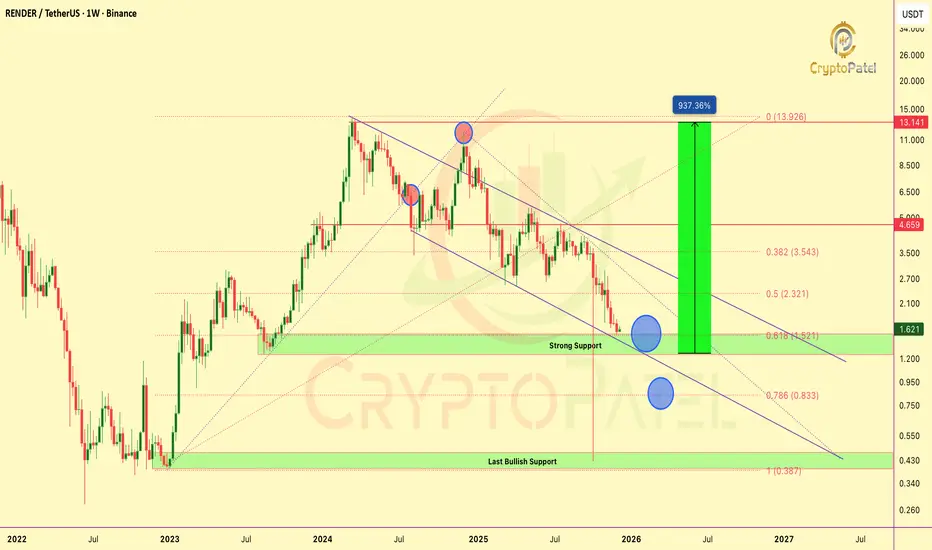
RENDER will hit $15?CRYPTOCAP:RENDER Technical Update
Price is in a bearish corrective phase and currently reacting at the 0.618 Fib zone ($1.55–$1.25), A key area for potential bullish reversal. Holding this zone increases the probability of a strong upside continuation toward $4.6 / $8 / $13 / $20.
If this support
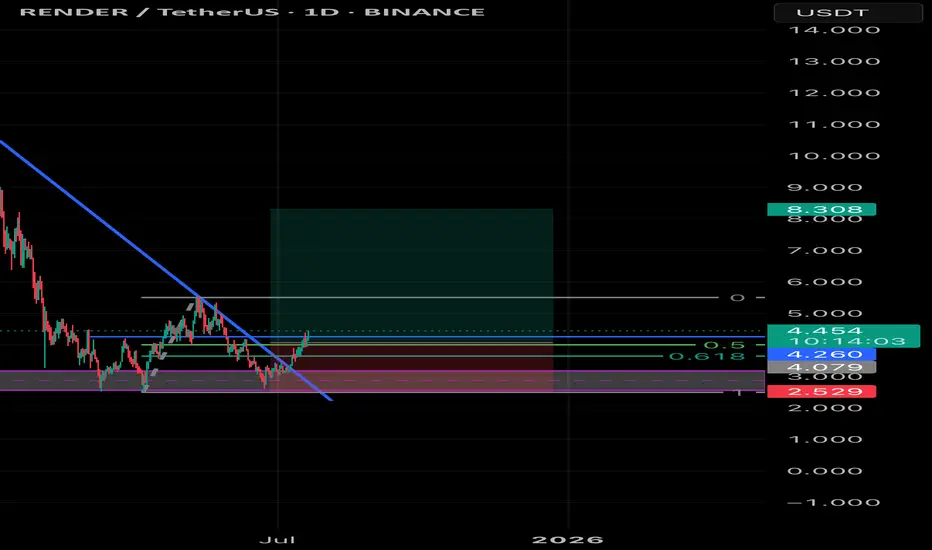
RNDR/USDT Long SetupRender (RNDR) is showing a promising long setup after rebounding strongly from a well-tested support zone. The price broke out of a tight consolidation range with a decisive bullish candle, signaling renewed buying interest. This breakout was accompanied by a surge in volume, confirming participatio
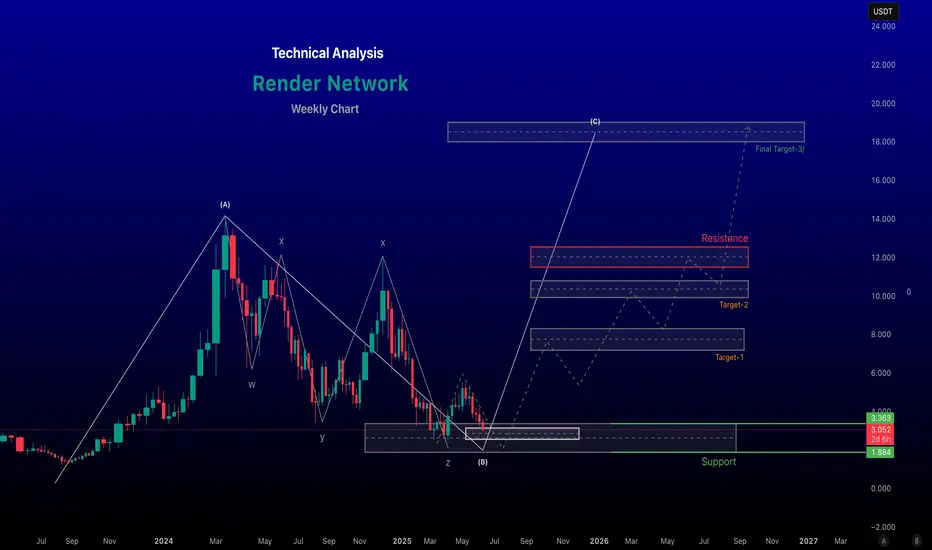
Render Network - Set to Surge from Next Month OnwardCurrent Price and Market Context
Current Price: ~$3.04 USDT with a 24-hour trading volume of ~$55.4M).
Recent Performance:
Down -21.97% over the past week.
Down -30.62% over the past month.
Down -58.58% over the past year.
All-Time High: $13.6330 USDT on March 17, 2024.
All-Time Low: $0.274
$RENDER Could Be the Next Nvidia of CryptoCRYPTOCAP:RENDER Could Be the Next Nvidia of Crypto
CRYPTOCAP:RENDER is one of the strongest AI projects in crypto right now — and it’s only getting started. The dip you see now?
That’s an accumulation opportunity for long-term believers!
▶️ Best Buy Zone: $4 – $3.40
▶️ Targets: $8.6 / $15 / $
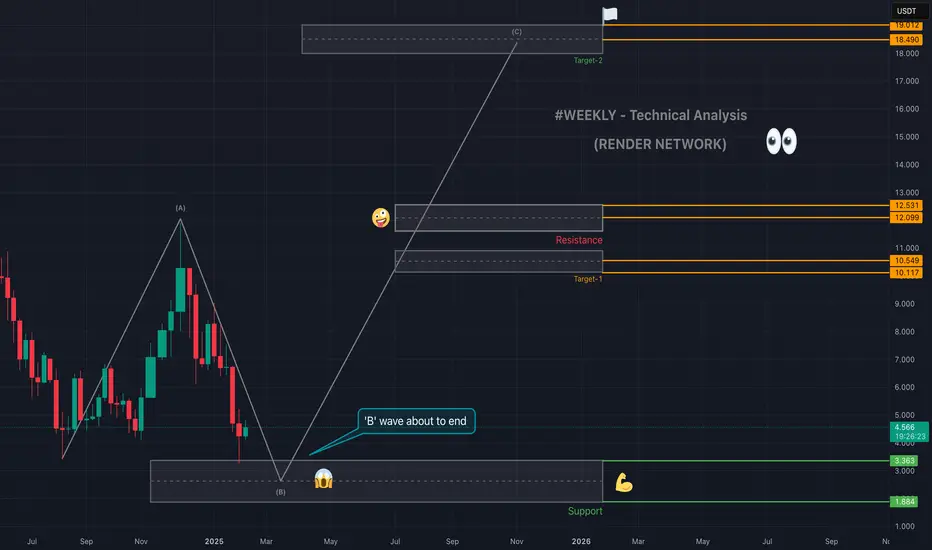
RENDER TECHNICAL ANALYSIS - WEEKLY🗣️The #render Network has shown significant price movement, reflecting both the volatile nature of #cryptocurrencies and specific developments within its ecosystem.
👉As of the latest updates, the price of RENDER is around $4.50 USD, with a 24-hour trading volume hovering around $64 million.
❣️He
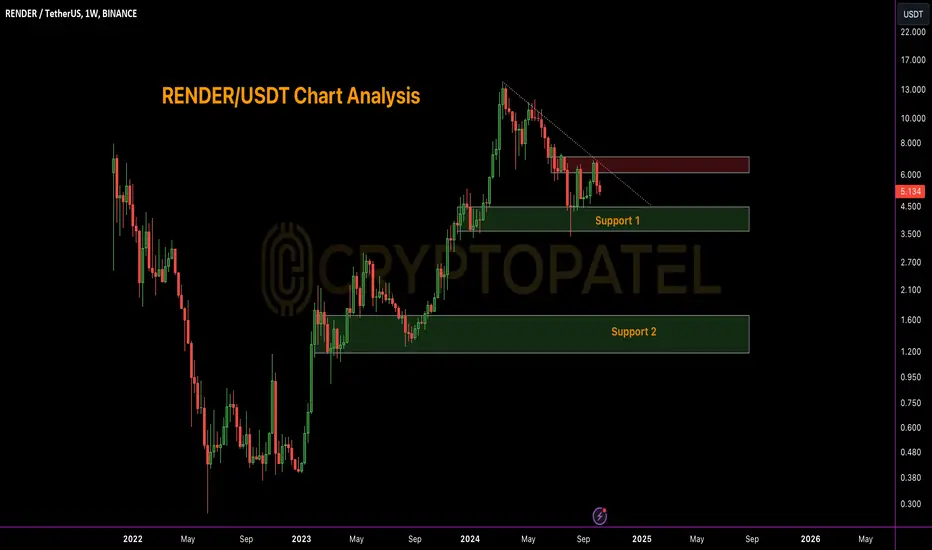
RENDER/USDT Bullish Chart Analysis#RENDER/USDT Chart Analysis
CRYPTOCAP:RENDER looks promising, with the next uptrend depending on the $4 support level. If $4 holds, we could see a target of $20!
However, if $4 breaks, expect a potential drop toward $1 support.
Key Levels:
Strong Supports: $4 / $1.50
Resistance: $6.50
See all ideas
Summarizing what the indicators are suggesting.
Oscillators
Neutral
SellBuy
Strong sellStrong buy
Strong sellSellNeutralBuyStrong buy
Oscillators
Neutral
SellBuy
Strong sellStrong buy
Strong sellSellNeutralBuyStrong buy
Summary
Neutral
SellBuy
Strong sellStrong buy
Strong sellSellNeutralBuyStrong buy
Summary
Neutral
SellBuy
Strong sellStrong buy
Strong sellSellNeutralBuyStrong buy
Summary
Neutral
SellBuy
Strong sellStrong buy
Strong sellSellNeutralBuyStrong buy
Moving Averages
Neutral
SellBuy
Strong sellStrong buy
Strong sellSellNeutralBuyStrong buy
Moving Averages
Neutral
SellBuy
Strong sellStrong buy
Strong sellSellNeutralBuyStrong buy
Displays a symbol's price movements over previous years to identify recurring trends.