WHY IS THIS RENDER LONG STILL VALID?🚨 WHY IS THIS RENDER LONG STILL VALID? 👀🔥
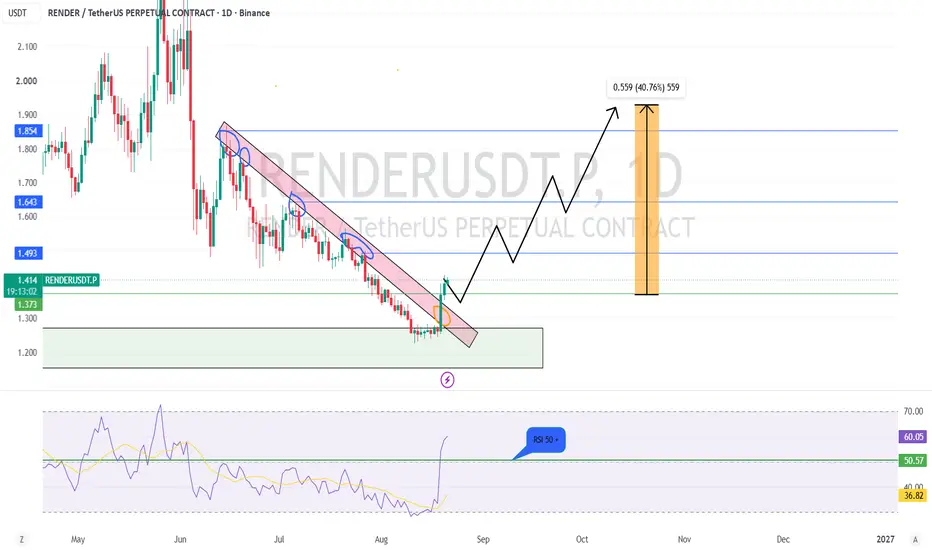
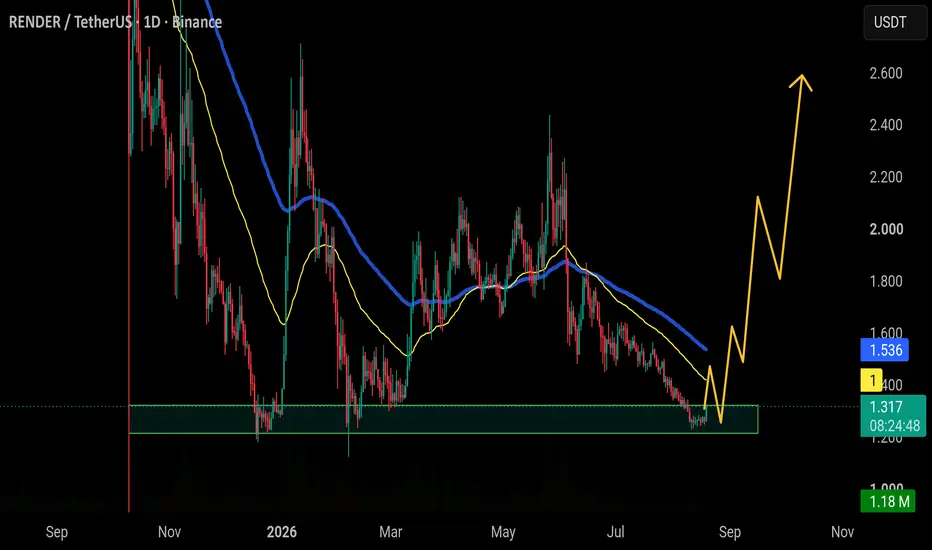
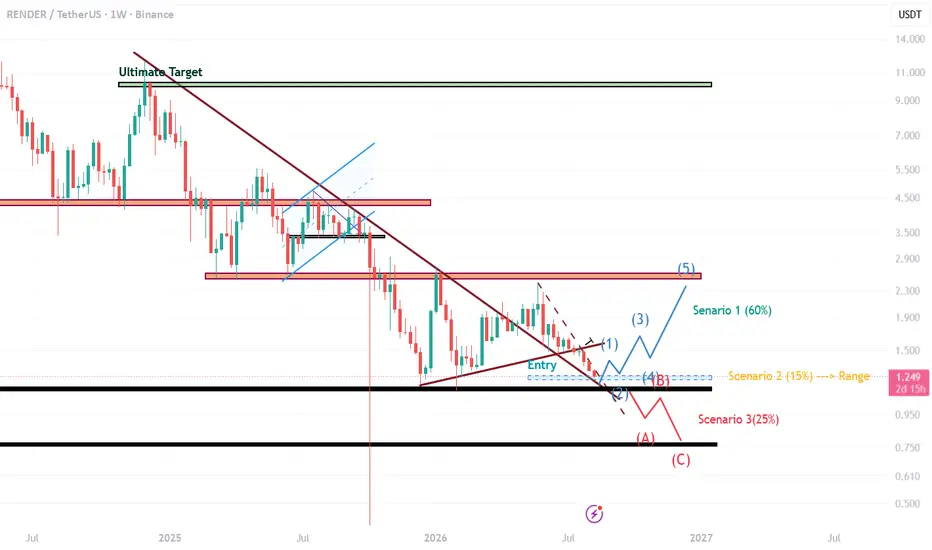
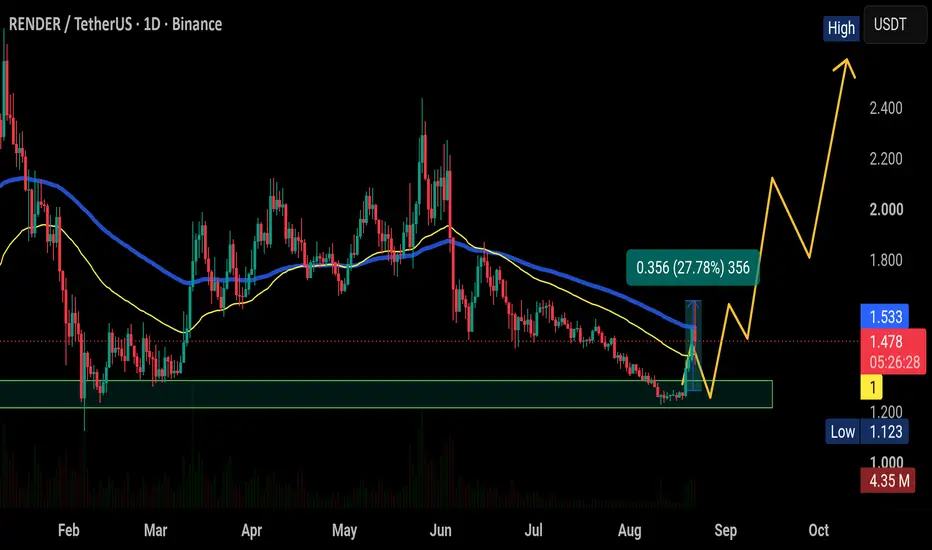
CRYPTOCAP:RENDER has started showing a clear reaction from the lower demand zone, and the market structure is now trying to shift after a long bearish move. The falling trendline has been tested, while RSI has pushed back above 50 — showing that buying momentum is returning. This is an important change in the short-term picture. 📈
The key point is that RSI strength needs to be supported by volume and price structure. If buyers continue to step in with stronger volume, RENDER can work through the resistance levels at 1.493, 1.643 and 1.854. Each level can act as the next confirmation point as the move develops.
Of course, the long setup can still be invalidated if price loses the demand zone, selling volume becomes dominant, RSI falls back below 50, or market structure creates a fresh lower low. For now, these are the key levels and signals I’m watching closely. 🔥📊
#LEO524 #RENDER
In-depth trading ideas
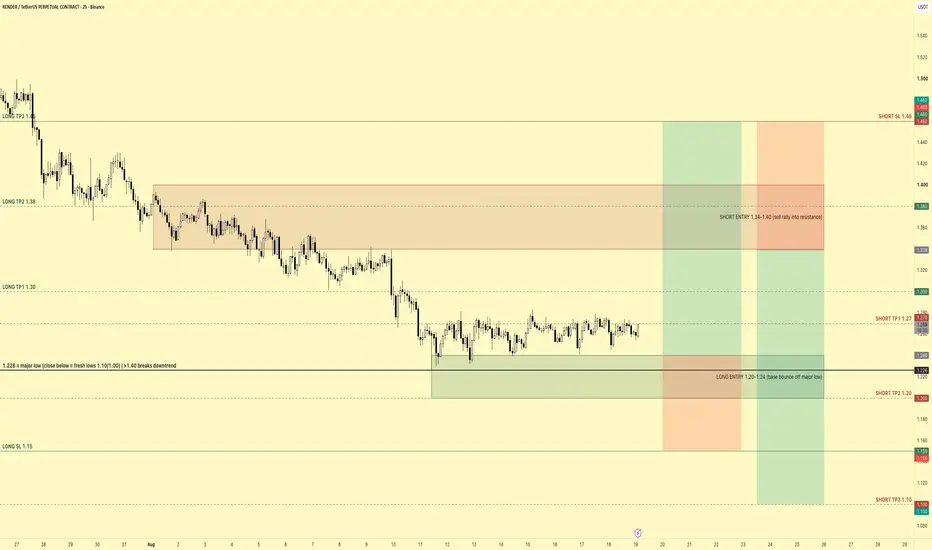
RENDERRENDER is in a strong downtrend on the daily chart: it has declined approximately 35% from 2.435 to 1.226 and is currently just above the major dip at 1.226, in a very narrow range between 1.24–1.28.
This is a critical decision zone: either a reaction comes from this base or it breaks down.
Since the main direction is down, rallies are selling opportunities; in the reaction sell from the 1.34–1.40 resistance, targets are 1.27 / 1.20 and 1.10, with a stop above 1.46.
On the base side, for buying from the 1.20–1.24 region, the stop is below 1.15, with targets at 1.30 / 1.38 and 1.46.
Decision points are clear: if the daily close rises above 1.40, the downtrend structure is broken; if it falls below 1.20 and the 1.226 dip is lost, it opens the way to new lows at 1.10 and 1.00.
Due to high volatility, positions should be kept small.
-CryptoSignalAPP Team
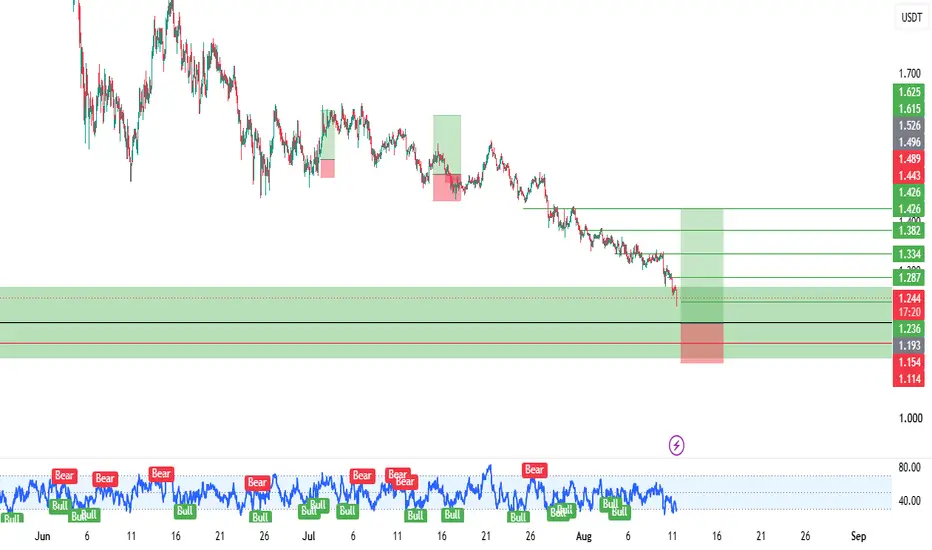
RENDER USDT LONG SIGNAL41. RENDER/USDT – Trade Setup (LONG)
📈 Position Type: LONG
🕒 Timeframe: 1H
📊 Market: Futures
💰 Entry Zone:
1.195
1.153
🛑 Stop-Loss:
1.110
🎯 Take-Profit Targets:
• TP1: 1.237
• TP2: 1.287
• TP3: 1.334
• TP4. 1.382
Tp5. 1.426
⚙️ Leverage:
5*3
▫️ After TP1, move SL to Entry + 0.2%.
▪️ Exit Plan:
• 40% at TP1
• 20% at TP2
• 20% at TP3
20% at TP4
📌 Risk Management:
Risk only 1–2% of your capital per trade.
⚠️ Always check and confirm the setup on your chart before entering the trade.
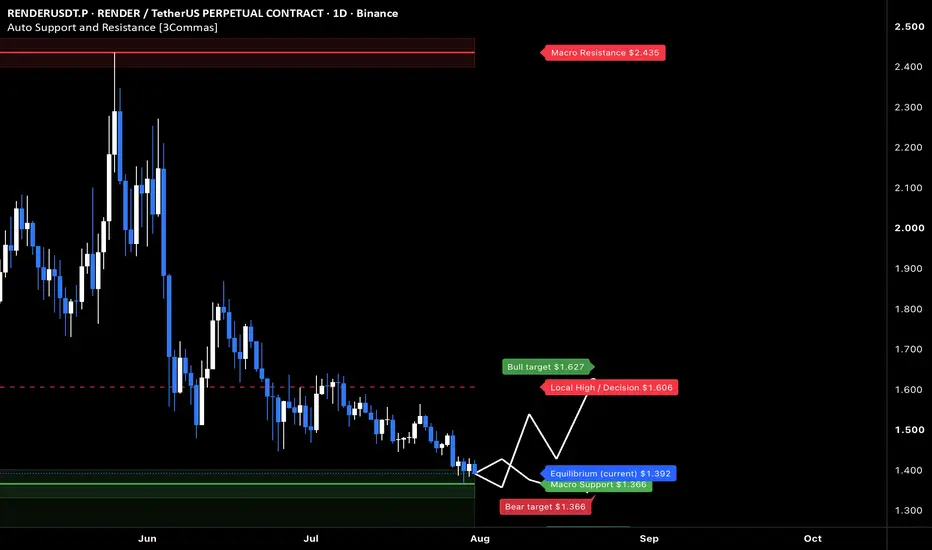
RENDER at macro floor: base recovery toward $1.627The Macro Picture 🗺️
RENDER ground down from the $2.435 macro ceiling all the way to the $1.366 macro floor and has flattened onto it at $1.392. The long, steady bleed has given way to a base right on support — exhaustion rather than continuation.
The Setup ⚙️
The Accumulation Zone 🟢
$1.366–1.392 is where the selling has dried up. Macro Support has held on retest, and this is the demand shelf a recovery would build from.
The Decision Point 🔴
$1.606 (Local High) is the structural gate. Before it, the $1.627 measured-move target is the first objective — reclaiming it proves buyers are stepping back in.
The Roadmap 🛣️
Hold the $1.366 floor → break $1.606 → run toward $1.627. Invalidation is a clean daily close below $1.366 — that voids the accumulation thesis.
This is a textbook DCA Accumulation Zone setup: scale in across the $1.366–1.392 band and let the base do the work.
#RENDER #RenderNetwork #crypto #trading #TA #3Commas #DCA
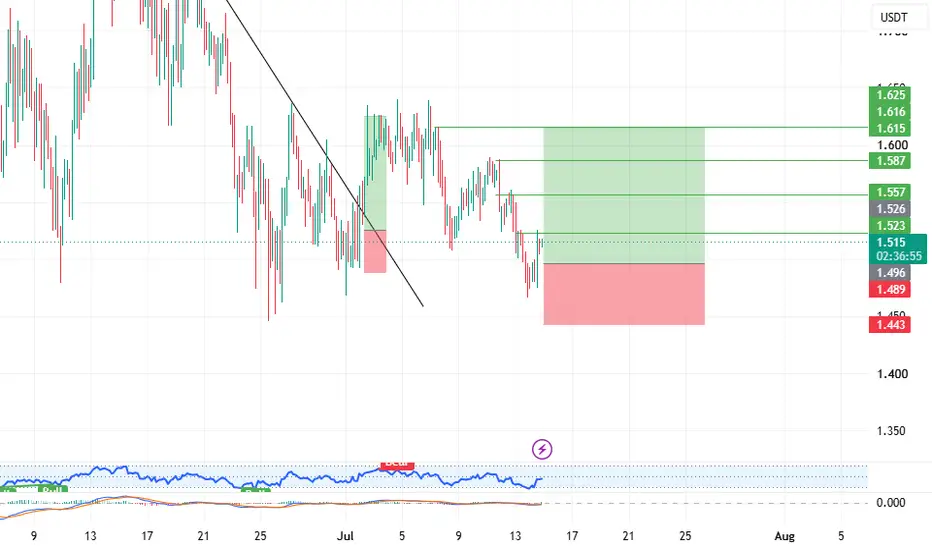
RENDER USDT LONG SIGNAL# 72 . RENDER/USDT – Trade Setup (LONG)
📈 Position Type: LONG
🕒 Timeframe: 1 H
📊 Market: Futures
💰 Entry Zone:
1.498
🛑 Stop-Loss:
1.443
🎯 Take-Profit Targets:
• TP1: 1.523
• TP2: 1.557
• TP3: 1.587
• TP4: 1.616
TP5:
TP6:
⚙️ Leverage:
5- 10
⚠️ After reaching TP1, move Stop-Loss to Entry Price.
📌 Risk Management:
Risk only 1–2% of your capital per trade.
Always confirm the setup on your chart before entry
RENDER 8H – Descending Channel Pressing Into Lower BoundaryRENDER on the 8H timeframe is currently trading around 1.745 after a sharp decline from the June spike high near 2.480, with price now grinding along the lower boundary of a descending channel near 1.415–1.460 following a recovery attempt that failed to reclaim the 1.580–1.600 horizontal level.
The chart shows a descending channel originating from the June 5 high near 2.480, with the upper trendline connecting that high through the mid-June recovery high near 1.880 and continuing to slope down into the 1.620–1.650 area currently. The lower trendline extends from the late April low near 1.640 through the June 9 low near 1.490 and the June 25 low near 1.460, now declining into the 1.415–1.440 zone. Price recovered from the June 25 low back toward 1.880 before the upper trendline rejected it and pushed price lower again through late June and into July. A horizontal reference level near 1.560–1.600 has acted as a pivot through the lower portion of the structure and has now been tested from both sides multiple times without a clean reclaim. Price is currently sitting just above it while the lower trendline continues to drop away beneath.
The 1.560–1.600 horizontal has become the line between a minor recovery attempt and a direct move toward the lower channel boundary, with the upper trendline continuing to compress any bounce from above.
Key Levels To Watch
→ 2.400–2.480 – June spike high, major resistance above
→ 2.000–2.100 – Prior consolidation zone, resistance
→ 1.850–1.900 – Prior recovery high, upper trendline rejection zone
→ 1.620–1.650 – Descending upper trendline, current overhead resistance (dynamic)
→ 1.560–1.600 – Horizontal pivot, current test
→ 1.415–1.460 – Lower channel boundary, next key support
→ Below 1.380 – Channel breakdown, extended downside
A reclaim of 1.560–1.600 on a confirmed 8H close and a push toward the upper trendline near 1.620–1.650 would open a potential test of 1.850–1.900 on a full channel recovery, though the descending structure would need a clean trendline break to confirm any meaningful shift.
A rejection at 1.560–1.600 and a move toward the lower channel boundary near 1.415–1.460 would mark another test of that level, and a confirmed close below it would signal a full channel breakdown with no clear horizontal support visible beneath.
Price failing to reclaim horizontal pivot, lower boundary approaching. Reclaim 1.560–1.600 and break upper trendline → recovery open toward 1.850–1.900. Reject here → lower boundary near 1.415–1.460 next, breakdown below opens extended downside. Bias bearish inside descending channel. Shift only on confirmed break above upper trendline with reclaim of 1.620–1.650.
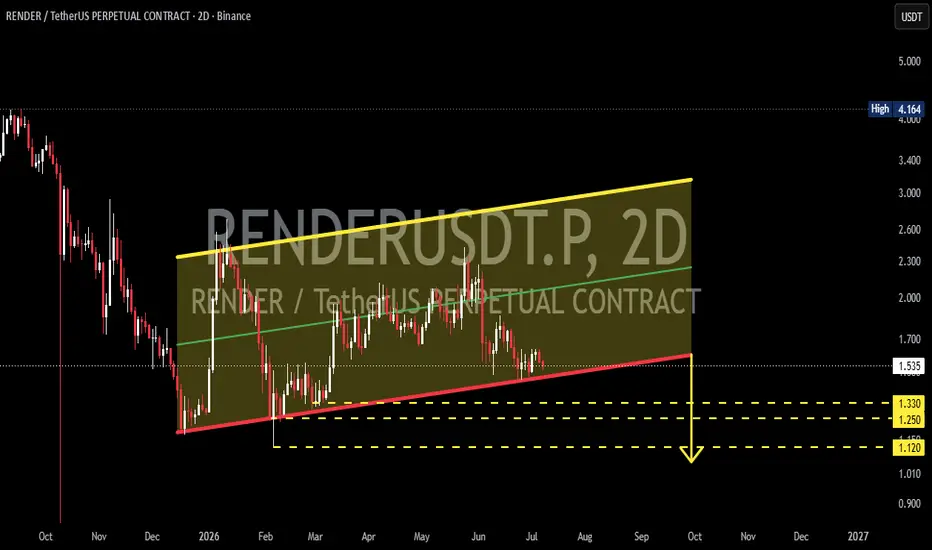
RENDERUSDT - Rising Channel, Is a Bearish Breakdown Next?📊 Technical Analysis
💵 Coin: CRYPTOCAP:RENDER #RENDER
⏳ Time Frame: 2D
📈 Pattern: Rising Channel (Bearish Bias)
🎯 Current Focus: Watching for price reaction at the channel support to determine the next directional move.
---
📚 Pattern Overview: Rising Channel 📈
The chart shows price moving within a Rising Channel, a pattern formed by two parallel ascending trendlines.
⚠️ Although this pattern appears bullish because the price continues to form Higher Highs and Higher Lows, a Rising Channel that develops after a downtrend often acts as a bearish continuation pattern.
This suggests that the upward movement is gradually losing momentum 📉, making a potential breakdown increasingly important to monitor.
📍 At the moment, the price is trading very close to the Lower Trendline (Channel Support), making this a critical decision zone for the next major move.
---
🟢 Bullish Scenario 🚀
If the price can:
✅ Hold above the Rising Channel support. ✅ Produce a strong bullish bounce. ✅ Be supported by increasing buying volume. 📊 ✅ Break above the minor resistance around 1.70 – 1.90 USDT.
Then the next upside targets become:
🎯 Target 1: 2.10 USDT 🎯 Target 2: 2.50 USDT 🎯 Target 3: 3.00 – 3.20 USDT (Upper Channel) 🚀
💡 As long as the channel support remains intact, the medium-term bullish structure is still considered valid.
---
🔴 Bearish Scenario 📉
The primary bearish scenario to watch is if the price:
❌ Breaks below the Rising Channel support. ❌ Closes a 2D candle decisively below the support trendline. ❌ Confirms the breakdown with increasing selling volume. 📊
If these conditions are met, the Rising Channel could fail and confirm a Bearish Continuation pattern.
📍 The next key support lies within the Yellow Block, located at:
🟡 1.33 – 1.25 USDT
If this support zone also fails to hold, the decline could extend toward:
🎯 1.12 USDT 📉
⚠️ A confirmed breakdown from the channel would shift the overall market structure to a more bearish outlook and increase the probability of a deeper correction.
---
📌 Conclusion 📝
⚡ RENDER is currently trading at a critical support zone, as the price is testing the Lower Trendline of the Rising Channel.
🟢 Bullish: As long as the channel support holds, a rebound toward the upper boundary of the channel remains possible.
🔴 Bearish: If the channel support breaks, attention will shift to the Yellow Block (1.33 – 1.25 USDT), with a potential downside target at 1.12 USDT.
🔥 The price reaction at this support area will likely determine the next major trend direction.
> ⚠️ Always wait for candle close and volume confirmation before making any trading decisions. Never rely solely on pattern projections. 📊
---
#RENDER #RENDERUSDT #Crypto 🚀 #CryptoTrading 📈 #TechnicalAnalysis 📊 #TradingView #PriceAction #RisingChannel #BearishContinuation #Support #Resistance #Breakdown #Altcoins #Binance #CryptoSignals #MarketAnalysis #SwingTrading #ChartAnalysis #Bullish 🟢 #Bearish 🔴
RENDER will experience deeper drops ahead (12H)The larger structure that RENDER appears to have formed looks like a Diametric pattern.
Wave F of this Diametric has itself unfolded as a Symmetrical pattern and now seems to be complete. The price is currently developing Wave G of the overall formation.
A pullback into the red zone is expected before RENDER continues its decline.
We are looking for sell/short positions within the highlighted red zone.
The targets are marked on the chart. Once Target 1 is reached, move your stop loss to break-even.
If you have a symbol you want analyzed, first hit the like button and then comment its name so I can review it for you.
Do you also think RENDER is bearish?
RENDERUSDT — Bullish BC Reached, But One Magnet RemainsOKX:RENDERUSDT is sitting at an important decision point.
The larger bullish sequence is still active. Price broke the bearish trendline with meaningful displacement, created a valid bullish structure, and has now pulled back into the bullish B C zone .
That matters.
BC is where buyers are supposed to defend if the bullish sequence is real.
But there is one key detail that cannot be ignored:
The smaller opposing bearish sequence has not reached its C target yet .
That creates the real tension on this chart.
Yes, bullish BC has been reached.
But the opposing bearish C is still sitting slightly lower as an unfinished magnet.
So I would not treat this as an automatic long just because price touched BC. The cleaner scenario is either:
Price taps deeper into the opposing bearish C target, completes that draw, and then shows bullish reaction from the larger BC zone.
Or price fails to reach the bearish C, breaks the local bearish orderflow, and proves that sellers lost control before completing their target.
That is the signal I care about.
The bullish idea remains alive as long as the larger sequence’s B is not breached. If B breaks, the bullish sequence is invalidated.
For now, RENDER is inside the battlefield:
A valid bullish BC has been reached.
An opposing bearish C remains unfinished.
The next clean shift in orderflow will likely reveal whether this is accumulation before continuation, or whether price still needs to flush lower first.
I am watching for buyers to defend this zone with evidence — not hope.
Key levels:
Bullish BC: reached
Opposing bearish C: not reached yet
Bullish invalidation: B breach
Upside draw: active bullish C target
$renderhola folks $3.27 is what am looking for this move
stop below 200 on H1
IF we pop will be an awesome R/r
if not we try again still unsure if we take our last local low on bitty or not
just entered lets see what NY brings
looking for a reclaim of the range high here whcih is confluent with the 200 ema on H4
RENDER/USDT — Long After Recovery, Sell Complete [Quantum Algo]RENDERUSDT Perpetual
Context:
RENDER had a brutal sell-off. The previous Sell signal at 2.10 delivered a clean drop down to 1.50 — nearly 30% in less than a week. After bottoming, price has built a clear recovery structure with higher highs and higher lows back up to 1.85. Now a fresh Buy signal has fired at 1.8376 as the rotation completes.
Why this setup works — three confluences:
Sell signal fully delivered, counter-signal firing — the prior Sell on this exact chart played out its complete move. Sellers got paid. Now a Buy is firing at the recovery zone — the cleanest type of rotation setup in any market. When the same chart cycles between directional signals at the extremes, the structure has shifted
Higher low structure built from the bottom — the recovery from 1.50 didn't go straight up. Price made 1.65, pulled back to 1.55, rallied to 1.80, dipped to 1.72, and is now pushing above 1.83. Three higher lows in sequence = trend reversal confirmed mechanically
Impulsive recovery candles — the bullish candles on the way up have been larger than the corrective red candles. Strong buying, weak selling. That's the volumetric signature of a real reversal, not a dead-cat bounce
A Buy signal fired at 1.8376. We took it.
Trade management:
Entry: 1.8376
Stop Loss: 1.7185 — below the demand zone and recent higher low
TP1: 2.0340 — mid-range resistance, 50% off, stop to breakeven
TP2: 2.0401 — extended target for 100% exit
R:R: ~1:1.6 to TP1, ~1:1.7 to TP2. Strong asymmetric reward with structure-defined risk below.
Invalidation: Close below 1.7185 — the higher low structure breaks and the recovery thesis fails.
The lesson:
The transition from a completed Sell to a fresh Buy is one of the cleanest setups in trading. Most traders stay locked into bearish bias even after the sell-off is done. They short the recovery, fight the buyers, get squeezed out. The disciplined approach is reading the phases — Sell delivered, bottom formed, higher lows built, recovery confirmed, Buy fired. Trade the phase the market is in.
Signal fired. We took it. Update coming.
⚠️ Disclaimer: This is not financial advice. Trade ideas shared here are for educational and informational purposes only. All trading involves risk — past performance does not guarantee future results. Always do your own research and manage your risk accordingly.
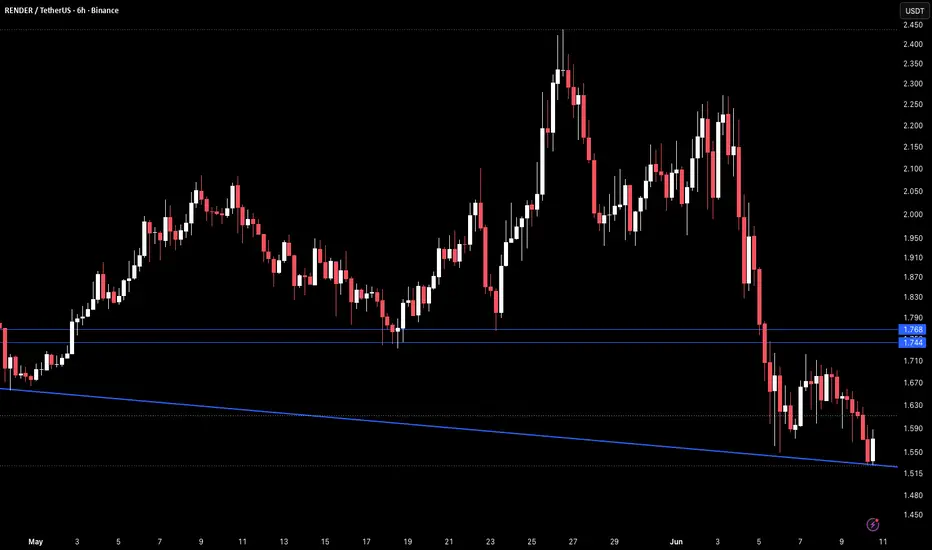
RENDER 6H – Trendline & Support Breakdown at New LowsRENDER on the 6H timeframe is currently trading around 1.577 after a sharp sell-off in early June that broke through the rising macro trendline from the February lows and two key horizontal support levels at 1.744 and 1.768 in quick succession, pushing price to the lowest level on this chart.
The trendline that had been the macro floor for over three months was broken cleanly with no meaningful recovery, and both horizontal levels that had acted as consistent pivots throughout April and May are now overhead resistance.
There is no visible structural support below current levels on this chart.
Key Levels To Watch
2.400–2.450 → Prior spike high, major resistance above
2.100–2.200 → Prior range highs, key resistance
1.900–1.950 → Prior support zone, now resistance
1.768 → First broken horizontal support, now resistance
1.744 → Second broken horizontal support, now resistance
1.577 → Current price, lowest level on chart
Below 1.515 → No visible support, new lows likely
The structure is fully bearish. The rising macro trendline that had survived multiple deep tests across three months was broken decisively and both horizontal support levels that defined the range floor have now been lost.
A recovery back above 1.744 and a hold above 1.768 would be the minimum requirement for any structural shift, putting the broken trendline overhead as the next resistance.
Continued rejection below 1.744 keeps the path of least resistance toward 1.515 and potentially new lows below.
Structure fully bearish below broken trendline and horizontal support.
Recovery only on reclaim of 1.744–1.768.
Below 1.515 opens room toward new lows with no structure below.
RENDERSince Arthur Hayes said AI crypto tokens can crash and that means they will go up, Render is a pretty solid option and is one of my favorite projects.
However it still has to reclaim $1.80 short term and then break the $2.60 resistance which it got rejected from several times, and then there will be nothing to stop it, as it's clear on chart, the price is staying above the broken resistance line given the current bearish market which means bulls are in control, so this is a good buying opportunity imo.
A possible fake breakout might happen below the $1.50 support which render has to hold to be able to go up, if its broken and fail to reclaim, then its doomed and we can expect $1.20.
$RENDER Long - Never surRENDERSignal: Long
Price: 1.722
Technical Analysis:
RENDER is showing a cautious bullish recovery setup, with price still holding just above the lower Bollinger Band area around 1.695 despite the sharp pullback to roughly 1.719. The recent candle is clearly bearish and price has fallen below the Bollinger midline near 1.998, which shows short-term weakness, but the broader structure is not fully broken as long as the lower band continues to act as support. The 20 EMA slope is deeply negative around -88.28, confirming that momentum has weakened, while the Accumulation/Distribution line near -465.69M shows that capital flow remains under pressure. However, from a bullish thesis perspective, the key point is that price is now testing a lower volatility boundary where rebounds can form if buyers defend the zone. A stronger bullish confirmation would require RENDER to reclaim the Bollinger midline around 1.998 and stabilize above it, but for now the setup can be viewed as a speculative bullish bounce attempt from support rather than a confirmed trend continuation.
Fundamental Analysis:
Render Network (RENDER) is emerging as a leading beneficiary of the accelerating shift toward decentralized GPU compute, as demand for AI inference, generative imaging, 3D rendering, and spatial computing continues to outpace centralized cloud supply amid ongoing hardware constraints. The key structural catalyst is the activation of its Burn-Mint Equilibrium model on Solana, where tokens are burned for each on-chain rendering or AI job while emissions adjust dynamically to real usage, creating a self-regulating supply profile that can become increasingly deflationary as activity scales. Adoption signals remain strong, with tens of millions of frames rendered annually, thousands of active nodes, and a notable expansion of available capacity through an approved Salad Network subnet adding roughly 60,000 GPUs. Broad workflow compatibility (including OctaneRender and Blender) alongside partnerships with AI-native players such as Stability AI and Runway underscore real-world utility and revenue-driven usage, positioning RENDER as a differentiated infrastructure asset with credible long-term value accrual as AI compute demand compounds.
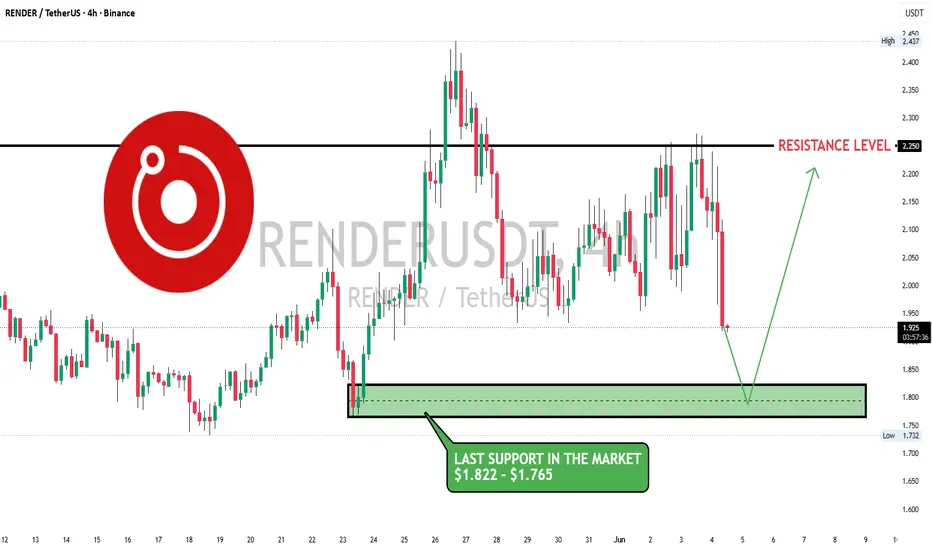
$RENDER approaching its last major support at $1.82-$1.76BINANCE:RENDERUSDT (4H) – Bears Take Control, Major Support Test Incoming ⚠️
BINANCE:RENDERUSDT is showing a short-term bearish structure after getting rejected multiple times from the $2.25 resistance level. The chart shows a clear range over the past several days, with buyers repeatedly failing to break above resistance while sellers continue defending the highs.
The latest candle is a strong bearish impulse that pushed price back below the recent consolidation range, signaling weakening momentum.
📍 Key Levels
🔴 Resistance: $2.25
🟢 Major Support Zone: $1.822 - $1.765
📈 Recent Swing High: $2.437
💰 Current Price: $1.93
From a market structure perspective, price has been making lower highs since the local top around $2.43, while support has not yet been tested. That leaves a visible liquidity pocket sitting around the $1.82-$1.76 demand zone.
The chart suggests a likely scenario where price sweeps into support before attempting a recovery. This area represents the last major bullish defense visible on the chart and will be critical for determining the next trend direction.
Momentum & Psychology 🧠
The repeated rejection at $2.25 likely trapped late breakout buyers. Today's sharp selloff looks like a flush of weak hands and leveraged longs.
Bulls now need to prove themselves at support. If buyers step in aggressively around $1.82-$1.76, a relief rally back toward $2.25 becomes possible.
However, if that support zone fails, market sentiment could shift decisively bearish and open the door for a deeper correction.
What the Chart Says
✅ Long-term range still intact
❌ Short-term momentum bearish
⚠️ Major support test approaching
🎯 Key reclaim level remains $2.25
Recent Render Developments 📰
BINANCE:RENDERUSDT has remained one of the stronger AI-sector tokens recently. Over the last few days, the project benefited from renewed capital rotation into AI-related crypto assets, with on-chain activity and trader participation increasing significantly. Recent reports highlighted elevated active addresses, rising derivatives interest, and continued demand for decentralized AI infrastructure narratives.
Outlook
For now, the setup is cautiously bearish until support is reached. The $1.82-$1.76 zone is where I'd expect the next major battle between bulls and bears.
Do you think BINANCE:RENDERUSDT bounces from support, or are we headed for a deeper correction below $1.76? 🤔📊
RENDER Holding Ascending Channel Inside Macro DowntrendRENDER is still under the larger Broadening Wedge , so the macro trend has not fully flipped yet. But short term, price is building a clean ascending channel with higher lows, showing buyers are slowly gaining control.
RSI is also holding an upward trendline, which supports the idea of improving momentum. The key breakout zone is around 2.30 - 2.50. If price breaks and holds above that area, RENDER could open a stronger move toward 3.50+.
But if price loses the lower ascending channel support, the setup weakens and a pullback toward 1.80 - 1.60 becomes possible.
Right now, this is a bullish short-term structure fighting against macro downtrend resistance. Break above 2.50 is the real confirmation.
Render Token Enters Bullish Zone To Start New UptrendRENDER Token completed its bear market cycle with a repeat of the same sequence of 2022 & 2023. There was a major low in 2022 followed by a higher low in 2023 then sustained bullish action, a bull market ending with a bull-run.
RENDERUSDT produced a major low in 2025 followed by a higher low in 2026. The 2026 higher low is followed by slow and steady growth, a signal of strength. RENDER Token is now trading back within the bullish zone and looks ready for massive growth. We can be looking at the start of a new bull market, a bull market that can also end with a bull-run.
This is a very powerful chart setup and market conditions are great. RENDERUSDT closed two consecutive weeks green and has been rising for months non-stop, since early February 2026. After the Feb low, there isn't one challenge of support, we have a clearly rising tendency on this chart.
Months and months of bullish consolidation tends to lead to a bullish explosion. Four months of sideways with slightly rising prices can result in a major bullish jump. We've seen it already across dozens if not hundreds of altcoins. The best is yet to come.
Namaste.
RENDER (RNDR) – Massive Accumulation at Channel Support | 10x Render (RNDR) appears to be trading near the lower boundary of a multi-year ascending channel that has historically acted as a major support zone. After a prolonged correction from its all-time highs, price has entered what could be a significant accumulation phase.
Bullish Scenario
If RNDR successfully confirms support and breaks the recent consolidation range (around 3$), the next phase could target progressively higher resistance levels, with the ultimate objective being a retest of the upper boundary of the macro ascending channel around the $18–20 region.
This analysis reflects a personal market view based on technical analysis and should not be considered financial advice.
RENDER at macro ceiling: bullish continuation toward $2.70The Macro Picture 🗺️
RENDER has completed a textbook structural reset on the daily. The February capitulation flush to $1.13 cleared out over-leveraged longs, and what followed was three months of patient accumulation between $1.65 and $2.05 — the kind of base that desperately needs to be tested by a real impulse before larger players commit. That impulse is now in motion. Price has reclaimed the $2.05 ceiling and tagged $2.42 in a single push, with daily RSI rotating sharply through 70 — momentum is engaged but not yet exhausted. The roadmap points toward the macro ceiling at $2.70, the January structural peak that still stands as the last untested resistance on this leg.
The Setup ⚙️
The Support Flip: The $2.05 region that capped every rally from March through April has flipped into demand. A controlled pullback into this zone is the path of least resistance before the next leg — bulls are defending it, and the bears who faded the prior ceiling are now trapped on the wrong side of structure.
The Reaction: Price tagged $2.42 and pulled back into the $2.20 pocket — a healthy reaction, not a rejection. This local high is the immediate gate that needs to be reclaimed for the macro thesis to stay intact.
The Ceiling: The $2.70 macro resistance marks the January structural peak and a high-confluence zone where the last cycle of supply still sits unfilled. As indicated by the white projection, this is where the structural move resolves — either as a clean breakout opening fresh discovery, or as a rejection that resets the broader range.
The Roadmap: Primary target sits at $2.70 — a measured retest of the $2.05 support flip followed by continuation through $2.42 unlocks the macro ceiling. Invalidation: a sustained daily close below $1.95 would invalidate this bullish thesis and signal the breakout was a liquidity sweep rather than a genuine structural reset.