In-depth trading ideas
Oil is back on the tableBrent crude's impulsive advance has changed everything. From a wave 2 consolidation, we are back into the possibility of a third-wave advance. The word impulsive refers to the Elliott wave five-wave rise that we see on charts. Five waves up indicate that the trend is up and not down. This means higher levels are possible even after pullbacks. This change in trend, following the recent return to war, shows that the situation is getting worse again and is far from resolved. The world is not exactly prepared for oil shortages. We survived the first round but can survive a second. Time will tell.
Oil Fell 37% While the Hormuz Blockade Was Still On
OANDA:BCOUSD
The Market Already Faded One Hormuz Blockade.
This Time Is Different - Maybe.
--------------------------------------------------------------------
THE OBSERVATION
Brent peaked near $112 in mid-May. By July 1 it traded at roughly $70.50. That is a 37% collapse in six weeks.
Here is the part worth sitting with: THE BLOCKADE NEVER LIFTED.
The Strait of Hormuz has been contested since late February. Through the entire 37% decline, the disruption was still there. What changed was not the physical situation. What changed was that progress toward a US-Iran settlement drained the premium out of the price while the underlying condition stayed exactly the same.
That is not a market being irrational. That is a market telling you precisely how it prices geopolitical disruption: as a decaying option, not as a permanent cost.
Remember that number. 37% in six weeks, with the disruption intact. It is the base rate for everything that follows.
--------------------------------------------------------------------
WHAT JUST HAPPENED
On July 13 the US reinstated a blockade on Iranian shipping and - the part almost nobody read carefully - imposed a 20% toll on cargo transiting the strait.
Brent bounced from roughly $77 to $87.50. It now sits at $85.41.
Look at what that bounce actually is. It retraced roughly 40% of the May-to-July collapse and stopped. RSI is at 50. Dead neutral. The market absorbed the news in 48 hours and went flat.
The market has already decided. It is pricing this as another decaying option, because that is what the last one was.
--------------------------------------------------------------------
THE ARGUMENT AGAINST THE MARKET
Here is the case that this time is structurally different, and I want to be clear that the tape currently disagrees with me.
A blockade and a toll are different financial objects.
A BLOCKADE is binary and reversible. It resolves on diplomacy. Its half-life is a news cycle. Fading it has been profitable for decades because the thing genuinely does go away - and we just watched exactly that happen, in public, over six weeks.
A TOLL is an ad valorem charge on every future cargo. It does not resolve on a handshake. It gets capitalised - into freight rates, into war-risk insurance, into the landed cost of roughly a fifth of the world's seaborne oil. It is a step in the cost curve, not a spike on the chart.
If that distinction is real, then the fade works on the wrong component of the move. The spike decays and the step remains, and $85 is a floor rather than a lower high.
If it is not real - if the toll is rhetoric that is never enforced - then this is May all over again, and the base rate says $75 and then lower.
--------------------------------------------------------------------
THE VARIABLE THAT DECIDES IT
Not the Fed. Not OPEC. Not the next Truth Social post.
Washington says the strait is open. Tehran says vessels must transit channels it controls. On paper both can keep making the case forever.
On the water, the verdict belongs to SHIPOWNERS, INSURERS AND CREWS being asked to sail through an active military standoff. Whether vessels move. Whether underwriters will write the risk. Whether the rules of passage survive the next strike.
That is the observable, and it is not the oil price.
WATCH WAR-RISK INSURANCE PREMIA FOR GULF TRANSITS, AND WATCH WHETHER TANKER DAY RATES HOLD THEIR ELEVATION AFTER THE NEXT DE-ESCALATION HEADLINE.
If the spike fades and the rates do not, the step function is real and it is being capitalised in front of you while everyone stares at the front-month contract.
If the rates fade with the spike, the market was right, I was wrong, and the toll was a headline.
--------------------------------------------------------------------
WHERE THIS DOESN'T GO
Consensus base case is $75-85. Note where we are: $85.41. At the TOP of that band, not through it.
The road to triple digits needs more than a toll - sustained disruption to tanker traffic, damage to production infrastructure, or simultaneous trouble at Hormuz and Bab el-Mandeb.
There is also a political governor. With US midterms approaching, triple-digit oil is a tax on consumers, corporate margins and the inflation outlook. Washington has a strong incentive to prevent that, and that incentive is a real constraint on the upside case - not a
detail.
--------------------------------------------------------------------
WHAT WOULD PROVE ME WRONG
- The toll is never enforced. It becomes rhetoric and I built an argument on a press release.
- Insurers and shipowners keep sailing at normal rates. Then the risk is immaterial and the toll is noise.
- Brent breaks $77 and takes out the July 9 low. That is the fade completing, and the base rate wins.
The cleanest disconfirmation is the simplest: if this looks like May by August, I was wrong about the mechanism, not just the timing.
--------------------------------------------------------------------
WHAT I DON'T KNOW
I have the price. I do not have war-risk premia or tanker day rates, which is where this thesis actually lives or dies. Everything above is a structural argument built on the price series and a policy document - which is not the same as evidence.
I am also aware that the tape currently disagrees with me. RSI 50, a stalled bounce, and a 37% precedent all say fade. That is either the opportunity or the refutation, and I do not get to decide which.
--------------------------------------------------------------------
Analysis of market conditions. Not financial advice, not a recommendation, not a signal. Trading involves substantial risk of loss.
Possible upmove in CrudeCrude closed ~10% higher last day to close above $83, first time in last four weeks, amid the geopolitical tensions. It has closed above the key resistance zone of $80. Hence, I expect a upmove towards $90-92 (previous support zone) from here. Let me know your thoughts. DYOR.
Crude AnalysisThe current ~$80 acted as a resistance multiple times pre-conflict, so I expect it to take some support at the current levels. $70 is a multi-year support level and in fact the recent rally fuelled to $120 after the strong breakout and retest from this level. On the otherside, $92 can continue to act as a resistance level in the near term.
Let me know your thoughts/feedback.
Don;t get fooled by Calm Before The Stormcrude is highly regulated commodity. Everbody wants a piece of the pie making it a slow mover. It has completed wave (B) in almost 3yrs and only 1 of (C) was done. That itself shook the world. Now the genie is out of the bottle....it cannot be re-bottled whatever wishful thinking one can undergo. Wave 2 of (C) will be over around 75 level and then to our utter panic, will go on moving up. ULTIMATELY IT WILL CROSS ATH making us pray for the Dr saab to come back from his Heavenly abode.
STATUTORY WARNING:
This is what I see (as per Neo wave) and shared for education purpose only. NOT A TRADING RECOMMENDATION
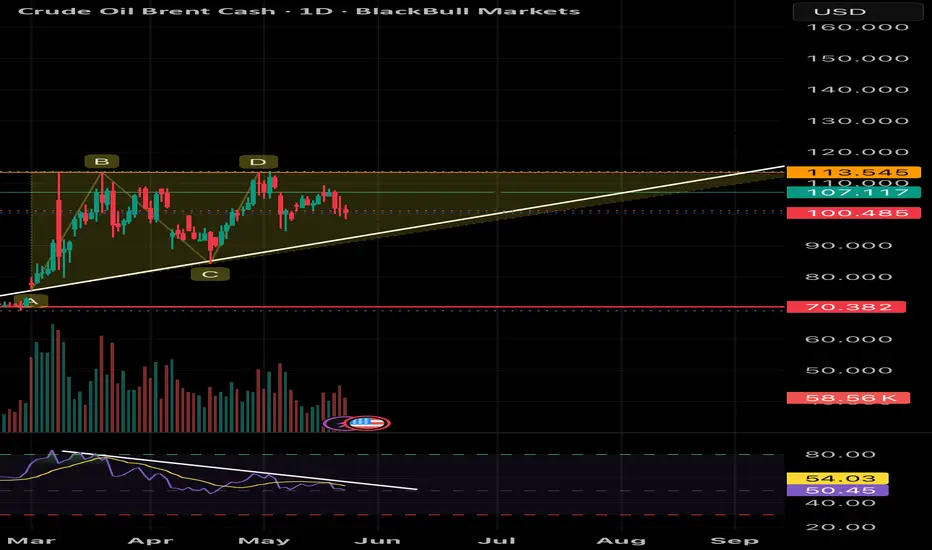
Brent Crude Oil – Daily Time Frame AnalysisBrent Crude Oil – Daily Time Frame Analysis 📊
Brent Crude continues to trade inside a broader bullish structure while respecting a long-term rising trendline from March lows. However, momentum is slowing near the major supply zone around 113–114.
🔹 Key Observations:
• Price is forming higher lows, indicating buyers are still active.
• Strong resistance seen near 113.5 where multiple rejections occurred.
• Current price around 100 is trading close to trendline support.
• RSI shows a mild bearish divergence with lower highs, suggesting weakening momentum.
📌 Important Levels:
➡ Resistance:
• 107.1 – Immediate hurdle
• 113.5 – Major breakout zone
➡ Support:
• 99–97 – Crucial short-term support
• 90 – Next strong support if breakdown occurs
• 70.3 – Major long-term support
📈 Bullish Scenario:
A strong close above 107 can revive bullish momentum, while a breakout above 113.5 with volume may trigger a fresh rally toward 120+ levels.
📉 Bearish Scenario:
Failure to hold the rising trendline and breakdown below 97 may lead to deeper correction toward 90 levels.
Overall, the structure remains cautiously bullish until the trendline breaks, but RSI divergence indicates momentum compression and traders should watch for a decisive breakout or breakdown from this range.
Disclaimer: This analysis is for educational purposes only and not financial advice. Please do your own research before taking any trade.
Trade Like Institution Part-10Technical analysis is the study of price charts, patterns, and indicators to predict future market movements. It is based on the idea that price reflects all available information.
Core Principles
Price discounts everything
Market moves in trends
History repeats itself
Types of Charts
Line Chart
Bar Chart
Candlestick Chart (most popular)
Important Insight
PCR is not a direct buy/sell signal. It is a contrarian indicator.
Very high PCR → Market may reverse upward
Very low PCR → Market may reverse downward
Limitations of PCR
It does not predict exact entry points
Works best when combined with technical analysis
Extreme values are more useful than normal values
UKOIL: At a Glance Level Analysis for 11th May 2026UKOIL: At a Glance Level Analysis for 11th May 2026
━━━━━🟥🟧🟨🟩🟦🟪⬛━━━━━
💥Level Interpretation / description:
✍🏻L#1: If the candle crossed & stays above the “Buy Gen”, it is treated / considered as Bullish bias.
L#2: Possibility / Probability of REVERSAL near 🔕RLB#1 & 🔔UBTgt
L#3: If the candle stays above “Sell Gen” but below “Buy Gen”, it is treated / considered as Sidewise. Aggressive Traders can take Long position near “Sell Gen” either retesting or crossed from Below & vice-versa i.e. can take Short position near “Buy Gen” either retesting or crossed downward from Above.
L#4: If the candle crossed & stays below the “Sell Gen”, it is treated / considered a Bearish bias.
L#5: Possibility / Probability of REVERSAL near 🔕RLS#1 & 🔔USTgt
HZB (Buy side) & HZS (Sell side) => Hurdle Zone,
✍🏻 *** Specialty of “HZB#1, HZB#2 HZS#1 & HZS#2” is Sidewise (behaviour in Nature)
Rest Plotted and Mentioned on Chart
Color code Used:
Green =. Positive bias.
Red =. Negative bias.
RED in Between Green means Trend Finder / Momentum Change
/ CYCLE Change and Vice Versa.
Notice One thing: HOW LEVELS are Working.
Use any Momentum Indicator / Oscillator or as you "USED to" to Take entry.
━━━━━🟥🟧🟨🟩🟦🟪⬛━━━━━
⚠️ DISCLAIMER:
The information, views, and ideas shared here are purely for educational and informational purposes only. They are not intended as investment advice or a recommendation to buy, sell, or hold any financial instruments. I am not a SEBI-registered financial adviser.
Trading and investing in the stock market involves risk, and you should do your own research and analysis. You are solely responsible for any decisions made based on this research.
"🔔As HARD EARNED MONEY IS YOUR's, So DECISION SHOULD HAVE TO BE YOUR's".
━━━━━🟥🟧🟨🟩🟦🟪⬛━━━━━
❇️ Follow notification about periodical View
💥 Do Comment for Stock WEEKLY Level Analysis.🚀
📊 Do you agree with this view?
✈️ HIT THE PLANE ICON if this technical observation resonates with you. It will Motivate me.
━━━━━🟥🟧🟨🟩🟦🟪⬛━━━━━
💡 If You LOOKING any CHART & want for Level and ANALYZE?
Share your desired stock names in the comments below! I will try to analyze the chart Levels, patterns and share my technical view (so far my Knowledge).
If Viewers think It can identify meaningful setups. Looking forward to hearing from all of you — let's keep this discussion going and help each other make better trading decisions.
___________🔕^^^⚫⚪^🙏🏼🙏🏼🙏🏼^⚪⚫^^^🔔___________
UKOIL: At a Glance MODIFIED Level Analysis for 06th May 2026UKOIL: At a Glance MODIFIED Level Analysis for 06th May 2026
Till now try to bounce chart Lowest level @ 100.72.
━━━━━🟥🟧🟨🟩🟦🟪⬛━━━━━
💥Level Interpretation / description:
✍🏻L#1: If the candle crossed & stays above the “Buy Gen”, it is treated / considered as Bullish bias. Cfm=> Confirmation.
L#2: Possibility / Probability of REVERSAL near 🔕RL/TF1 & 🔔RL/TF2
L#3: If the candle stays above “Sell Gen” but below “Buy Gen”, it is treated / considered as Sidewise. Aggressive Traders can take Long position near “Sell Gen” either retesting or crossed from Below & vice-versa i.e. can take Short position near “Buy Gen” either retesting or crossed downward from Above.
L#4: If the candle crossed & stays below the “Sell Gen”, it is treated / considered a Bearish bias.
L#5: Possibility / Probability of REVERSAL near 🔕RL/TF1 & 🔔RL/TF2
HZB (Buy side) & HZS (Sell side) => Hurdle Zone,
✍🏻 *** Specialty of “HZB#1, HZB#2 HZS#1 & HZS#2” is Sidewise (behaviour in Nature)
Rest Plotted and Mentioned on Chart
Color code Used:
Green, BLUE =. Positive bias.
Safron, RED =. Negative bias.
RED in Between Green means Trend Finder / Momentum Change
/ CYCLE Change and Vice Versa.
Notice One thing: HOW LEVELS are Working.
Use any Momentum Indicator / Oscillator or as you "USED to" to Take entry.
━━━━━🟥🟧🟨🟩🟦🟪⬛━━━━━
⚠️ DISCLAIMER:
The information, views, and ideas shared here are purely for educational and informational purposes only. They are not intended as investment advice or a recommendation to buy, sell, or hold any financial instruments. I am not a SEBI-registered financial adviser.
Trading and investing in the stock market involves risk, and you should do your own research and analysis. You are solely responsible for any decisions made based on this research.
"🔔As HARD EARNED MONEY IS YOUR's, So DECISION SHOULD HAVE TO BE YOUR's".
━━━━━🟥🟧🟨🟩🟦🟪⬛━━━━━
❇️ Follow notification about periodical View
💥 Do Comment for Stock WEEKLY Level Analysis.🚀
📊 Do you agree with this view?
✈️ HIT THE PLANE ICON if this technical observation resonates with you. It will Motivate me.
━━━━━🟥🟧🟨🟩🟦🟪⬛━━━━━
💡 If You LOOKING any CHART & want for Level and ANALYZE?
Share your desired stock names in the comments below! I will try to analyze the chart Levels, patterns and share my technical view (so far my Knowledge).
If Viewers think It can identify meaningful setups. Looking forward to hearing from all of you — let's keep this discussion going and help each other make better trading decisions.
___________🔕^^^⚫⚪^🙏🏼🙏🏼🙏🏼^⚪⚫^^^🔔___________
UKOIL: At a Glance Level Analysis for 06th May 2026UKOIL: At a Glance Level Analysis for 06th May 2026
UKOIL in Corrective mode.
━━━━━🟥🟧🟨🟩🟦🟪⬛━━━━━
💥Level Interpretation / description:
✍🏻L#1: If the candle crossed & stays above the “Buy Gen”, it is treated / considered as Bullish bias. Cfm=> Confirmation.
L#2: Possibility / Probability of REVERSAL near 🔕RL/TF1 & 🔔RL/TF2
L#3: If the candle stays above “Sell Gen” but below “Buy Gen”, it is treated / considered as Sidewise. Aggressive Traders can take Long position near “Sell Gen” either retesting or crossed from Below & vice-versa i.e. can take Short position near “Buy Gen” either retesting or crossed downward from Above.
L#4: If the candle crossed & stays below the “Sell Gen”, it is treated / considered a Bearish bias.
L#5: Possibility / Probability of REVERSAL near 🔕RL/TF1 & 🔔RL/TF2
HZB (Buy side) & HZS (Sell side) => Hurdle Zone,
✍🏻 *** Specialty of “HZB#1, HZB#2 HZS#1 & HZS#2” is Sidewise (behaviour in Nature)
Rest Plotted and Mentioned on Chart
Color code Used:
Green, BLUE =. Positive bias.
Safron, RED =. Negative bias.
RED in Between Green means Trend Finder / Momentum Change
/ CYCLE Change and Vice Versa.
Notice One thing: HOW LEVELS are Working.
Use any Momentum Indicator / Oscillator or as you "USED to" to Take entry.
━━━━━🟥🟧🟨🟩🟦🟪⬛━━━━━
⚠️ DISCLAIMER:
The information, views, and ideas shared here are purely for educational and informational purposes only. They are not intended as investment advice or a recommendation to buy, sell, or hold any financial instruments. I am not a SEBI-registered financial adviser.
Trading and investing in the stock market involves risk, and you should do your own research and analysis. You are solely responsible for any decisions made based on this research.
"🔔As HARD EARNED MONEY IS YOUR's, So DECISION SHOULD HAVE TO BE YOUR's".
━━━━━🟥🟧🟨🟩🟦🟪⬛━━━━━
❇️ Follow notification about periodical View
💥 Do Comment for Stock WEEKLY Level Analysis.🚀
📊 Do you agree with this view?
✈️ HIT THE PLANE ICON if this technical observation resonates with you. It will Motivate me.
━━━━━🟥🟧🟨🟩🟦🟪⬛━━━━━
💡 If You LOOKING any CHART & want for Level and ANALYZE?
Share your desired stock names in the comments below! I will try to analyze the chart Levels, patterns and share my technical view (so far my Knowledge).
If Viewers think It can identify meaningful setups. Looking forward to hearing from all of you — let's keep this discussion going and help each other make better trading decisions.
___________🔕^^^⚫⚪^🙏🏼🙏🏼🙏🏼^⚪⚫^^^🔔___________
UKOIL: At a Glance Level Analysis for 05th May 2026UKOIL: At a Glance Level Analysis for 05th May 2026
━━━━━🟥🟧🟨🟩🟦🟪⬛━━━━━
💥Level Interpretation / description:
✍🏻L#1: If the candle crossed & stays above the “Buy Gen”, it is treated / considered as Bullish bias. Cfm=> Confirmation.
L#2: Possibility / Probability of REVERSAL near 🔕RL/TF1 & 🔔RL/TF2
L#3: If the candle stays above “Sell Gen” but below “Buy Gen”, it is treated / considered as Sidewise. Aggressive Traders can take Long position near “Sell Gen” either retesting or crossed from Below & vice-versa i.e. can take Short position near “Buy Gen” either retesting or crossed downward from Above.
L#4: If the candle crossed & stays below the “Sell Gen”, it is treated / considered a Bearish bias.
L#5: Possibility / Probability of REVERSAL near 🔕RL/TF1 & 🔔RL/TF2
HZB (Buy side) & HZS (Sell side) => Hurdle Zone,
✍🏻 *** Specialty of “HZB#1, HZB#2 HZS#1 & HZS#2” is Sidewise (behaviour in Nature)
Rest Plotted and Mentioned on Chart
Color code Used:
Green, BLUE =. Positive bias.
Safron, RED =. Negative bias.
RED in Between Green means Trend Finder / Momentum Change
/ CYCLE Change and Vice Versa.
Notice One thing: HOW LEVELS are Working.
Use any Momentum Indicator / Oscillator or as you "USED to" to Take entry.
━━━━━🟥🟧🟨🟩🟦🟪⬛━━━━━
⚠️ DISCLAIMER:
The information, views, and ideas shared here are purely for educational and informational purposes only. They are not intended as investment advice or a recommendation to buy, sell, or hold any financial instruments. I am not a SEBI-registered financial adviser.
Trading and investing in the stock market involves risk, and you should do your own research and analysis. You are solely responsible for any decisions made based on this research.
"🔔As HARD EARNED MONEY IS YOUR's, So DECISION SHOULD HAVE TO BE YOUR's".
━━━━━🟥🟧🟨🟩🟦🟪⬛━━━━━
❇️ Follow notification about periodical View
💥 Do Comment for Stock WEEKLY Level Analysis.🚀
📊 Do you agree with this view?
✈️ HIT THE PLANE ICON if this technical observation resonates with you. It will Motivate me.
━━━━━🟥🟧🟨🟩🟦🟪⬛━━━━━
💡 If You LOOKING any CHART & want for Level and ANALYZE?
Share your desired stock names in the comments below! I will try to analyze the chart Levels, patterns and share my technical view (so far my Knowledge).
If Viewers think It can identify meaningful setups. Looking forward to hearing from all of you — let's keep this discussion going and help each other make better trading decisions.
___________🔕^^^⚫⚪^🙏🏼🙏🏼🙏🏼^⚪⚫^^^🔔___________
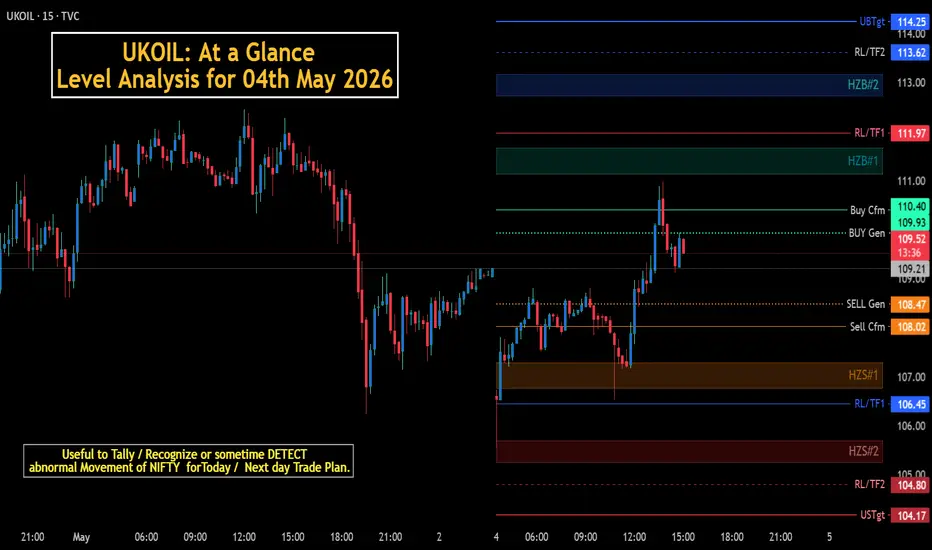
UKOIL: At a Glance Level Analysis for 04th May 2026UKOIL: At a Glance Level Analysis for 04th May 2026
━━━━━🟥🟧🟨🟩🟦🟪⬛━━━━━
💥Level Interpretation / description:
✍🏻L#1: If the candle crossed & stays above the “Buy Gen”, it is treated / considered as Bullish bias. Cfm=> Confirmation.
L#2: Possibility / Probability of REVERSAL near 🔕RL/TF1 & 🔔RL/TF2
L#3: If the candle stays above “Sell Gen” but below “Buy Gen”, it is treated / considered as Sidewise. Aggressive Traders can take Long position near “Sell Gen” either retesting or crossed from Below & vice-versa i.e. can take Short position near “Buy Gen” either retesting or crossed downward from Above.
L#4: If the candle crossed & stays below the “Sell Gen”, it is treated / considered a Bearish bias.
L#5: Possibility / Probability of REVERSAL near 🔕RL/TF1 & 🔔RL/TF2
HZB (Buy side) & HZS (Sell side) => Hurdle Zone,
✍🏻 *** Specialty of “HZB#1, HZB#2 HZS#1 & HZS#2” is Sidewise (behaviour in Nature)
Rest Plotted and Mentioned on Chart
Color code Used:
Green, BLUE =. Positive bias.
Safron, RED =. Negative bias.
RED in Between Green means Trend Finder / Momentum Change
/ CYCLE Change and Vice Versa.
Notice One thing: HOW LEVELS are Working.
Use any Momentum Indicator / Oscillator or as you "USED to" to Take entry.
━━━━━🟥🟧🟨🟩🟦🟪⬛━━━━━
⚠️ DISCLAIMER:
The information, views, and ideas shared here are purely for educational and informational purposes only. They are not intended as investment advice or a recommendation to buy, sell, or hold any financial instruments. I am not a SEBI-registered financial adviser.
Trading and investing in the stock market involves risk, and you should do your own research and analysis. You are solely responsible for any decisions made based on this research.
"🔔As HARD EARNED MONEY IS YOUR's, So DECISION SHOULD HAVE TO BE YOUR's".
━━━━━🟥🟧🟨🟩🟦🟪⬛━━━━━
❇️ Follow notification about periodical View
💥 Do Comment for Stock WEEKLY Level Analysis.🚀
📊 Do you agree with this view?
✈️ HIT THE PLANE ICON if this technical observation resonates with you. It will Motivate me.
━━━━━🟥🟧🟨🟩🟦🟪⬛━━━━━
💡 If You LOOKING any CHART & want for Level and ANALYZE?
Share your desired stock names in the comments below! I will try to analyze the chart Levels, patterns and share my technical view (so far my Knowledge).
If Viewers think It can identify meaningful setups. Looking forward to hearing from all of you — let's keep this discussion going and help each other make better trading decisions.
___________🔕^^^⚫⚪^🙏🏼🙏🏼🙏🏼^⚪⚫^^^🔔___________
UKOIL: At a Glance Level AnalysisUKOIL: At a Glance Level Analysis.
━━━━━🟥🟧🟨🟩🟦🟪⬛━━━━━
💥Level Interpretation / description:
✍🏻L#1: If the candle crossed & stays above the “Buy Gen”, it is treated / considered as Bullish bias. Cfm=> Confirmation.
L#2: Possibility / Probability of REVERSAL near 🔕RL/TF1 & 🔔RL/TF2
L#3: If the candle stays above “Sell Gen” but below “Buy Gen”, it is treated / considered as Sidewise. Aggressive Traders can take Long position near “Sell Gen” either retesting or crossed from Below & vice-versa i.e. can take Short position near “Buy Gen” either retesting or crossed downward from Above.
L#4: If the candle crossed & stays below the “Sell Gen”, it is treated / considered a Bearish bias.
L#5: Possibility / Probability of REVERSAL near 🔕RL/TF1 & 🔔RL/TF2
HZB (Buy side) & HZS (Sell side) => Hurdle Zone,
✍🏻 *** Specialty of “HZB#1, HZB#2 HZS#1 & HZS#2” is Sidewise (behaviour in Nature)
Rest Plotted and Mentioned on Chart
Color code Used:
Green, BLUE =. Positive bias.
Safron, RED =. Negative bias.
RED in Between Green means Trend Finder / Momentum Change
/ CYCLE Change and Vice Versa.
Notice One thing: HOW LEVELS are Working.
Use any Momentum Indicator / Oscillator or as you "USED to" to Take entry.
━━━━━🟥🟧🟨🟩🟦🟪⬛━━━━━
⚠️ DISCLAIMER:
The information, views, and ideas shared here are purely for educational and informational purposes only. They are not intended as investment advice or a recommendation to buy, sell, or hold any financial instruments. I am not a SEBI-registered financial adviser.
Trading and investing in the stock market involves risk, and you should do your own research and analysis. You are solely responsible for any decisions made based on this research.
"🔔As HARD EARNED MONEY IS YOUR's, So DECISION SHOULD HAVE TO BE YOUR's".
━━━━━🟥🟧🟨🟩🟦🟪⬛━━━━━
❇️ Follow notification about periodical View
💥 Do Comment for Stock WEEKLY Level Analysis.🚀
📊 Do you agree with this view?
✈️ HIT THE PLANE ICON if this technical observation resonates with you. It will Motivate me.
━━━━━🟥🟧🟨🟩🟦🟪⬛━━━━━
💡 If You LOOKING any CHART & want for Level and ANALYZE?
Share your desired stock names in the comments below! I will try to analyze the chart Levels, patterns and share my technical view (so far my Knowledge).
If Viewers think It can identify meaningful setups. Looking forward to hearing from all of you — let's keep this discussion going and help each other make better trading decisions.
___________🔕^^^⚫⚪^🙏🏼🙏🏼🙏🏼^⚪⚫^^^🔔___________
NIFTY vs BRENT CRUDE – Understand the Relationship(2021–Present)NIFTY vs BRENT CRUDE
The chart highlights how Brent Crude and NIFTY have interacted over multiple phases, reflecting broader macroeconomic cycles rather than a direct one-to-one correlation.
Key Observation
Brent Crude topped out in March 2022 and entered a corrective phase
From June 2022 to Sept 2024, NIFTY rallied strongly, forming a clear bullish structure
After making an ATH in Sept 2024, NIFTY corrected till April 2025
Crude remained relatively weak during this phase and has only recently started showing strength again
Why NIFTY tends to rise when Crude falls (Simple Logic)
India is a major crude importing economy, so oil prices have a strong macro impact:
Falling crude → lower inflation → stable interest rates
Lower input costs → better corporate margins
Improved liquidity → stronger equity participation
This creates a favorable environment for NIFTY to move higher
Important Reality
This relationship is not fixed or perfectly inverse
NIFTY is also driven by liquidity, global cues, and earnings
Crude is just one macro variable, not a direct trading signal
Key Insight
Crude sets the background, price action gives the trade
Falling crude → supportive environment for equities
Rising crude → can create pressure, but not always immediately
What the Current Structure Suggests
Crude has given a recent breakout and is holding above previous resistance (now support)
NIFTY has corrected and is stabilizing near key levels after a strong rally
Markets appear to be transitioning from correction → consolidation → potential expansion
Understanding the Cycle
Markets move in phases:
Expansion → Correction → Consolidation → Expansion
The highlighted zones in the chart represent a pause/adjustment phase, where both crude and equities were aligning with global macro conditions.
Final View
If global conditions stabilize and liquidity supports, this setup can lead to the next directional move in equities, but confirmation should always come from price action.
📌What to Watch Next
NIFTY holding above key support zone → continuation possible
Resistance zone near 24,400–24,500 remains crucial
Crude sustaining above breakout zone → may influence inflation sentiment
Sustained strength in both can lead to expansion phase
Failure to hold key levels can extend consolidation
This is my personal view , feel free to share your perspective.
✅ If you like my analysis, please follow me here as a token of appreciation :) in.tradingview.com/u/SatpalS/
📌 For learning and educational purposes only, not a recommendation. Please consult your financial advisor before investing.
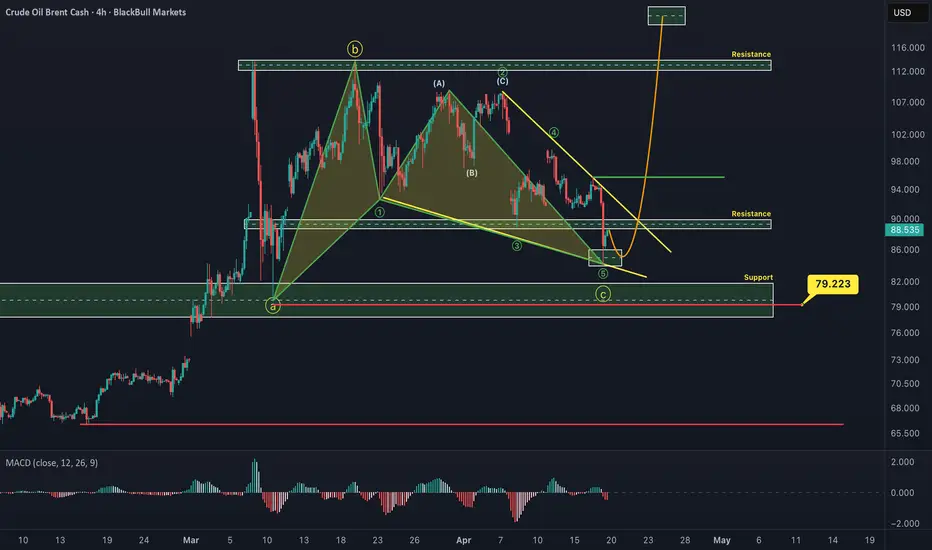
BRENT_H4📊 Technical Analysis (4H Timeframe)
Crude oil is currently showing bullish potential on the 4-hour timeframe. The formation of a Gartley harmonic pattern, combined with price reaching a key support zone, suggests a possible reversal to the upside.
Additionally, on the daily timeframe, we can observe a hidden bullish divergence, which typically indicates trend continuation and strengthens the bullish outlook.
🔹 Bullish Targets:
Price is expected to move higher toward the 119.986 – 123.242 resistance zone.
🔻 Invalidation Level:
If price breaks below 79.223, this analysis will be invalidated.
🛢️ Fundamental Analysis
From a fundamental perspective, oil prices remain supported by several key factors:
Supply constraints driven by OPEC+ production policies continue to limit global output.
Geopolitical tensions in key oil-producing regions add uncertainty and support higher prices.
Global demand outlook remains relatively stable, particularly with recovering industrial activity in major economies.
Any potential inventory drawdowns or disruptions in supply chains could further push prices upward.
However, traders should remain cautious of:
A potential slowdown in global economic growth
Changes in central bank policies impacting demand expectations
Unexpected increases in supply
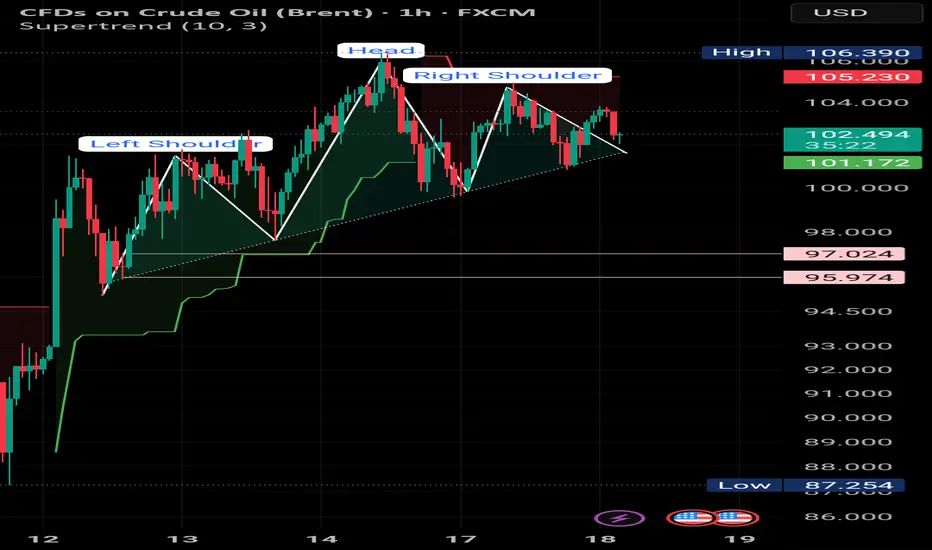
Brent Post-Hormuz Spike: Near-Term Bullish, Medium-Term BearishOn March 7, the Strait of Hormuz closure sent Brent from ~$80 to $120 in 48hrs. Price has since retraced to the $97–100 zone. The strait is still closed — the market is underpricing near-term risk.
Bull case: Break above $100 → $106 → $112. Goldman sees $147 if flows stay depressed.
Bear case: Rejection here → $90 MA → $75. JPMorgan targets $60 by H2 2026.
Key levels:
ACTIVTRADES:BRENT
Resistance: $106.42
Current battle: $99–100
Support: $97.15 / $90.31 (long MA) / $75.55
Verdict: Near-term BULLISH toward $106–112. Medium-term BEARISH once strait reopens.
Not financial advice.