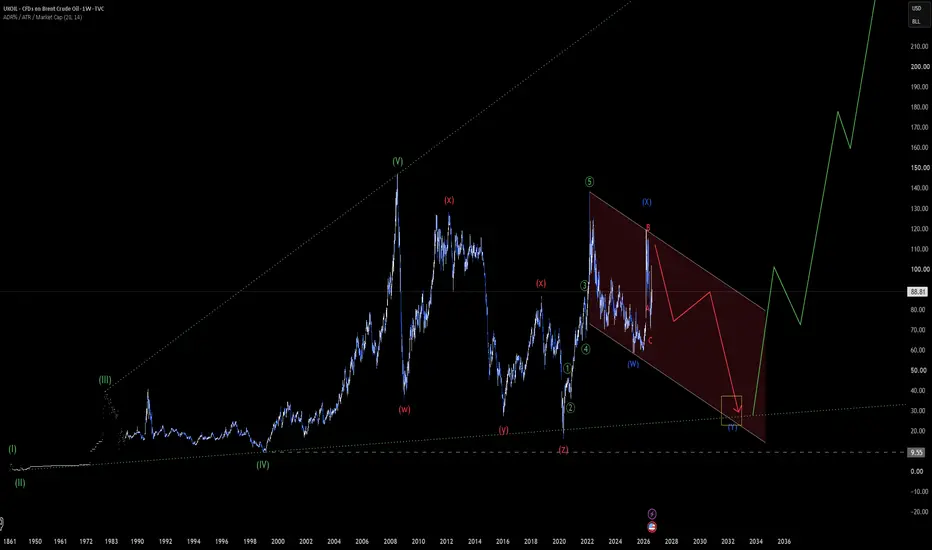
UKOILIn this idea I tried to study longterm bullish scenario. Clearly there are othre Scenarios which imply longterm bullish continuation.
Last bullish wave whic is marked as a (X) wave has enough clarity to recognize as an 3 wave corrective Wave ( Double zigzag).
If the price shows weakness to pass 120$, this scenario will be more likely to happen.
Thanks for reading my ideas.
In-depth trading ideas
BRENT CRUDE | (3H) | THE CHART ALCHEMIST (11-AUG-2026)📊 BRENT CRUDE — BUY TRADE SET-UP | (3H) | THE CHART ALCHEMIST
🟢 Buy Zone: $90.966 – $92.487
🎯 Target Prices:
• TP1: $94.616
• TP2: $97.937
• TP3: $101.306
• TP4: $101.396
🛑 Stop Loss: Below $89.781
⚠️ Disclaimer: This is for educational and informational purposes only, not financial advice. Trading involves substantial risk of loss. Always do your own analysis and use proper risk management. Trade at your own risk.
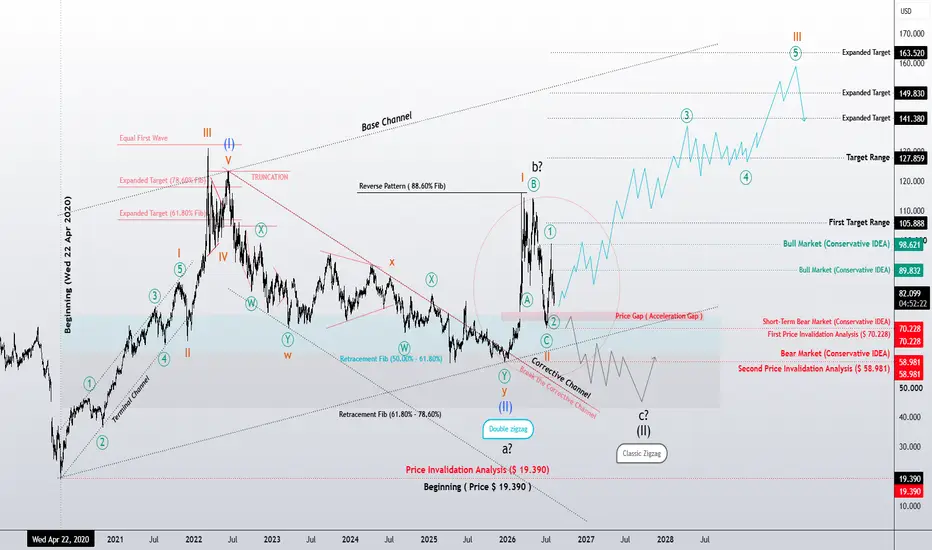
Is Wave 3 Beginning, or Is One More Correction Still Ahead?## Crude Oil: Is Wave 3 Beginning, or Is One More Correction Still Ahead?
From the largest Elliott Wave perspective, crude oil remains within the final fifth wave of the highest degree.
Following the completion of the larger-degree Wave 4, an entire eight-wave cycle appears to have been completed. The market has now reached a critical point where two primary scenarios remain valid.
### Aggressive Scenario
The bullish interpretation suggests that Waves 1 and 2 of Wave 3—within the larger fifth wave—have already been completed.
This count is supported by three nested impulsive structures across three different degrees, a configuration that often precedes a powerful acceleration in trend.
If this interpretation is correct, the market has likely entered the early stages of Wave 3, where momentum typically begins to strengthen.
### Conservative Scenario
The conservative interpretation remains equally valid.
Under this scenario, the market is still developing Wave (II), and Wave C has yet to complete a classic Zigzag correction. If this view proves correct, one more corrective decline may be required before the larger bullish trend resumes.
### What Will Confirm the Correct Scenario?
At this stage, neither scenario has been confirmed.
The key invalidation levels highlighted on the chart, together with future price action and the structure that develops from this point forward, will determine which path the market ultimately follows.
The objective of this analysis is not to predict the future, but to allow market structure to reveal its own direction.
The real question is not simply where price is headed...
**It is: What structure is the market preparing to build?**
*Patterns whisper. I listen.*
— **Mr. Nobody**
CFDs on Crude Oil (WTI)
Jul 14
Reading the Character of the Next Market Cycle
CFDs on Crude Oil (Brent)
Jul 29
Is Wave 3 Beginning, or Is One More Zigzag Still Ahead?
Brent Crude Oil: The Next Big Move? | 4H Breakout & GeopoliticalHello everyone and welcome back to all my TradingView followers! 👋📊
I hope you are all doing great and trading safely. Today, we are taking a closer look at Brent Crude Oil, combining the fundamental and technical perspectives, especially as geopolitical risks in the Middle East continue to influence the energy market. 🌍🛢️
🌍 Fundamental Outlook — Geopolitical Risk at the Center
The oil market remains highly sensitive to developments in the Middle East. Ongoing regional tensions, uncertainty surrounding the future of the conflict, and the lack of clarity around diplomatic negotiations are keeping the risk premium in crude oil elevated.
One of the most important factors is the Strait of Hormuz, a critical energy chokepoint through which a significant share of global oil and LNG trade passes.
Recently, shipping activity through the Strait has slowed considerably, while conflicting statements about its status have increased uncertainty. Iran has insisted that the Strait remains closed, while the U.S. has presented a different position regarding its status.
At the same time, the Bab el-Mandeb Strait and the Red Sea remain exposed to security risks. Attacks and threats against commercial shipping have increased uncertainty for tanker operators and can raise transportation costs, insurance costs and delivery times. However, it is important to note that Bab el-Mandeb should not simply be described as completely closed, as recent reports still show vessels transiting the route.
📈 From a fundamental perspective, any real disruption—or even a significant increase in the probability of disruption—to oil supply and transportation routes can add a geopolitical premium to Brent prices.
As of August 19, 2026, Brent crude was trading around the $91–92 area, reaching a three-week high as uncertainty surrounding oil exports through Hormuz remained a major market concern.
However, supply growth, global demand conditions and producer policies remain important counterweights. Therefore, we should continue to monitor both sides of the supply-demand equation. ⚖️📊
📊 Technical Analysis | 4H Chart
Now let's move to the chart. 👀📈
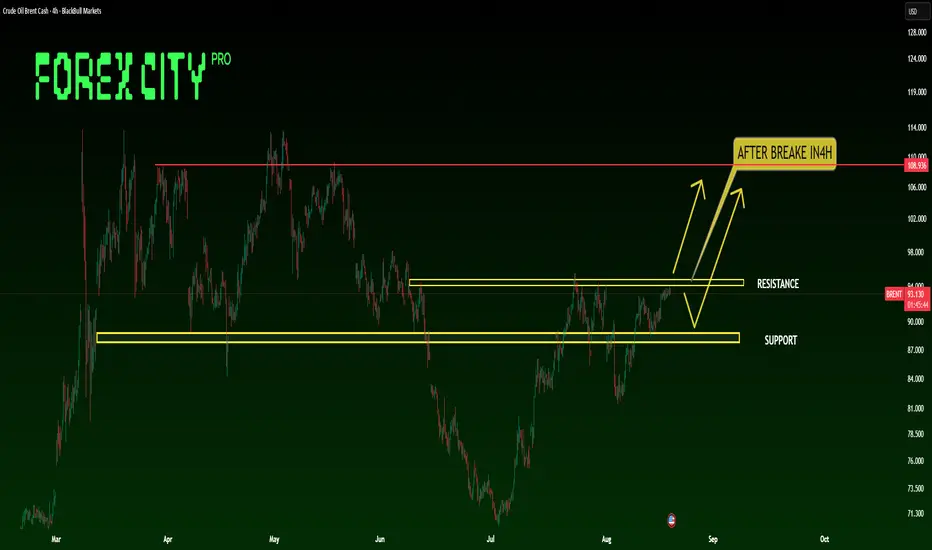
On the 4-hour timeframe, Brent has gradually moved higher and is now approaching the key resistance zone highlighted on the chart.
Price is currently consolidating close to this resistance, and this compression could potentially build the energy for the next significant move. 🔥
🟢 Bullish Scenario
If Brent manages to achieve a confirmed 4H breakout above the marked resistance zone and successfully holds above it, the bullish scenario becomes much more attractive.
In that case, there are two potential ways to approach a Long setup:
🚀 Enter after a confirmed breakout and acceptance above resistance
🔄 Wait for a Pullback toward the broken resistance and look for bullish confirmation
If the breakout is confirmed, higher levels can become potential targets, with the $108–109 area standing out as an important higher resistance zone on the chart.
🔴 Bearish Scenario
On the other hand, if price fails to break the current resistance and sellers regain control, Brent could return toward the marked support zone.
A breakdown below support should therefore also remain part of our risk scenario. 🛡️📉
🎯 Final Thoughts
Fundamentally, Brent remains supported by elevated geopolitical risk in the Middle East, particularly the uncertainty surrounding major energy transportation routes such as the Strait of Hormuz and the Bab el-Mandeb/Red Sea corridor. 🌍🛢️
Technically, price is approaching a critical resistance area on the 4H chart.
🔑 For me, the key trigger is therefore a confirmed breakout and hold above the current resistance zone.
Rather than chasing the market, I prefer to wait for either a confirmed breakout or a successful retest/Pullback before considering a Long position. ⏳📈
In trading, the best trade is not always the first trade.
🗳️ What do you think?
Will Brent break the current resistance zone?
🟢 Bullish 🚀 — Breakout and continuation higher
🟡 Wait & Confirm ⏳ — I want confirmation first
🔴 Bearish 📉 — Resistance holds and price corrects lower
⚠️ Disclaimer
This analysis is provided for educational and informational purposes only and does not constitute financial, investment, or trading advice. 📚⚠️
Oil markets and related financial instruments can be highly volatile and involve significant risk. The scenarios discussed above are based on the current technical and fundamental market structure and may change as new economic, geopolitical, or market-related information becomes available.
Please conduct your own research before making any trading or investment decision. Use proper risk management and position sizing, and never trade with capital you cannot afford to lose. 🛡️📊
Trade responsibly and make your own decisions.
🏷️ Tags
#Brent #BrentOil #CrudeOil #Oil #WTI #Energy #OilTrading #Commodities #CommodityTrading #Geopolitics #MiddleEast #StraitOfHormuz #BabElMandeb #RedSea #TechnicalAnalysis #PriceAction #Breakout #TradingView #Trading #Investing
Brent Crude Oil: Massive Bullish Expansion Toward $140 TargetBrent Crude Oil has confirmed a solid bullish market structure, shifting our macro bias firmly to the upside.
In my previous Oil analysis, I outlined two potential paths. Market price action has now validated Scenario B
With this structural confirmation, the path is now open for an expansion toward the major $140.00 objective.
Drop your thoughts below! 🛢️📈
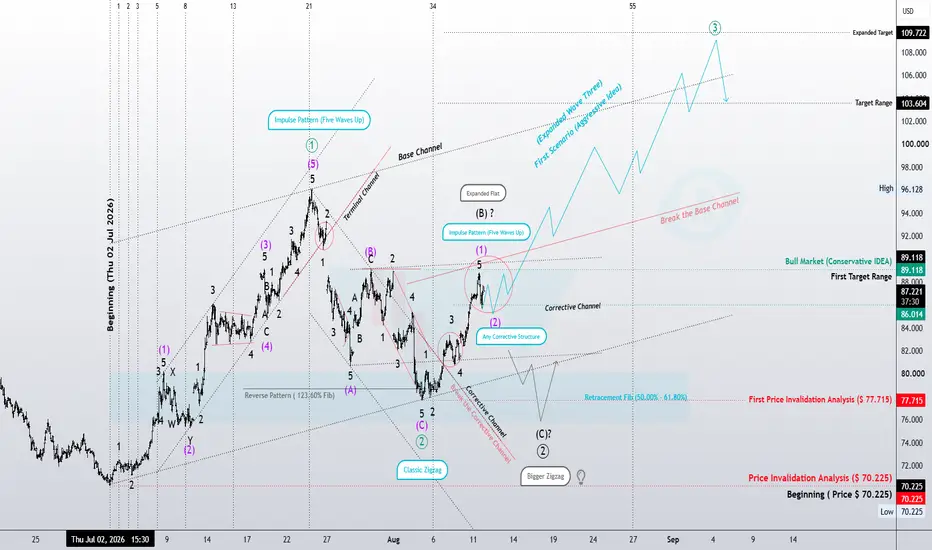
Wave III?Crude Oil: Wave III?
From an Elliott Wave perspective, the move from the 70.225 low to approximately 96.128 appears to have developed as a complete five-wave Impulse, which can be considered Wave (1) of a higher degree.
The market then entered a corrective phase that appears to have completed around the 77–80 area, with the structure remaining consistent with a Classic Zigzag. From this point, the primary focus shifts toward the developing bullish structure.
The recent advance from the corrective low also appears to have formed an internal five-wave Impulse, strengthening the bullish interpretation.
Aggressive Scenario
Under the first scenario, the recent advance may represent Wave (1) of a larger Wave III, with the current correction developing as Wave (2).
If this interpretation is correct, the market could enter an Expanded Wave Three, where Wave III may extend significantly in both price and momentum.
A break above the Base Channel and the relevant structural resistance would provide the first important confirmation of this scenario.
The current extended target is around 109.722.
However, there is another structural possibility.
The market may develop a nested 1-2, 1-2, 1-2 structure across different degrees within this area. Such a development could require more time to complete and may produce several smaller corrective phases before the larger Wave III begins to accelerate.
Conservative Scenario
The second scenario remains valid.
If the current structure fails to break higher and develops into a deeper correction, the market could still be forming a larger Zigzag.
In that case, the current movement would represent only part of a larger correction, meaning Wave (2) would not yet be complete.
Therefore, as long as price remains above the key invalidation levels, the bullish scenario remains favored. However, a break below 77.715 would provide an important warning that the structure may be changing, while a break below 70.225 would seriously challenge the broader bullish interpretation.
Conclusion
At this stage, the aggressive scenario appears more compelling, because the initial advance from the low has developed as a five-wave Impulse and could be the beginning of a larger Wave III.
However, the market may first develop additional nested 1-2 structures, requiring more time before the primary advance accelerates.
The objective is not to predict the market with certainty, but to identify the structures that remain valid and allow price action to confirm or invalidate them.
If the Base Channel breaks and the bullish structure continues to develop, the probability of the aggressive scenario will increase.
Conversely, a break of the key invalidation levels would shift attention toward the conservative scenario and the possibility of a larger Zigzag.
Ultimately, the structure that the market develops from here will determine the correct scenario.
Price comes first; the wave count comes second.
Patterns whisper. I listen.
— Mr. Nobody 🎧📊
CFDs on Crude Oil (Brent)
4 days ago
Is Wave 3 Beginning, or Is One More Correction Still Ahead?
Brent Crude and the Battle Between Two VWAPsBrent crude has spent much of the past month caught between two competing macro narratives. Supply disruption across the Middle East continues to underpin prices, while weaker demand forecasts and slowing global growth have limited the market's ability to sustain rallies.
One of the clearest ways of visualising that tension comes from two Anchored VWAPs, each highlighting where different groups of market participants are beginning to influence price action.
Supply and demand remain at odds
The macro backdrop continues to send mixed messages. On one side, shipping disruption through the Strait of Hormuz, constrained alternative export routes and declining global inventories continue to provide an important floor beneath oil prices. The International Energy Agency estimates that global inventories fell sharply during July, reflecting the logistical disruption created by reduced oil shipments.
Against that sits a very different narrative. Both the IEA and OPEC have lowered their demand expectations as concerns over global growth continue to build, while a surprisingly large increase in US crude inventories has reinforced the view that parts of the market remain well supplied. Many institutions still expect Brent to trade lower into year-end as supply chains gradually normalise and demand softens.
The battle between two VWAPs
One of the more interesting features on the chart comes from two Anchored VWAPs.
The first is anchored to the April high, when Brent's broader decline began. That VWAP now sits close to the $90 area, reinforcing a level that has repeatedly capped recent rallies. Rather than acting as resistance simply because previous highs sit nearby, it also represents the average price paid by traders who bought before the decline gathered pace. As Brent approaches that level, many of those participants are getting close to breakeven, increasing the likelihood of selling pressure as positions are reduced.
The second VWAP is anchored to the July low, where Brent began its recovery. Here the picture is very different. Buyers who entered during that rebound continue to hold profitable positions, and recent pullbacks have repeatedly found support around that average price. Rather than aggressively taking profits, those participants have so far shown a willingness to defend the recovery.
The result is a market caught between two competing groups. One continues to sell strength near the April VWAP, while the other continues to buy weakness around the July VWAP.
Brent Crude Daily Candle Chart
Past performance is not a reliable indicator of future results
What traders should watch next
This creates a useful framework for the sessions ahead. A move above $90 on its own may not be enough to suggest the balance has shifted. What may, potentially, be more important Brent can remain above the April high VWAP after any initial breakout attempt, potentially signalling that buyers are beginning to absorb the supply that has repeatedly emerged around that level.
On the downside, a decisive break beneath the July low VWAP would potentially suggest the buyers who have supported the recovery are beginning to lose conviction. Until one of those groups gives way, Brent may continue to rotate between the two average prices rather than developing a sustained trend.
Brent Crude Four-Hour Candle Chart
Past performance is not a reliable indicator of future results
Disclaimer: This is for information and learning purposes only. The information provided does not constitute investment advice nor take into account the individual financial circumstances or objectives of any investor. Any information that may be provided relating to past performance is not a reliable indicator of future results or performance. Social media channels are not relevant for UK residents.
Spread bets and CFDs are complex instruments and come with a high risk of losing money rapidly due to leverage. 89% of retail investor accounts lose money when trading spread bets and CFDs with this provider. You should consider whether you understand how spread bets and CFDs work and whether you can afford to take the high risk of losing your money.
Crude Oil: Is a Larger Wave III Beginning?From an Elliott Wave perspective, the current structure suggests that Waves I and II of the current degree may be complete, placing the market at a critical stage.
Wave I developed as a five-wave Impulse, followed by Wave II unfolding as a corrective structure. Therefore, under the aggressive scenario, the current structure may be preparing to enter Wave III, which, if confirmed, would be expected to develop with greater strength and momentum than the initial wave.
The initial advance from the recent low appears to have formed a five-wave Impulse. This is one of the main reasons why, at this stage, the aggressive scenario appears more likely.
If the initial invalidation level holds, we would expect price to continue higher and, by breaking above the corrective channel and the nearby structural resistance, provide confirmation that Wave III is developing.
However, the market may also develop a nested 1-2, 1-2, 1-2 structure across different degrees within this area. Such a structure could require more time to complete and may create several smaller corrective phases before the larger Wave III begins to accelerate.
Another possibility is that the initial wave from the recent low is actually part of a larger extended Wave III. If so, the bullish advance could continue with significantly greater strength.
Therefore, the initial invalidation level remains important. As long as it holds, the aggressive scenario remains the more likely interpretation.
However, if the highlighted invalidation levels are broken, the conservative scenario becomes active. Under this interpretation, the current structure may represent part of a larger-degree Wave (II), which, as discussed in my previous Daily Crude Oil analysis, could be unfolding as a Classic Zigzag and may require additional time and price movement to complete.
For those who have followed my previous long-term Crude Oil analysis, this is the same black Conservative Scenario presented in that Daily analysis, and it remains valid until invalidated.
At the end of this analysis, I have shared both scenarios together so that the market can determine which structure is actually developing. I have also included my previous Daily Crude Oil analysis for additional context.
At this stage, there is no need to force either scenario onto the market.
Ultimately, it will be the structure that the market develops from here that determines the correct scenario.
Price comes first; the wave count comes second.
Patterns whisper. I listen.
— Mr. Nobody 🎧📊
CFDs on Crude Oil (Brent)
Jul 29
Is Wave 3 Beginning, or Is One More Zigzag Still Ahead?
4 days ago
Is Wave 3 Beginning, or Is One More Correction Still Ahead?
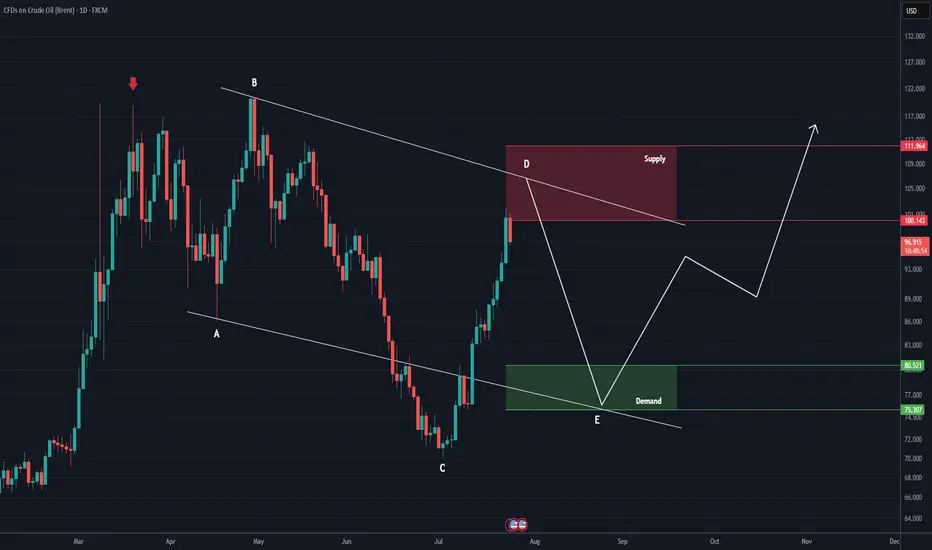
Brent crude oil is likely to undergo a correction (1D)Since we placed the red arrow on the chart, Brent crude oil has entered a corrective phase.
The correction appears to be forming a triangle, and Wave D now looks complete. Wave D was bullish.
Wave E now appears to be underway, and in this triangle, Wave E is expected to be bearish.
From the green zone, Brent crude oil could turn bullish again.
Let's see how it develops. For now, this is our preferred scenario.
If you have a coin or altcoin you want analyzed, first hit the like button and then comment its name so I can review it for you.
Do you also think Brent crude oil is bullish?
Oil: The 42% Rally May Be Only the BeginningIn previous analyses, the highlighted percentage-based zones were discussed in detail. The $70 area, identified as the primary origin of the expected move, was reached as anticipated. At the time, I noted that this level could become the starting point of a major bullish cycle while also reflecting the continuation of geopolitical tensions in the Middle East. So far, that scenario has unfolded as expected.
Following an advance of approximately **42%**, the next major objective remains the **$100** region.
From a structural perspective, I believe the previous major high is likely to be taken in the coming phase. However, whether that occurs during the current impulsive leg or after an intermediate correction remains to be confirmed by future price action.
As always, the market will determine the timing, while structure and behavior remain the primary guide.
Brent crude oil Wave Analysis – 17 August 2026– Brent broke resistance zone
– Likely to rise to resistance level 95.00
Brent crude oil today broke the resistance zone between the resistance level 88.80 (top of the previous minor correction b) and the 61.8% Fibonacci correction of the downward ABC correction 2.
The breakout of this resistance zone is likely to accelerate the active short-term impulse wave 3 from the start of August.
Brent crude oil can be expected to rise further to the next resistance level 95.00 – which stopped the previous impulse wave 1 in July.
OIL IS WAITING FOR THE STRONGEST COLLAPSE IN THE LAST 4 YEARS !!📣 Hello everyone!
I think that a difficult time is coming for oil, my goal in 2025 is $ 36-40 per barrel of Brent
That's all for today, I wish you good luck in making independent trading decisions and profit. Please analyze the information received from me, always think only with your head!
Goodbye! ✊
Could Hormuz Become the Strait of Trump? Speaking on Friday, President Donald Trump said the Strait of Hormuz could soon become U.S. territory. Obviously speculating that it would be called "the Strait of Trump" is a little in jest, but we all know how much he loves to slap his name on things.
“Pretty soon, I’ll be declaring the Hormuz Strait a territory of the United States,” Trump said, while urging Americans to accept higher gasoline prices amid the conflict.
Iran rejected the claim, maintaining that the Strait “has been Iranian, is Iranian, and will remain Iranian,”.
The rhetoric comes as Treasury Secretary Scott Bessent said the U.S. is preparing economic measures against Iran “that have never been seen,”.
Bessent has not revealed exactly what those measures will involve, but Reuters reports that the options could target Chinese refiners buying Iranian crude and Chinese banks processing Iranian transactions.
Review and plan for 17th August 2026 Nifty future and banknifty future analysis and intraday plan.
Results - Bdl, alkemlab
This video is for information/education purpose only. you are 100% responsible for any actions you take by reading/viewing this post.
please consult your financial advisor before taking any action.
----Vinaykumar hiremath, CMT
Brent Outlook | 17–21 Aug 2026 Last Week Recap
Brent rose sharply over the past week, mainly supported by heightened tensions between the U.S. and Iran after ceasefire negotiations failed to make meaningful progress. Risks to oil transportation through the Strait of Hormuz also increased following attacks on oil tankers, while the U.S. signaled that it could maintain maritime restrictions on Iran, raising concerns over oil supply from the Middle East.
By the end of the week, Brent closed around $90.85/barrel. Prices remained supported by a Geopolitical Premium, although upside pressure was partly offset by a significant increase in U.S. Crude Inventories and expectations of slower global oil demand.
Fundamental Analysis | 17–21 AUG 2026
Brent is expected to trade Sideway to Bullish this week, with the key driver remaining Supply Risk from the Middle East, particularly developments surrounding the Strait of Hormuz. If negotiations between the U.S. and Iran fail to make progress or further incidents disrupt oil transportation, the market could price in a higher Risk Premium, potentially supporting further gains in Brent.
However, Brent's upside remains limited by a significant increase in U.S. Crude Inventories, along with weaker expectations for Global Oil Demand. If supply-side risks begin to ease, Brent could face increased Take Profit pressure.
Overall, Brent maintains a positive bias, but the current uptrend is largely driven by Geopolitical Risk, meaning prices could experience high volatility and sharp reversals depending on developments surrounding Iran and the Strait of Hormuz.
Technical Analysis — BRENT 4H
BRENT remains Sideway to Bullish, with the short-term structure still in an uptrend and the price holding above the 90.12 support level. If the price breaks above 91.45 and 92.60, it could continue higher toward the 94.10 target. Conversely, a break below 90.12 could lead to a pullback toward the next support at 88.70.
Bias: Sideway to Bullish
Resistance: 91.45 / 92.60 / 94.10
Support: 90.12 / 88.70
Target: 94.10
Cut Loss: Below 88.70
Brent Targets $90 Again as Hormuz Deal FaltersBrent crude oil continues to recover after its recent decline. On August 11, prices rose to $88.90 per barrel , with the benchmark gaining around 5% over the past two days. The main driver was the deteriorating outlook for a potential U.S.-Iran agreement over the Strait of Hormuz.
At the beginning of August, oil prices were falling amid expectations of a possible deal and a gradual restoration of shipping through the strait. The situation has now changed: renewed disagreements between the two sides have increased the risk of a prolonged standoff and further supply disruptions.
Factors Supporting Brent:
Negotiations have reached an impasse . New U.S. demands on Iran have reduced the chances of a quick agreement. The market is once again pricing in the risk that full tanker traffic through the Strait of Hormuz will not be restored soon.
Shipments through Hormuz remain limited . Only six vessels passed through the strait on Monday, compared with an average of around eleven over the previous ten days. Oil exports through the route fell to approximately 3 million barrels per day, down from 4.4 million barrels a week earlier.
Risks are also rising in the Red Sea . Houthi attacks continue to threaten alternative routes through Bab el-Mandeb. Disruptions on two major shipping routes simultaneously increase transportation costs and raise concerns about the stability of global oil supplies.
For the oil market, the $90 level has become an important psychological threshold. A sustained break above it could strengthen expectations of further gains, particularly if negotiations fail to resume or new supply disruptions emerge.
At the same time, higher oil prices pose risks beyond the commodity market. Rising energy costs could once again increase inflationary pressure and influence expectations for the Federal Reserve's interest-rate policy.
According to FreshForex analysts , the current base-case scenario for Brent remains bullish. As long as negotiations over the Strait of Hormuz show no progress and supply disruption risks persist, oil prices are likely to remain supported. If geopolitical tensions continue, Brent could move higher and establish itself above $90 per barrel.
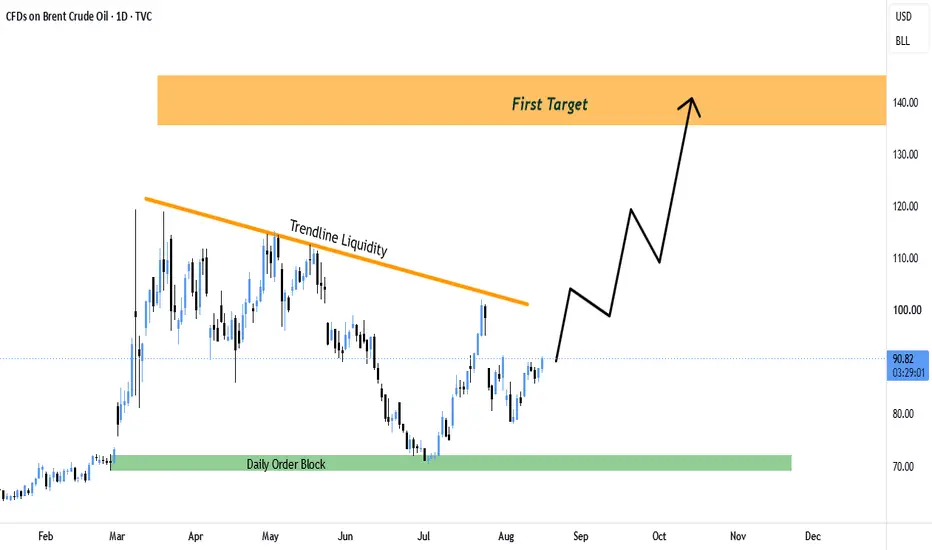
UKOIL Macro: Bullish Wave Targeting New HighsHello Traders,
Today we are analyzing the macro structure of UKOIL (Brent Crude) on the daily timeframe.
🔍 Higher-Timeframe (HTF) Context:
• Sell-Side Liquidity (SSL) Hunt:
During the first half of the year, UKOIL engineered a highly visible trendline liquidity pool. Recently, the market completed a decisive sweep of this Trendline Liquidity, purging retail sell-stops and capturing deep liquidity.
• Mitigation of HTF Demand:
Following the sweep, the price tapped directly into the high-timeframe Discount Demand Zone ($68.00 - $72.00). This zone acted as a major institutional accumulation block.
• Displacement:
The aggressive rally from the demand zone up to the current ~$91 level confirms strong institutional buying pressure and a medium-term shift in market structure.
🚀 Two Primary Scenarios:
We have mapped two high-probability paths toward our macro targets:
• Scenario A (Direct Expansion):
The current bullish momentum continues with immediate expansion, bypassing any deep corrective pullbacks, to target the premium liquidity pools.
• Scenario B (Deep Retracement):
Price performs a corrective pullback to mitigate local discount arrays (newly formed Fair Value Gaps / Order Blocks) near the HTF Demand level before launching the primary macro expansion wave.
📍 Key Technical Levels:
• First Target Area: $130.54 – $147.42
• Invalidation Level: A daily close below $65.00 invalidates this macro bullish thesis, signifying a structural failure.
What are your thoughts on Brent Crude? Share your views in the comments!