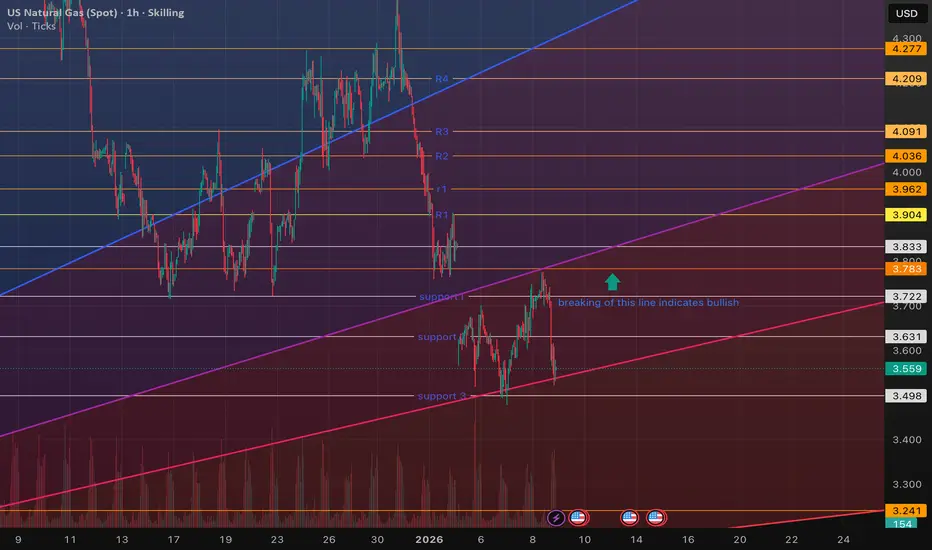
NATURAL GAS - REVERSAL FROM STRONG SUPPORT + TRENDLINE BREAKOUTNatural Gas is showing a bullish reversal structure after holding a major support zone around $3.04–3.05
📌 Entry: Above $3.15–3.16 after a confirmed breakout and sustain above the descending trendline.
🎯 Target 1: $3.34–3.40
🎯 Target 2: $3.54
🛡️ Stop Loss: Below $3.07
⚠️ Major Support: $3.04–3.05
Setup Logic
Major support → base formation → descending trendline breakout → upside resistance zones
The key confirmation is a 1H candle closing above the trendline, ideally followed by a hold/ret
In-depth trading ideas
Natural Gas (NATGAS/XNGUSD) – 1H Chart | Inverse Head & ShoulderNatural Gas (NATGAS/XNGUSD) – 1H Chart | Inverse Head & Shoulders Breakout
Instrument: Natural Gas (XNGUSD) — Capital.com
Timeframe: 1 Hour
Date: Sep 22, 2026, 22:30 UTC+5:30
CMP: $3.1085
Pattern Identified: Inverse (Bullish) Head & Shoulders
A textbook Inverse Head and Shoulders reversal pattern has formed on the 1H chart, signaling a potential trend reversal from the recent downtrend to the upside.
Structure Level Notes
Left Shoulder ~2.955 Formed early Sep 3–4, followed by a
Natural Gas LongI favour a tactical long in Natural Gas at ~$2.88–2.90, targeting $2.93–2.94.
The setup is attractive primarily because price is sitting at a clearly defined technical demand zone, while the macro environment is beginning to provide asymmetric upside through LNG demand and geopolitical energy disruption.However, this is not a structural bullish call. U.S. gas fundamentals remain well supplied, with EIA forecasting October inventories 5% above the five-year average and U.S. production at record
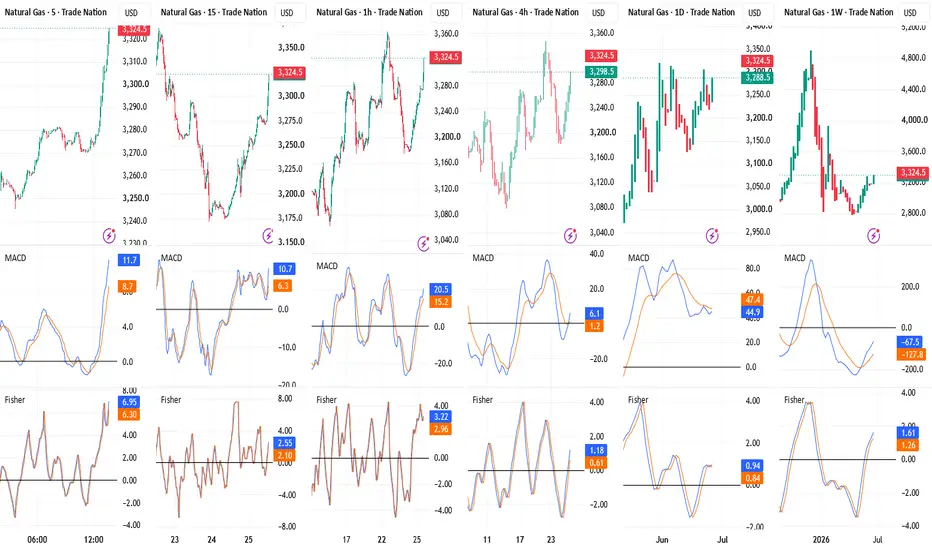
Extremely BULLISH NATURAL GAS after crossing 3.35 levelNatural Gas is showing Bullish Signal.
Bullish Inverted H & S is appearing on 1W Chart which will go for Long Term of Months.
On 1D Chart patterns,two Bullish patterns are developing
1) Inverted H & S (Confirmation will be once price cross 3.34/3.35 mark)
2) Higher Low with 4th Top (looks like inverted H&S but since it is appearing on Top, we may not call it inverted H&S as is the case in 1W Chart (which is appearing at Bottom.
Once the price takes out Resistance, price will run very fast and
NG Changed its course, 4H H&S pattern failed. Now BUYYesterday, a Head & Shoulder pattern was visible on 4H Chart. I wrote that once neckline is broken, initiate a Short (@ 3.17 price. But it did not happen.
Instead, just opposite has happened and price has moved above Shoulder (Left/Right).
This change of event has forced me to write that never initiate a trade before confirmation.
Support Break as stated by me was NECKLINE BREAK (which did not happen)
Now a long (BUY) after shoulder crossover is triggered.
Natural Gas (NG) - 4Hour Head and Shoulder Pattern On 4H Chart, a dangerous Chart formation (Bearish) called Head & Shoulder pattern emerged. Right Shoulder process is going on. If price falls below neckline from right shoulder, it will be extremely bearish.
But wait for break down (Price 3.16) for confirmed entry on bearish side.
Minimum target = 3.17 - (Top @3.35 -neckline @3.17)= 3.16- 0.18 = Slightly Below 3.0 Support after neckline break.
Natural Gas | Bullish Setup | 4h TimeframeNatural Gas XNGUSD 🚀 Bullish Setup from Reversal Zone
Natural Gas is currently showing a strong bullish recovery structure on the 4H chart. 📈
Price has respected the lower reversal zone and started moving upward with higher highs and higher lows. The latest red trendline is acting as the current bullish projection path, showing that if price continues holding above the support/reversal area, the next upside targets can remain active.
The long position setup updated on 23/05/2026 is based on th
Natural Gas: Recovery Structure Testing Pivot AcceptanceNatural Gas continues showing recovery behaviour from higher timeframe support and is currently testing a key pivot region.
Structural Observation
• Recovery Structure → Re-Expansion Attempt
• Reaction from major support (~2.50)
• Testing structural pivot acceptance (~2.90–3.05)
Behaviour Observation
• Higher low formation developing
• Pivot acceptance under observation
• Recovery remains active
Educational Layer
Recovery structures can initially appear impulsive but may also evolve int
Natural Gas is currently reacting from a key higher timeframe🔍 Key Observations:
• Price has tapped into a strong demand / reversal zone near 2.65–2.75
• Liquidity below previous lows appears to be taken
• Early signs of bullish reaction visible from the zone
📈 SMC Perspective:
This move looks like a classic liquidity grab followed by a potential displacement.
If price sustains above this zone, we may see continuation towards higher liquidity levels.
🎯 Expected Move:
• Upside targets projected towards 3.20 – 3.60 range
• Expansion phase possible if stru
Natural Gas (XNGUSD) | Daily | 24 Mar 2026Structure: Range / Distribution
Location: Upper Range
Supply: 5.00 – 5.27
Pivot: 3.00 – 3.20
Demand: 1.60 – 2.00
Behaviour:
Rejection near supply, rotational behaviour continues.
Invalidation:
Acceptance above supply zone
Continuation:
Rotation within range between defined zones
This analysis is for educational purposes and reflects structural market observation.
Structure → Level → Trigger → Probability
#MarketStructure #StructuralAnalysis #NaturalGas
X
Natural gas have never closed below the 2.8 mark line on weekly bases from last 16 month will be interesting to see this month if manages to hold 2.8 on closing bases can see fresh buying power emerging that can move price higher back towards previous swing high levels . strucure to consider fail if weekly/monthly sart closing below yellow support mine .
XNGUSD — Bottom or Reaction? Structure FirstNatural Gas has reacted sharply from a high-confluence support zone, but structure remains corrective, not impulsive.
What just happened:
• Price tagged the 0.707–0.786 retracement (2.67–2.38)
• Confluence with rising trendline
• Immediate rejection → active demand confirmed
What this means:
✔️ Valid support reaction
❌ Not a confirmed bottom yet
Bottoms are zones, not points.
Key Levels
Support:
🔹 2.35 – 2.70 → structural demand
Loss below this weakens structure
Pivot:
🔹 3.00 – 3.10 → recl
X
XNG outlookBreak of structure of internal highs , Monthly demand has been tapped . Also , price has tapped into the higher time frame discounted zone from the fibonacci retracement tool
trade idea gives a 3.7 RRR , good zone to go long
XLong
Natural Gas (XNGUSD) AnalysisNatural Gas (XNGUSD) Analysis
On the daily chart, NG witnessed an aggressive sell-off from the highs made during early November
Although prices are now testing a long-term support base (blue ascending trendline) and have failed to close below the trendline.
A Classic Bullish Divergence has also been formed (Prices: Lower lows & RSI: Higher lows => brown boxes)
Also, RSI has started rising higher froma deep oversold zone (<30)
------------------------------------------------------------------