NATGAS — Don’t Be Too Quick to Call the End of the TrendNatural gas is maintaining its bullish structure, with price recovering after testing the lower boundary of the channel. The decline from late September’s high slowed upward momentum, but it has not broken the support guiding the trend.
Fundamentally, U.S. gas demand forecasts for the next two weeks have been revised higher, while production has declined following a pipeline disruption in Kentucky. Gas flows to Freeport LNG are also expected to recover, supporting demand for gas used in exports
In-depth trading ideas
Hedge funds net short confirmed - sharp down move expectedA large Singaporean hedge fund that trades mainly commodities is heavily shorting natural gas (unable to give out name). This should give our short trade some momentum starting today.
As per my last update:
Non-commercials added 24755 short positions over the past 2 weeks and decreased long positions by -13718. This is a big move, and you should pay close attention as big moves like these don't happen often.
Expecting natural gas to go down steeply this week (October 5 - 10).
The target is
Natural gas hits nPOC at 3.08 - sharp down more likely from hereSo nautral gas decided to go up to grab liquidity. This does not change the bearish outlook on natgas.
The price has now hit the quarterly POC at 3.08.
Hedge funds still remain net short on natgas, whereas retail traders are more bullish. Producers are also net short as there is too much inventory and they need to hedge against the El Nino that is set to strike within the next few months.
Expecting a sharp downturn from here. Tight SL at $3.1
NATGAS: Bearish Continuation is Expected! Here is Why:
It is essential that we apply multitimeframe technical analysis and there is no better example of why that is the case than the current NATGAS chart which, if analyzed properly, clearly points in the downward direction.
Disclosure: I am part of Trade Nation's Influencer program and receive a monthly fee for using their TradingView charts in my analysis.
❤️ Please, support our work with like & comment! ❤️
NATGAS Massive Short! SELL!
My dear friends,
Please, find my technical outlook for NATGAS below:
The price is coiling around a solid key level - 3.1681
Bias - Bearish
Technical Indicators: Pivot Points Low anticipates a potential price reversal.
Super trend shows a clear sell, giving a perfect indicators' convergence.
Goal - 3.0838
About Used Indicators:
The pivot point itself is simply the average of the high, low and closing prices from the previous trading day.
Disclosure: I am part of Trade Nation's Influencer
Natural Gas 4H: Major Supply Zone AheadNatural Gas has pushed decisively above $2.988 resistance, a level that capped price through much of September. The breakout follows a strong rebound from $2.808 support, strengthening the short-term market structure as price advances toward higher resistance.
$2.988 Becomes Key Support
The former $2.988 resistance now becomes an important support level. With Natural Gas trading around $3.154, any pullback toward this area would test whether buyers can successfully defend the recent breakout.
NATURALGAS: Upside Toward 3.40 Remains IntactNATURALGAS, 4H: Price has held above 3.14, keeping the bullish scenario intact with 3.40 as the next target.
MACD supports the upside momentum, while Stoch RSI signals short-term overbought conditions. A retest and hold of 3.14, or a confirmed break above 3.25, would offer the cleaner long setup.
- Long: Hold above 3.14 or breakout above 3.25.
- Target: 3.40.
- Scenario invalidation: A close below 3.14 would shift focus to 3.00–2.92.
U.S. gas inventories are 79 Bcf above the five-year average
Natural Gas at Major Demand — Is a Strong Rebound About to BeginEntry: 2.696
TP1: 2.773
TP2: 2.921
TP3: 3.287
Stop Loss: 2.604
Natural Gas is testing a well-established daily demand zone, while RSI is approaching oversold territory. Broader gas markets are also receiving support from renewed supply concerns linked to Middle East tensions and QatarEnergy’s extended force majeure for European buyers.
The combination of technical support and improving fundamental sentiment creates the potential for a rebound from current levels.
Natural gas - more downside to come in short termThe context of the moves is key here. Technicals need to be analysed along with COT analysis and quantitative data.
Non-commercials added 24755 short positions for natural gas over the past 2 weeks and decreased long positions by -13718. This is a big move, and you should pay close attention as big moves like these don't happen often.
In the next few days/weeks, natural gas should go down by 8-10%, and the market will likely find a mid term bottom.
NATGAS: Bearish Forecast & Outlook
The recent price action on the NATGAS pair was keeping me on the fence, however, my bias is slowly but surely changing into the bearish one and I think we will see the price go down.
Disclosure: I am part of Trade Nation's Influencer program and receive a monthly fee for using their TradingView charts in my analysis.
❤️ Please, support our work with like & comment! ❤️
NATURALGAS 1H: Buyers Defend 3.40 as Momentum SlowsNATURALGAS remains in a 1H uptrend. After reaching 3.45, price pulled back and held above former resistance near 3.40. On the chart, price is around 3.43, above the 9 EMA and the longer moving averages.
RSI remains near 66, while MACD is above zero but its histogram has turned slightly negative. The trend is still bullish, though upside momentum has slowed. Buyers now need to clear the recent high near 3.45.
Conditional Long Setup: Pullback
There is no confirmed entry at the current price. Wai
Natural Gas: Bullish Alligator Expansion & Structure ReclaimNatural Gas (XNGUSD) is showing strong bullish momentum recovery on the 1-Hour chart following a clean structural bottom around $2.94.
Key Technical Factors:
Williams Alligator Confirmation: The Alligator lines (Lips, Teeth, Jaw) have crossed upward and are fanning out below price, confirming an active bullish trend expansion.
Market Structure Reclaim: Price swept local sell-side liquidity near $2.9430 and has reclaimed higher structure above $3.15.
RSI Momentum: RSI (14) is sitting healthy
Natural Gas Spot - correction potential for more downsideNatural Gas Spot should soon be forming a correction for more downside, potentially.
Should this be the case, we will follow this commodity in its correction all the way until it's end - presumably it should take a whole week) and then we'll get ready to exploit the downside move potential, with a target this time all the way to the .618 extension of the previous downside impulse (arrows in yellow). Naturally, we will publish this again with updated and more correct levels, depending on when and
Natural Gas Wave Analysis – 28 September 2026– Natural Gas reversed from resistance level 3.400
– Likely to fall to support level 3.000
Natural Gas recently reversed down from the resistance zone located at the intersection of the resistance level 3.400 (which previously stopped major price advances in March and June) and the 50.0% Fibonacci correction level of the downward impulse from January.
The downward reversal from this resistance zone stopped wave iii of the sharp impulse wave C from August.
Given the strength of the 3.400 resis
NATGAS Trading Opportunity! SELL!
My dear followers,
I analysed this chart on NATGAS and concluded the following:
The market is trading on 3.311 pivot level.
Bias - Bearish
Technical Indicators: Both Super Trend & Pivot HL indicate a highly probable Bearish continuation.
Target - 3.199
About Used Indicators:
A super-trend indicator is plotted on either above or below the closing price to signal a buy or sell. The indicator changes color, based on whether or not you should be buying. If the super-trend indicator moves be
Liquified Natural Gas, Swing Trade Simple Idea. A bullish divergence is forming between the MACD and price action. At the same time, price has bounced from the same support level while showing increasing bullish momentum. This setup coincides with the end of the summer season, while ongoing gas supply disruptions in the Middle East could provide additional support for LNG prices.
Together, these factors create a potential bullish setup for LNG in the next cycle.
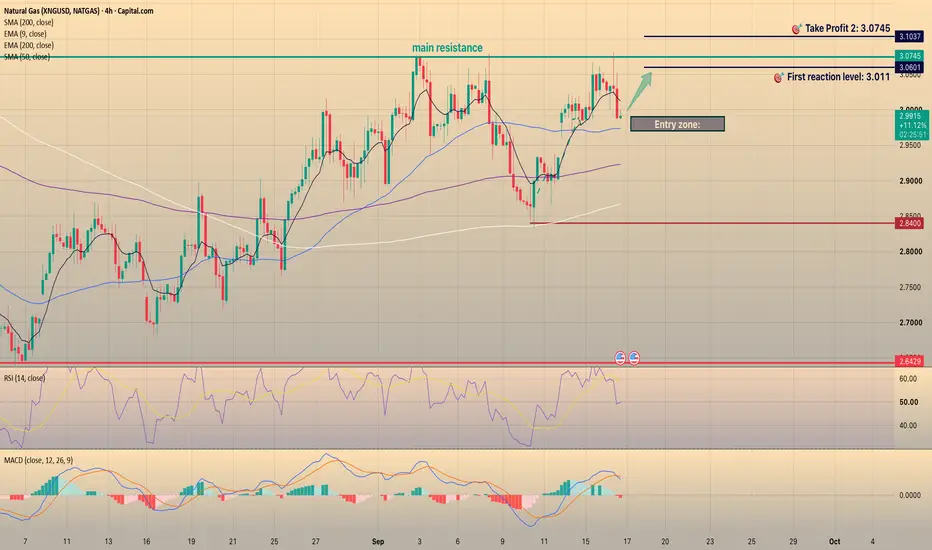
Natural Gas Conditional Long Setup: Pullback Support Near 2.97Natural gas remains supported by warm September weather and power-sector demand, but high inventories still limit upside. The EIA expects U.S. gas storage to enter winter above the five-year average, which keeps the market cautious.
Natural Gas rejected from the main resistance at 3.0745 and pulled back toward 2.99. Price is still holding above SMA 50 near 2.97 and EMA 200 near 2.92, so the 4H recovery structure remains valid as long as support holds.
However, price is still below EMA 9 near 3
XNGUSD: The Market Is Selling Fear, Not GasEuropean TTF gas prices fell around 7% as markets reacted to diplomatic signals around Iran, rising flows through Hormuz, and forecasts for warmer weather in Northwest Europe — all of which could reduce near-term gas demand.
The chart, however, shows XNGUSD, a U.S. natural-gas CFD, not European TTF. The headline explains a broader unwind in the gas risk premium, but it is not a direct price feed for this instrument.
Sentiment and FOMO
The market had been buying more than gas — it was buying
NATGAS: Bearish Continuation & Short Trade
NATGAS
- Classic bearish setup
- Our team expects bearish continuation
SUGGESTED TRADE:
Swing Trade
Short NATGAS
Entry Point - 3.023
Stop Loss - 3.038
Take Profit - 2.997
Our Risk - 1%
Start protection of your profits from lower levels
Disclosure: I am part of Trade Nation's Influencer program and receive a monthly fee for using their TradingView charts in my analysis.
❤️ Please, support our work with like & comment! ❤️