Silver (XAG) Analysis: Final Push Higher Before ReversalSilver (XAG) continues to follow our Elliott Wave outlook after completing the wave ((iv)) pullback at 60.8514. Buyers have driven the metal higher into the final five-wave advance in wave ((v)). The corrective rally is now entering its final stage. Although the short-term trend remains bullish, the Elliott Wave structure points to limited upside. We expect sellers to return once price reaches key Fibonacci resistance.
The 60-minute Elliott Wave chart shows Silver advancing in wave ((v)) of red wave C, which forms part of a larger wave (B) Flat correction. Fifth waves often extend toward the 1.236–1.618 Fibonacci external retracement of wave ((iv)). That gives an initial target between 63.42 and 64.24. Silver has already reached the 100% Fibonacci extension of wave A. However, buyers could still push prices toward the 161.8% Fibonacci extension near 67.00 before the rally ends.
Our Silver Elliott Wave forecast points to the 62.00–67.00 area as the next major resistance zone. We expect the current bounce to finish within the next 24 hours. After that, sellers should regain control and resume the larger bearish trend.
Overall, Silver remains bullish in the very short term while wave ((v)) continues to develop. Traders should avoid chasing prices into the earlier mentioned resistance zone. Instead, they should watch for signs of exhaustion before positioning for the next move lower.
In-depth trading ideas
XAGUSD at a Critical Triangle Apex – Breakout or Breakdown Ahead
Silver (XAGUSD) is trading within a large symmetrical triangle pattern on the 1-hour timeframe, signaling a period of consolidation before a potentially strong directional move. Price recently faced rejection near the upper trendline resistance, while the lower ascending support remains the key level keeping bulls in control.
A confirmed candle close above the triangle resistance would indicate bullish continuation, opening the door for a momentum-driven rally as buyers regain dominance. On the other hand, a break below the lower trendline would invalidate the bullish structure and could trigger an accelerated sell-off.
Volume confirmation will be essential, as triangle breakouts without participation often result in false moves. Traders should remain patient and wait for confirmation rather than anticipating the breakout prematurely.
The market is approaching the apex of the pattern, suggesting that volatility is likely to increase in the coming sessions. The next confirmed breakout will likely determine the short-term direction of XAGUSD.
Silver XAG/USD – Liquidity Sweep & Key ZonesThis 1H Silver chart highlights critical trading levels with clear supply and demand zones. Price action shows a liquidity sweep near 56.96, signaling potential accumulation. The red resistance zone (60.10–61.80) marks overhead supply, while the green demand zone (56.96–59.50) provides strong support. Traders can watch for reactions at these levels to anticipate breakout or reversal setups.
XAGUSD (Silver): Signals Potential Rally Toward Supply Zone
Silver is showing early signs of strength after defending the 4H Order Block around 57.05 while maintaining its ascending trendline structure. The presence of a bullish RSI divergence suggests that bearish momentum is fading, increasing the probability of an upside move.
Price is currently consolidating below the 58.50 resistance area. A successful breakout and hold above this level could trigger further buying pressure, opening the path toward the 59.80–60.00 supply zone. As long as the 4H Order Block remains intact, the broader bias remains bullish.
Key Confluences:
Bullish RSI Divergence
4H Order Block Support
Rising Trendline Structure
Potential Breakout Above 58.50
Supply Zone Target at 59.80+
Trading Outlook: Bulls remain in control above 57.05. A confirmed move above recent highs may lead to an impulsive rally into the higher-timeframe supply zone, while a break below the Order Block would invalidate the bullish setup.
Silver Price Rejected at Resistance – Bearish OutlookSilver is facing repeated rejection from the 58.00–58.50 resistance zone, where sellers continue to dominate. The recent bounce failed to sustain above this area, keeping the short-term bearish structure intact.
Key Levels:
Resistance: 58.00–58.50
Support: 56.80–57.00
Next Support: 55.00-55.60
As long as Silver trades below 58.00–58.50, the downside bias remains valid. A sustained break below 56.80 could lead to a move towards 55.60, followed by the 55.00–55.30 support zone.
XAGUSD: Bullish Harmonic Setup Signals Potential Recovery
Silver (XAGUSD) is currently trading inside a key demand zone after completing a harmonic structure near the D-point, suggesting that bearish momentum may be losing strength. Price has repeatedly defended this support area, indicating the presence of buyers despite recent downside pressure.
The chart also highlights a previous change in market structure and a Golden Cross, which continue to support a broader bullish outlook. As long as the current support region remains intact, the market may attempt a rebound toward the nearest resistance zone, where a break could confirm a stronger upside continuation.
From a technical perspective, the confluence of support, harmonic completion, and structure shifts makes this an important area to watch. Traders should remain patient and wait for confirmation before anticipating the next impulsive move, as volatility around these levels could lead to short-term fluctuations.
XAGUSD breaks below a symmetrical triangleXAGUSD just broke below a symmetrical triangle pattern. This type of pattern forms when price creates a series of lower highs and higher lows, causing the market to compress between two converging trendlines.
This kind of formation reflects a period of indecision, where buyers and sellers are fighting for control. As the range becomes tighter, pressure builds and increases the probability of a strong breakout.
By itself, the symmetrical triangle is a neutral pattern, but context matters A LOT. In this case, price failed to maintain momentum near the upper boundary and eventually broke below the lower trendline. This downside breakout suggests that sellers are beginning to take control and the previous balance has shifted in favor of the bears.
For the projection, the traditional approach is to measure the height of the triangle’s widest point and project it from the breakout area. However, price does not always reach the full theoretical target. In this setup, I would focus on the 56.00 zone as a more realistic downside objective.
Silver BOS & NPF Volatility SetupXAG/USD has printed a clear Break of Structure (BOS) on the daily chart, shifting momentum toward sell-side liquidity. Price is trading inside premium zones, with liquidity pools resting near 61.969 and 54.845. Under ICT principles, this sets up displacement and mitigation opportunities as the market hunts liquidity. The upcoming Non-Farm Payroll (NPF) release is expected to act as a high-impact catalyst, potentially accelerating volatility and confirming directional bias. Traders should monitor order flow around key levels, as NPF-driven USD strength could align with the bearish structure, while any surprise data may trigger sharp reversals.
Silver : Bulls are taking Reign of UptrendSilver is about to reverse it's LH, LL to HH, HL means from downtrend to uptrend.
at this level 60$ Silver is showing strength to go Upside, Above 63$ whole setup will be changed to bullish.
A Double Bottom will send Silver into a triangle pattern and may show a very sharp rally.
so My thought is that these levels are good to buy Gold with stoploss of 56$ .
Be careful about investment / trading.
But if you are in control of fear and greed then ask your financial advisor for stoploss to protect your hard earned money.
It is my point of view solely for informative purpose only.
(In Trading Time it may go above/below stoploss But closing price is most important).
These are levels are generated on the basis on Fibonacci Series
NOTE : I am not SEBI registered advisor in capital market.
Disclaimer:- Please always do your own analysis or consult with your financial advisor before taking any kind of trades. Please understand Risk in trading before taking any trade with your financial consult. I am only sharing my knowledge it may be right or sometimes wrong so I am not liable for any loss.
Dear traders, If you like my work then do not forget to hit like and follow me, and guy's let me know what do you think about this idea in comment box, i would be love to reply all of you guy's.
Thank you.
XAGUSD: Bearish Rejection Signals Hint at a Potential Pullback
Silver is currently testing a significant resistance area where multiple technical factors are coming together. The descending trendline is acting as dynamic resistance, while the supply zone adds further selling pressure.
The recent price action shows rejection near the upper structure, suggesting buyers are struggling to push higher. The Fibonacci retracement area also provides additional confluence for the bearish setup, making this region important for a potential reversal.
If price fails to break and hold above the resistance zone, sellers could regain control and drive Silver lower toward the marked support area. A confirmed bearish candle or lower-timeframe rejection would strengthen the short setup.
The support zone is the key area to watch on the downside. If it holds, a bounce/recovery could develop. However, a clean breakdown below support could open the door for a deeper bearish continuation.
Bearish bias remains valid while price stays below the major resistance and descending trendline.
XAGUSD (4H) – Bearish Continuation Pattern & Key Retest SetupSilver (XAGUSD) 4-Hour Technical Analysis 🥈📉
On the 4-hour chart, XAGUSD is currently trading inside a clear descending channel structure following a major drop from the 71.475 peak. Price recently reacted from the upper boundary of this channel and is showing signs of bearish continuation.
Key Technical Highlights:
Descending Channel: Price continues to form lower highs and lower lows within a well-defined downward channel.
Fibonacci Retracement: The recent pullback aligned with internal correction levels, rejecting near the upper trendline resistance.
Bearish Structure: The current price action indicates a minor bounce/retest followed by a expansion toward lower key support zones.
Target Support Zone: Expecting price to push down toward the 54.710 area to sweep liquidity near the previous low levels.
🎯 Key Levels to Watch:
Immediate Resistance: Upper Channel Boundary (~$60.00)
Main Target / Support Area: $54.710
⚠️ Disclaimer: This analysis is provided for educational purposes only. Always manage your risk according to your strategy
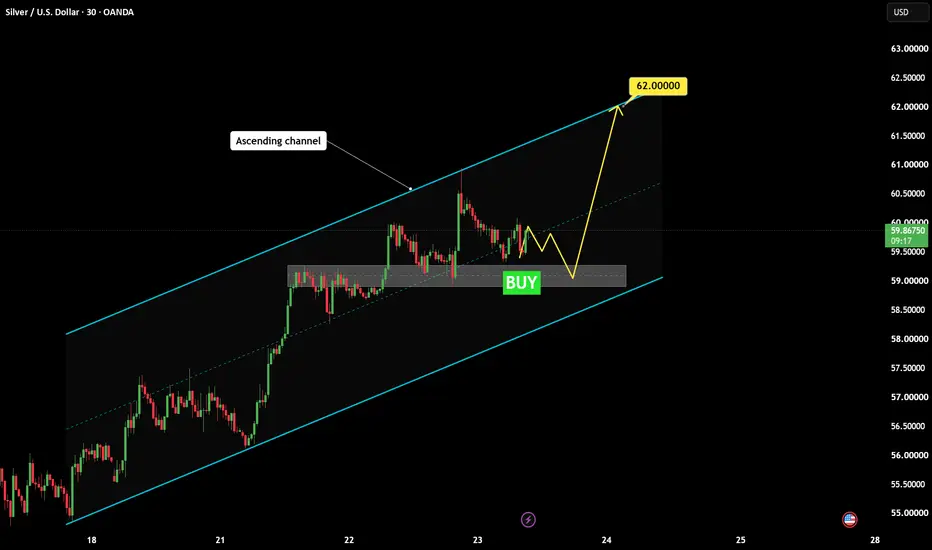
XAGUSD Pullback May Prepare the Next Rally Toward 62.00XAGUSD continues to move within a clear rising channel, keeping the broader market structure firmly bullish. Despite the latest pause, buyers are still controlling the trend and price remains positioned for another potential advance.
The next area to watch is the former resistance zone below current price. A controlled return into this region could provide a healthier base for continuation. If buyers defend it and price begins to recover, the next upward leg may extend toward 62.00, close to the channel’s upper boundary.
The bullish scenario remains intact while price stays above this support. A decisive breakdown, however, would signal fading demand and increase the chance of a deeper move toward the lower side of the channel.
Wait for a clear reaction before entering and keep risk under control.
Best of luck with your trading!
XAGUSD H1: Bullish Channel Expansion & RetestGreetings Traders! 📊
Silver (XAGUSD) on the 1-Hour (H1) timeframe is presenting a clean bullish market structure after transitioning out of a major correction phase into an aggressive expansion phase.
👁️ Technical Observation & Price Action:
Structural Shift: Following a breakout from the prior descending corrective structure, price established a steady ascending channel before breaking above its upper boundary with strong momentum.
Point of Interest (POI): We are anticipating a corrective retracement back into the highlighted 1H Demand Zone around the 58.50 – 58.80 region to absorb remaining liquidity.
Order Flow: Market structure remains strictly bullish as long as higher-low integrity is maintained above the structural support.
🎯 Trade Scenario & Objectives:
Execution Plan: Looking for price mitigation within the demand zone accompanied by lower timeframe confirmation (rejection/engulfing candles).
Upside Projection Target: 62.000 (Key high-timeframe liquidity level).
Risk Management / SL: Strategic invalidation placed strictly below the demand zone structure to maintain a high Risk-to-Reward ratio.
🛡️ Disclaimer & Account Policy:
Trade strictly according to your personal risk management parameters. Financial markets involve inherent volatility. This post is a personal analytical view based on price structure and does not constitute financial advice or trade guarantees. Protect your capital at all costs!
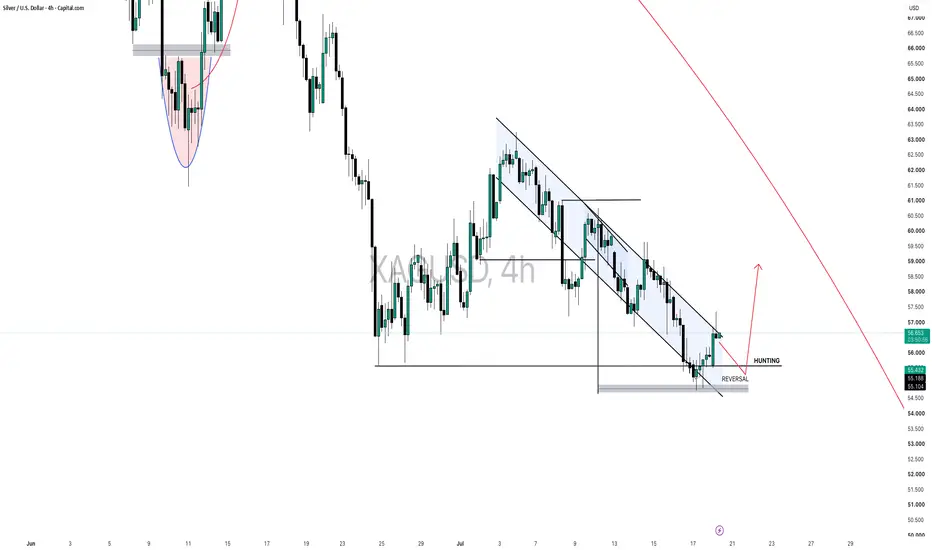
XAG/USD 4H Analysis: Falling Wedge Reversal | Buy the Dip Silver (XAG/USD) is approaching a technically important reversal zone on the 4-hour timeframe. After a prolonged bearish move, price has formed a falling wedge, a structure that often signals exhaustion of selling pressure and the beginning of a bullish reversal.
According to the Market Footprinting Trading Concept, the current price action suggests that sellers are gradually losing momentum while smart liquidity is being collected near a major demand area. The recent downside move appears to be a liquidity hunt, where price sweeps below support before preparing for a potential bullish expansion.
The highlighted grey demand zone represents a high-probability reversal area. However, patience is essential. Rather than entering blindly, traders should wait for an Initial Reversal (I.R.) confirmation, which serves as the trigger to validate buyer strength before considering long positions.
Market Structure
4H Falling Wedge Formation
Price trading inside a well-defined descending channel
Liquidity sweep below support (Hunting Zone)
Major demand/reversal area holding the downside
Bearish momentum showing signs of exhaustion
Trading Plan
✅ Wait for I.R. (Initial Reversal) Confirmation
✅ Look for a bullish breakout from the falling wedge.
✅ Buy on the retracement (Buy the Dip) after confirmation.
Bullish Outlook
If buyers successfully defend the reversal zone and break above the wedge resistance, Silver could initiate a fresh bullish leg. The breakout would confirm that the liquidity hunt has been completed, allowing price to target higher resistance levels over the coming sessions.
Key Reversal Zone: 54-53
Invalidation: A strong 4H candle closing below the reversal zone would weaken the bullish setup and delay the expected reversal.
Market Footprinting Trading Concept
"Trade Structure. Follow Liquidity. Wait for Confirmation."
Disclaimer: This analysis is for educational purposes only and does not constitute financial advice. Always wait for proper confirmation and manage your risk before entering any trade.
Silver is all time buy - ready to generate extrordinary returnsDon't Panic Over This Silver Drop—It's a Generational Buying Floor
Silver gave a breakout of a 45-year Cup & Handle pattern, and the price is about to retest the breakout support line of the C&H pattern.
Note: log % scale is used as a larger picture is being analyzed
As per the C&H rule, the fib extension, & the analysis - the target for Silver is somewhere between 600-750
The Calculation ($745 Target)
Cup Neckline Resistance: ~$48.00 (Set by the 1980 and 2011 peaks).
Accumulation Base Floor: ~$3.40 (1993 generational low).
The Log Projection: Duplicating the exact depth of the cup on a log scale and projecting it upward from the breakout neckline provides a technical target of $745.00.
Can Silver touch 49?US-Iran war still ON. Inflation numbers does come down but will be inflated again as oil touch 85. Rate-cut possibility is diminishing day by day. Though we could see a rate hike. but what about silver? Fundamentals says downward pressure is there but there will be some volatility due to good recent cpi data's (but we all know they are lagging indicators). so charts does say 49 to me, downward pressure is there too. lets see what happen? Remember its a 4hr chart🥲, so have patience..
#XAGUSD H1 Compression & Structural BreakdownSilver is displaying a clean structural breakdown on the hourly timeframe after a prolonged period of consolidation. Price action has been compressing within a clear symmetrical triangle, and we have recently witnessed a decisive breakout below the ascending support trendline. 🐻
With the bearish momentum gaining traction, we are looking for a potential retest of the broken structure and the descending counter-trendline alignment before the next impulsive leg down.
🔹 Entry / Sell Zone: 58.50 – 58.85 (Triangle Apex & Broken Trendline Retest)
🔴 Invalidation / SL: Daily candle close above 59.15
🎯 Target Area: 56.15 (Major Sell-Side Liquidity Pool)
The plan is to wait for the price to mitigate the retest zone and monitor lower timeframe distribution. Avoid chasing the move and let the market trigger our levels. 🔍
Trade carefully and always prioritize risk management! 💼🚀
Silver (XAGUSD) Technical Analysis: Waiting for Symmetrical TriaAnalysis:
The XAGUSD chart is currently forming a Symmetrical Triangle pattern, indicating a period of consolidation and indecision in the market. Price is coiling between converging resistance and support trendlines, reflecting a narrowing trading range.
Key Points:
Consolidation: The market is currently in an equilibrium phase where both buyers and sellers are waiting for a clear direction.
Breakout Strategy: I am monitoring for a confirmed breakout (either above the upper resistance or below the lower support) with significant volume to confirm the next directional move.
Outlook: As this is a neutral pattern, I am staying patient and waiting for the price to break out of the triangle to determine the next trend.
Disclaimer: This analysis is for educational purposes only and does not constitute financial advice. Always perform your own research before trading.
Silver Sellers Regain Control Below $59.20Silver has failed to hold its recovery and is now back under selling pressure. The break below $59.00–59.20 confirms that sellers are controlling the short-term structure.
A steady US Dollar and elevated US yields continue to weigh on precious metals.
Trade Setup:
Sell Zone: $59.00 – $59.20
Stop Loss: $60.10
Take Profit 1: $57.00
Take Profit 2: $56.00
XAGUSD: Bearish Trendline Continues to Cap RecoveryXAGUSD has staged a notable recovery from its lows, but upward momentum is stalling as the price approaches the bearish trendline around the 61.90–62.00 level. This zone has repeatedly triggered selling pressure, so the rejection observed here is not a random occurrence.
On the H4 timeframe, the price has yet to break the prevailing bearish structure. Silver remaining below the trendline—and close to the overhead Ichimoku cloud—indicates that buyers lack the strength to regain control. Additionally, the recovering USD and market anticipation of further signals from the Fed leave XAGUSD vulnerable to profit-taking following its short-term rally.
If the price fails to break above 61.97, selling pressure could extend toward 59.06, or even deeper to the 56.42 demand zone.
Entry Focus: Sell around 61.90–62.10 upon a rejection candle.
TP: 59.06
Invalidation: H4 close above 62.20.
Will Silver touch 50$ again ? SILVER (XAG/USD) TECHNICAL ANALYSIS REPORT
Bearish Structure Remains Intact – Bulls Need Strong Confirmation Before Trend Reversal
Timeframe: Daily (1D)
Current Price: 61.35 USD/oz
Trend Bias: Bearish to Neutral (Long-Term Bearish)
________________________________________
Executive Summary
Silver continues to trade under heavy selling pressure after failing to sustain its previous rally. The metal remains below the 200-Day Exponential Moving Average (EMA), indicating that the long-term trend is still bearish despite intermittent recovery attempts.
Price is currently trading inside a descending channel, while simultaneously testing a crucial support zone. This area will likely determine Silver's next major directional move.
________________________________________
Technical Structure
1. Long-Term Trend
• Price remains below the 200 EMA, which continues to act as dynamic resistance.
• Until Silver closes convincingly above this moving average, buyers do not have control of the market.
Conclusion: Long-term outlook remains bearish.
________________________________________
2. Descending Channel Formation
The chart clearly shows that Silver has been making:
• Lower Highs
• Lower Lows
forming a well-defined descending price channel.
Every rally has been sold into, confirming that sellers continue defending higher price levels.
Currently, price is approaching the lower boundary of this structure.
________________________________________
3. Critical Support Zone
Silver is sitting on an important support area around:
$60–61
This support has prevented further downside several times.
However,
The more times a support is tested, the weaker it becomes.
A decisive breakdown below this level could trigger fresh selling pressure.
________________________________________
Bearish Scenario
If Silver closes below the current support with increasing volume, the probability of continuation towards the lower channel support rises significantly.
Expected Downside Targets
• First Target: $57–58
• Second Target: $53–54
• Major Support Zone: $48–50
These levels coincide with historical demand zones and the lower boundary of the descending channel.
________________________________________
Bullish Scenario
The current downtrend can only be invalidated if buyers satisfy multiple technical conditions.
Bullish Confirmation Checklist
✅ Price closes above the 200 EMA
✅ Breakout above the descending EMA resistance
✅ Breakout above the upper trendline of the descending channel
✅ Rising trading volume confirms institutional participation
Without these confirmations, every upward move should be viewed as a bear market rally rather than the beginning of a new bullish trend.
________________________________________
Volume Analysis
Recent trading activity shows that buying volume has not been strong enough to reverse the prevailing trend.
For any sustainable upside move,
• Volume should expand during bullish candles.
• Breakouts without volume are likely to fail.
Volume confirmation remains the key ingredient for trend reversal.
________________________________________
Key Technical Levels
Level Importance
67–68 200 EMA / Major Resistance
70–72 Channel Breakout Zone
60–61 Immediate Support
57–58 First Bearish Target
53–54 Secondary Support
48–50 Major Long-Term Support
________________________________________
Trading Strategy
Bearish Strategy
• Wait for a confirmed daily close below $60–61.
• Confirmation should come with higher-than-average volume.
• Downside targets remain $57, $54, and potentially $50.
Bullish Strategy
Avoid aggressive long positions until Silver:
• Regains the 200 EMA,
• Breaks the descending channel,
• Confirms the breakout with strong volume.
Only then would the probability shift in favor of a sustained bullish trend.
________________________________________
Final Outlook
Silver remains technically fragile as it trades beneath its 200-Day EMA and within a well-defined descending channel, reflecting persistent seller dominance. The $60–61 support zone is now the market's key inflection point. A decisive breakdown could accelerate downside momentum toward $57, $54, and potentially $50. Conversely, any meaningful recovery requires a high-conviction breakout above the 200 EMA and the channel resistance, supported by strong buying volume. Until these conditions are met, the broader outlook favors selling on rallies rather than buying dips.
Technical View: Bearish Bias
Momentum: Weak
Trend Strength: Sellers in Control
Reversal Probability: Low unless price reclaims the 200 EMA with strong volume.