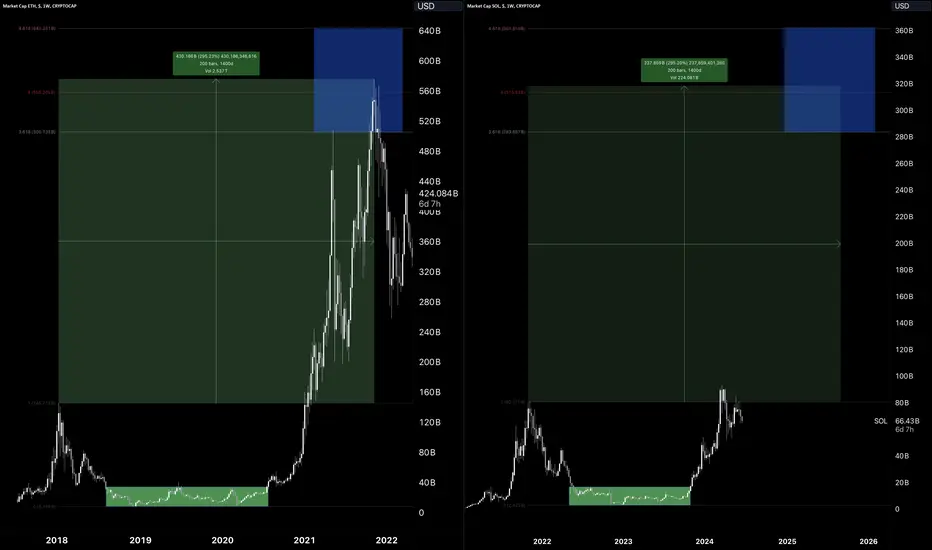
LOOKING AT MARKET CAPS, BETWEEN  ETH AND $SOL. IVE BEEN SAYING
  SOL IS REPEATING ETH CYCLE SINCE $8 PER $SOLANA. FADE AT YOUR OWN PERIL, NFA.
(SEE MY LINKED CHART CALLING FOR THESOL MARKET CAP BOTTOM IN NOV 2022 AT THE BOTTOM OF THIS ANALYSIS)
ETH 2020-2021
vs
SOL 2024-2025
analyzing market cap ofETH from 2017 to 2021
with market cap ofSOL from 2021-2025
ETH Market Cap topped at $145B in 2017
SOL Market Cap topped at $80B in 2021
ETH MC bottom'd at 88B in 2018 (94% drop)
SOL MC bottom'd at 33B in 2021 (96% drop)
ETH MC ran to $575B in 2021 (4x from 2017 Top), taking 1400 days in between highs
SOL MC will run to ~$320B in Sep 2025 (4x from 2021 Top), taking 1400 days in between highs?
will be interesting to follow, publish to accurately track
~$320B MC is ~$696.9 perSOL
(SEE MY LINKED CHART CALLING FOR THESOL MARKET CAP BOTTOM IN NOV 2022 AT THE BOTTOM OF THIS ANALYSIS)
-CryptoCurb
ETH AND $SOL. IVE BEEN SAYING SOL IS REPEATING ETH CYCLE SINCE $8 PER $SOLANA. FADE AT YOUR OWN PERIL, NFA. (SEE MY LINKED CHART CALLING FOR THE
SOL MARKET CAP BOTTOM IN NOV 2022 AT THE BOTTOM OF THIS ANALYSIS)ETH 2020-2021vs
SOL 2024-2025analyzing market cap of
ETH from 2017 to 2021with market cap of
SOL from 2021-2025ETH Market Cap topped at $145B in 2017SOL Market Cap topped at $80B in 2021ETH MC bottom'd at 88B in 2018 (94% drop)SOL MC bottom'd at 33B in 2021 (96% drop)ETH MC ran to $575B in 2021 (4x from 2017 Top), taking 1400 days in between highsSOL MC will run to ~$320B in Sep 2025 (4x from 2021 Top), taking 1400 days in between highs?will be interesting to follow, publish to accurately track
~$320B MC is ~$696.9 per
SOL(SEE MY LINKED CHART CALLING FOR THE
SOL MARKET CAP BOTTOM IN NOV 2022 AT THE BOTTOM OF THIS ANALYSIS)-CryptoCurb

Pubblicazioni correlate
Declinazione di responsabilità
Le informazioni e le pubblicazioni non sono intese come, e non costituiscono, consulenza o raccomandazioni finanziarie, di investimento, di trading o di altro tipo fornite o approvate da TradingView. Per ulteriori informazioni, consultare i Termini di utilizzo.
Pubblicazioni correlate
Declinazione di responsabilità
Le informazioni e le pubblicazioni non sono intese come, e non costituiscono, consulenza o raccomandazioni finanziarie, di investimento, di trading o di altro tipo fornite o approvate da TradingView. Per ulteriori informazioni, consultare i Termini di utilizzo.