
NBIS is on my watchlist right now but I'm not touching it tomorrow and I want to explain exactly why.
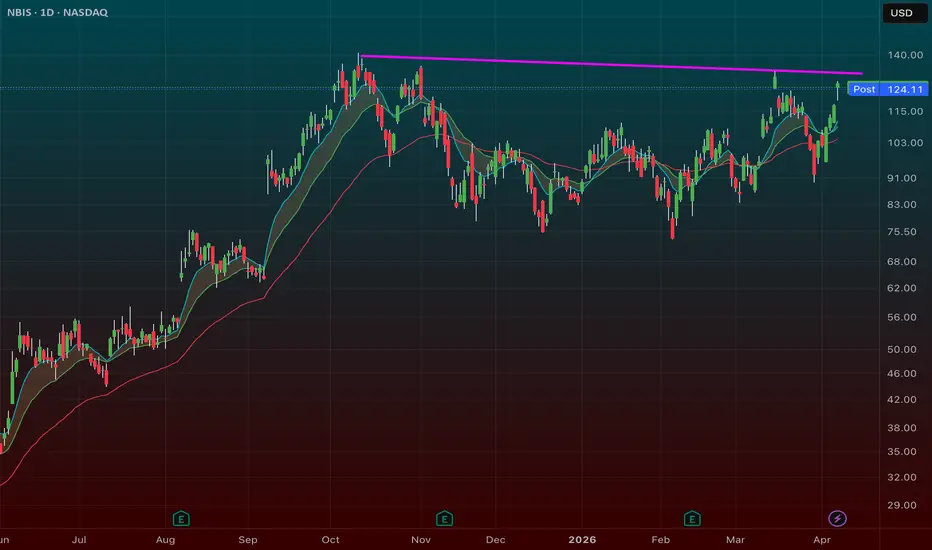
Stock was sitting at $90 just a few days ago. It's run hard and fast. That move was real — NBIS is a neo-cloud infrastructure company that's been signing deals, landed a partnership with Meta, and got a direct investment from Nvidia. The fundamentals are there. The institutional interest is there. But the chart needs time to work now.
There's a big flat top resistance level sitting around $131. That's the breakout level. Clear it on volume and this thing has room to move. But right now price is extended well above the 9 EMA and chasing a breakout here is how you get chopped out. Breakout failure risk goes up significantly when the pattern is this stretched.
─────────────────────────────────
WHAT I'M WAITING FOR
─────────────────────────────────
Inside day or two small pullback days
Pattern tightens up right under that $131 level
9 EMA catches up to price
Volume dries up during the consolidation
That's the setup. When the 9 EMA is close and the pattern is tight, a breakout through $131 becomes a completely different trade than what's in front of us right now. Night and day in terms of risk/reward.
─────────────────────────────────
TRADE PLAN
─────────────────────────────────
Trigger: Breakout and hold above $131 on volume
Entry: Breakout candle after tight consolidation
Stop: Below the 9 EMA on the day of entry
Pattern: Flat Top Breakout
Watching. Not in yet.
─────────────────────────────────
ABOUT
─────────────────────────────────
Stock was sitting at $90 just a few days ago. It's run hard and fast. That move was real — NBIS is a neo-cloud infrastructure company that's been signing deals, landed a partnership with Meta, and got a direct investment from Nvidia. The fundamentals are there. The institutional interest is there. But the chart needs time to work now.
There's a big flat top resistance level sitting around $131. That's the breakout level. Clear it on volume and this thing has room to move. But right now price is extended well above the 9 EMA and chasing a breakout here is how you get chopped out. Breakout failure risk goes up significantly when the pattern is this stretched.
─────────────────────────────────
WHAT I'M WAITING FOR
─────────────────────────────────
Inside day or two small pullback days
Pattern tightens up right under that $131 level
9 EMA catches up to price
Volume dries up during the consolidation
That's the setup. When the 9 EMA is close and the pattern is tight, a breakout through $131 becomes a completely different trade than what's in front of us right now. Night and day in terms of risk/reward.
─────────────────────────────────
TRADE PLAN
─────────────────────────────────
Trigger: Breakout and hold above $131 on volume
Entry: Breakout candle after tight consolidation
Stop: Below the 9 EMA on the day of entry
Pattern: Flat Top Breakout
Watching. Not in yet.
─────────────────────────────────
ABOUT
─────────────────────────────────
Trade attivo
trying to find an entry to double up on this its the best chart thats left
📈 Kunal Desai, Founder of BullsOnWallStreet – Trading Education Since 2008
🚀 Learn my trading strategies, watch live setups, and get mentored:
🔗bullsonwallstreet.com/live-60-day-bootcamp
🚀 Learn my trading strategies, watch live setups, and get mentored:
🔗bullsonwallstreet.com/live-60-day-bootcamp
Declinazione di responsabilità
Le informazioni e le pubblicazioni non sono intese come, e non costituiscono, consulenza o raccomandazioni finanziarie, di investimento, di trading o di altro tipo fornite o approvate da TradingView. Per ulteriori informazioni, consultare i Termini di utilizzo.
📈 Kunal Desai, Founder of BullsOnWallStreet – Trading Education Since 2008
🚀 Learn my trading strategies, watch live setups, and get mentored:
🔗bullsonwallstreet.com/live-60-day-bootcamp
🚀 Learn my trading strategies, watch live setups, and get mentored:
🔗bullsonwallstreet.com/live-60-day-bootcamp
Declinazione di responsabilità
Le informazioni e le pubblicazioni non sono intese come, e non costituiscono, consulenza o raccomandazioni finanziarie, di investimento, di trading o di altro tipo fornite o approvate da TradingView. Per ulteriori informazioni, consultare i Termini di utilizzo.