
Where NBIS stands now
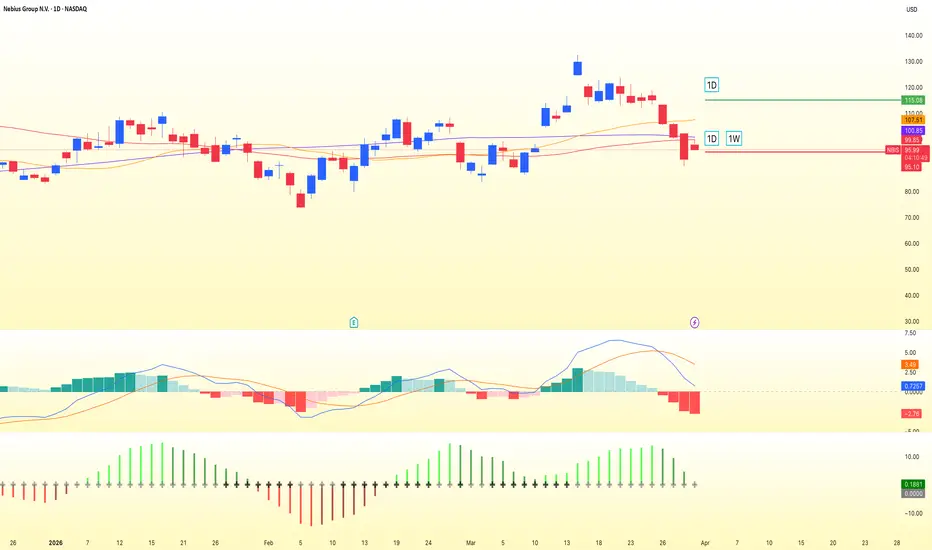
Hello, traders! NBIS is moving through a clear correction after an aggressive run that topped near $130, and the short-term tone has turned defensive. On the daily chart, price has slipped below the MA20 at $107.51, the MA60 at $99.85, and the MA120 at $100.85, which puts the stock in a bearish tactical structure for now. The 1D SuperTrend at $114.11 is now acting as overhead resistance, while the recent market structure shift suggests the prior upside impulse has lost control. That said, the larger picture is not fully broken. On the weekly chart, price is still above the long-term SuperTrend at $84.65 and the 60-week moving average at $71.41, so this still looks more like a heavy pullback inside a broader uptrend than a confirmed long-term reversal. The key issue here is that momentum has cooled sharply, and the market is no longer rewarding the previous high-beta expansion story with the same urgency.
What the chart is signaling in the short term
The daily structure carries the clearest message right now, and it is cautious. A visible Double Top has formed around the $130 area, with two failed pushes into the same region followed by a breakdown under key moving averages. That pattern is only moderately confirmed for now, but it becomes far more meaningful if NBIS closes below the local swing low around $90. Momentum studies are aligned with that softer view: the 1D MACD remains bearish, the SQZMOM release was to the downside, and ADX at 21.08 and falling suggests the move lower is active but not yet a strong trend expansion. In plain terms, sellers have control, but they have not produced a full capitulation move yet. That leaves room for continued chop between support and resistance before the next decisive leg begins. As long as price stays below the $100 area and especially below the $114.11 resistance cluster, rallies are likely to be treated as corrective rather than impulsive.
Why the higher timeframe still matters
The more constructive argument comes from the weekly and 4-week charts. On the weekly timeframe, momentum has stalled, but the primary structure has not fully failed. The low ADX reading of 9.39 suggests the higher timeframe is not trending strongly in either direction at the moment, which often points to consolidation before a larger move develops. On the 4-week chart, however, the broader trend remains dominant. ADX at 66.69 reflects how powerful the previous upside cycle has been, and major long-term support still sits well below current price, with the 4W SuperTrend at $66.16 and the MA20 at $64.80. That separation is important because it shows the long-term bullish thesis is not under immediate threat unless NBIS loses much deeper support. So while the daily chart is clearly damaged, the monthly structure says this is still a correction unless the stock starts breaking the lower support stack in sequence. The market is essentially deciding whether this is a reset inside trend or the first stage of a much deeper unwind.
Levels that will decide the next move
The chart is now centered around a very clean map. Resistance is concentrated at $114.11, reinforced by the 1D SuperTrend and the nearby moving-average cluster. A daily close above $115.00 would be the clearest signal that the correction is losing grip and that price is ready to challenge the prior highs again, with $135.00 becoming the natural upside objective. On the downside, the first decisive trigger is weakness through $95.00 on a daily closing basis, which would keep the bearish continuation path active and open the door to $80.00. The more important structural floor sits near $78.50, a zone tied to prior consolidation and a historical market structure shift. If that area fails, the correction likely stops being a short-term event and starts looking more like a broader reversal, with the $60-$65 monthly support region coming back into view. Between those levels, the base case remains a messy range, with price rotating between roughly $90 and $100 while the market searches for equilibrium.
The main path and the alternative
For now, the primary path still favors caution. The daily trend is bearish, the pattern risk from the Double Top remains active, and price has not yet reclaimed the levels needed to re-establish bullish control. That keeps the near-term bias slightly bearish to neutral, with the market vulnerable to another push lower if $95.00 and then $90.00 fail on closing basis. Under that path, $80.00 and the broader $78-$85 support region become the focus. The alternative is straightforward and stronger if it happens: a daily close above $115.00 would invalidate the current bearish structure, neutralize the Double Top threat, and shift the conversation back toward trend continuation, with $135.00 as the next upside magnet. There is also a middle-ground bullish scenario if weekly support stabilizes and price can reclaim $96.00 on a weekly close, which would favor a bounce toward $112.00, though that setup currently looks less convincing. Until NBIS proves otherwise, rallies below resistance should be respected as recovery attempts, while a confirmed break above resistance would materially improve the outlook.
Hello, traders! NBIS is moving through a clear correction after an aggressive run that topped near $130, and the short-term tone has turned defensive. On the daily chart, price has slipped below the MA20 at $107.51, the MA60 at $99.85, and the MA120 at $100.85, which puts the stock in a bearish tactical structure for now. The 1D SuperTrend at $114.11 is now acting as overhead resistance, while the recent market structure shift suggests the prior upside impulse has lost control. That said, the larger picture is not fully broken. On the weekly chart, price is still above the long-term SuperTrend at $84.65 and the 60-week moving average at $71.41, so this still looks more like a heavy pullback inside a broader uptrend than a confirmed long-term reversal. The key issue here is that momentum has cooled sharply, and the market is no longer rewarding the previous high-beta expansion story with the same urgency.
What the chart is signaling in the short term
The daily structure carries the clearest message right now, and it is cautious. A visible Double Top has formed around the $130 area, with two failed pushes into the same region followed by a breakdown under key moving averages. That pattern is only moderately confirmed for now, but it becomes far more meaningful if NBIS closes below the local swing low around $90. Momentum studies are aligned with that softer view: the 1D MACD remains bearish, the SQZMOM release was to the downside, and ADX at 21.08 and falling suggests the move lower is active but not yet a strong trend expansion. In plain terms, sellers have control, but they have not produced a full capitulation move yet. That leaves room for continued chop between support and resistance before the next decisive leg begins. As long as price stays below the $100 area and especially below the $114.11 resistance cluster, rallies are likely to be treated as corrective rather than impulsive.
Why the higher timeframe still matters
The more constructive argument comes from the weekly and 4-week charts. On the weekly timeframe, momentum has stalled, but the primary structure has not fully failed. The low ADX reading of 9.39 suggests the higher timeframe is not trending strongly in either direction at the moment, which often points to consolidation before a larger move develops. On the 4-week chart, however, the broader trend remains dominant. ADX at 66.69 reflects how powerful the previous upside cycle has been, and major long-term support still sits well below current price, with the 4W SuperTrend at $66.16 and the MA20 at $64.80. That separation is important because it shows the long-term bullish thesis is not under immediate threat unless NBIS loses much deeper support. So while the daily chart is clearly damaged, the monthly structure says this is still a correction unless the stock starts breaking the lower support stack in sequence. The market is essentially deciding whether this is a reset inside trend or the first stage of a much deeper unwind.
Levels that will decide the next move
The chart is now centered around a very clean map. Resistance is concentrated at $114.11, reinforced by the 1D SuperTrend and the nearby moving-average cluster. A daily close above $115.00 would be the clearest signal that the correction is losing grip and that price is ready to challenge the prior highs again, with $135.00 becoming the natural upside objective. On the downside, the first decisive trigger is weakness through $95.00 on a daily closing basis, which would keep the bearish continuation path active and open the door to $80.00. The more important structural floor sits near $78.50, a zone tied to prior consolidation and a historical market structure shift. If that area fails, the correction likely stops being a short-term event and starts looking more like a broader reversal, with the $60-$65 monthly support region coming back into view. Between those levels, the base case remains a messy range, with price rotating between roughly $90 and $100 while the market searches for equilibrium.
The main path and the alternative
For now, the primary path still favors caution. The daily trend is bearish, the pattern risk from the Double Top remains active, and price has not yet reclaimed the levels needed to re-establish bullish control. That keeps the near-term bias slightly bearish to neutral, with the market vulnerable to another push lower if $95.00 and then $90.00 fail on closing basis. Under that path, $80.00 and the broader $78-$85 support region become the focus. The alternative is straightforward and stronger if it happens: a daily close above $115.00 would invalidate the current bearish structure, neutralize the Double Top threat, and shift the conversation back toward trend continuation, with $135.00 as the next upside magnet. There is also a middle-ground bullish scenario if weekly support stabilizes and price can reclaim $96.00 on a weekly close, which would favor a bounce toward $112.00, though that setup currently looks less convincing. Until NBIS proves otherwise, rallies below resistance should be respected as recovery attempts, while a confirmed break above resistance would materially improve the outlook.

follow my X 👉 x.com/bbqgio
🔥 level up your Stock, FX, & Crypto: VIP access to AI technical analysis and pro market insights at TradeOS + 50%-off promo code ONBOARD 👉
ai.tradeos.xyz/?utm_source=tvbg
🔥 level up your Stock, FX, & Crypto: VIP access to AI technical analysis and pro market insights at TradeOS + 50%-off promo code ONBOARD 👉
ai.tradeos.xyz/?utm_source=tvbg
Pubblicazioni correlate
Declinazione di responsabilità
Le informazioni e le pubblicazioni non sono intese come, e non costituiscono, consulenza o raccomandazioni finanziarie, di investimento, di trading o di altro tipo fornite o approvate da TradingView. Per ulteriori informazioni, consultare i Termini di utilizzo.
follow my X 👉 x.com/bbqgio
🔥 level up your Stock, FX, & Crypto: VIP access to AI technical analysis and pro market insights at TradeOS + 50%-off promo code ONBOARD 👉
ai.tradeos.xyz/?utm_source=tvbg
🔥 level up your Stock, FX, & Crypto: VIP access to AI technical analysis and pro market insights at TradeOS + 50%-off promo code ONBOARD 👉
ai.tradeos.xyz/?utm_source=tvbg
Pubblicazioni correlate
Declinazione di responsabilità
Le informazioni e le pubblicazioni non sono intese come, e non costituiscono, consulenza o raccomandazioni finanziarie, di investimento, di trading o di altro tipo fornite o approvate da TradingView. Per ulteriori informazioni, consultare i Termini di utilizzo.