
Technical Analysis and Outlook
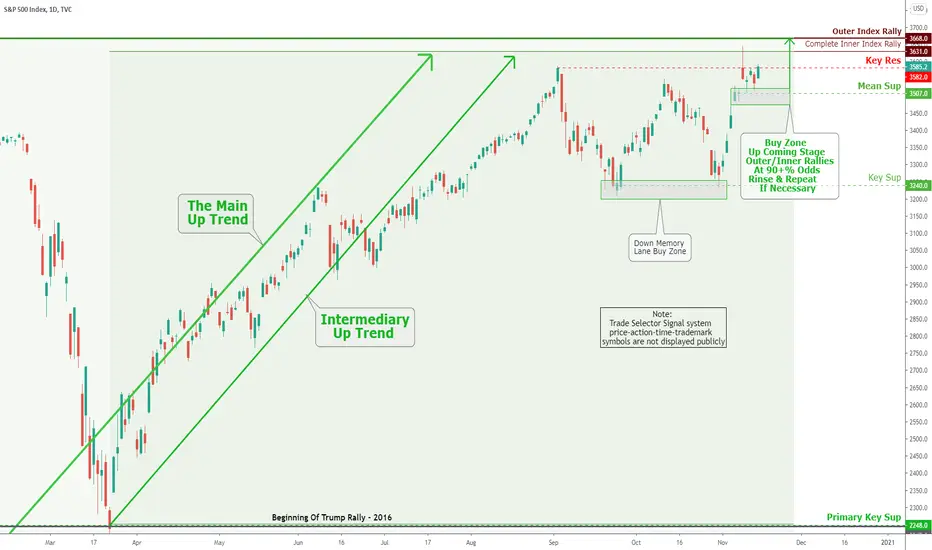
The S&P 500 bounced off the Key Res $3,582 and completed Inner Index Rally $3.631 projection on October 9th. The current ''Buy Zone'' and Mean Sup $3,507 stands as an excellent opportunity for buying once the prices drop this zone. To continue the rest of the market story, see the 'Weekly Market Review & Analysis For November 9, 2020" at the usual site.
The S&P 500 bounced off the Key Res $3,582 and completed Inner Index Rally $3.631 projection on October 9th. The current ''Buy Zone'' and Mean Sup $3,507 stands as an excellent opportunity for buying once the prices drop this zone. To continue the rest of the market story, see the 'Weekly Market Review & Analysis For November 9, 2020" at the usual site.

Declinazione di responsabilità
Le informazioni e le pubblicazioni non sono intese come, e non costituiscono, consulenza o raccomandazioni finanziarie, di investimento, di trading o di altro tipo fornite o approvate da TradingView. Per ulteriori informazioni, consultare i Termini di utilizzo.
Declinazione di responsabilità
Le informazioni e le pubblicazioni non sono intese come, e non costituiscono, consulenza o raccomandazioni finanziarie, di investimento, di trading o di altro tipo fornite o approvate da TradingView. Per ulteriori informazioni, consultare i Termini di utilizzo.