
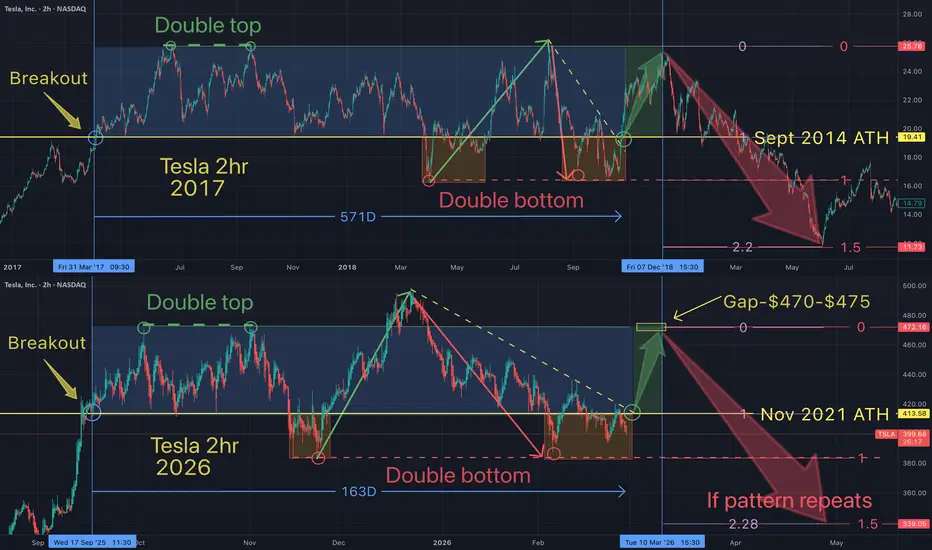
Fractals work until they dont. But so far it's hard not to consider this a map. The question is will Tesla fill its gap at $470-$475 and then drop lower to complete the pattern? Either way, my base case is Tesla is eventually going lower (in the mid term), based on yesterday's Tesla chart suggesting that Tesla is in a Wyckoff distribution (top). I hope I'm wrong.
During midterm years, historically the first week in March is bullish for the markets, followed by a decline into the summer...which would coincide with the fractal pattern.
May the trends be with you.
During midterm years, historically the first week in March is bullish for the markets, followed by a decline into the summer...which would coincide with the fractal pattern.
May the trends be with you.

May the trends be with you.
Declinazione di responsabilità
Le informazioni e le pubblicazioni non sono intese come, e non costituiscono, consulenza o raccomandazioni finanziarie, di investimento, di trading o di altro tipo fornite o approvate da TradingView. Per ulteriori informazioni, consultare i Termini di utilizzo.
May the trends be with you.
Declinazione di responsabilità
Le informazioni e le pubblicazioni non sono intese come, e non costituiscono, consulenza o raccomandazioni finanziarie, di investimento, di trading o di altro tipo fornite o approvate da TradingView. Per ulteriori informazioni, consultare i Termini di utilizzo.