
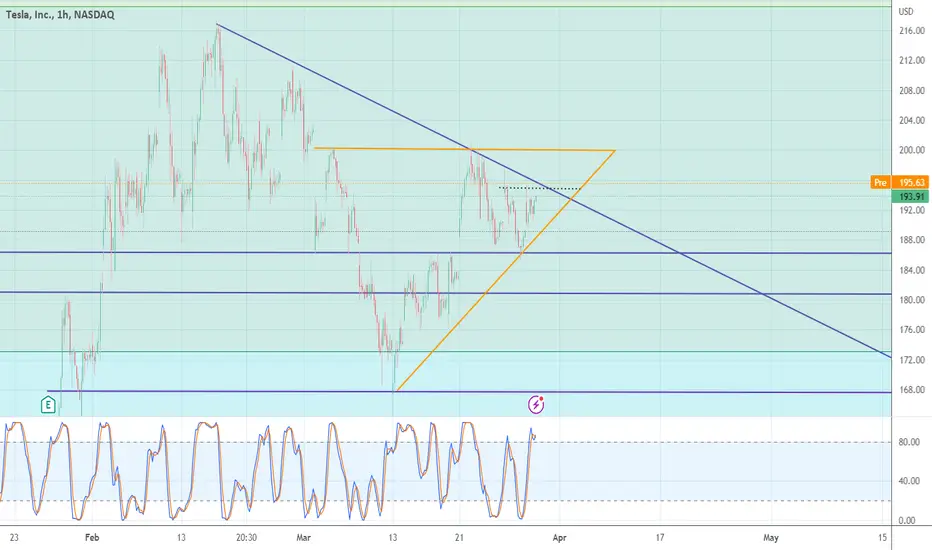
The 1h chart for TSLA indicates a major decending triangle formation (in blue) and an ascending tringle (in orange).
The ascending triangle could potentially cross the descending one today and we could see some further movement upwards.
The current RSI is overbought meaning that we could see some price correction in the early hours with some selling action. (to around $190)
My stop loss is still at $185.
The ascending triangle could potentially cross the descending one today and we could see some further movement upwards.
The current RSI is overbought meaning that we could see some price correction in the early hours with some selling action. (to around $190)
My stop loss is still at $185.

Declinazione di responsabilità
Le informazioni e le pubblicazioni non sono intese come, e non costituiscono, consulenza o raccomandazioni finanziarie, di investimento, di trading o di altro tipo fornite o approvate da TradingView. Per ulteriori informazioni, consultare i Termini di utilizzo.
Declinazione di responsabilità
Le informazioni e le pubblicazioni non sono intese come, e non costituiscono, consulenza o raccomandazioni finanziarie, di investimento, di trading o di altro tipo fornite o approvate da TradingView. Per ulteriori informazioni, consultare i Termini di utilizzo.