
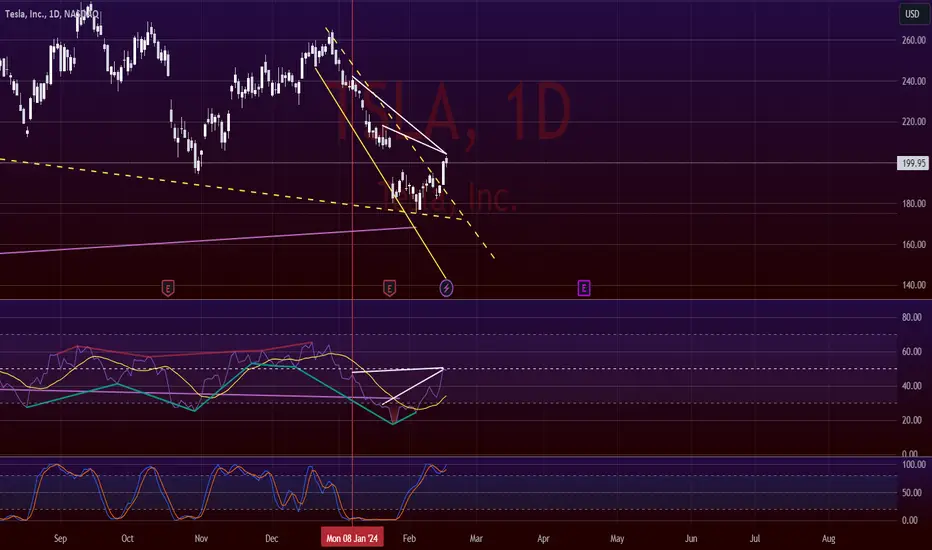
Looks like the RSI suggesting us that TSLA stock will go down to 140-150$ in upcoming week. Daily chart has bearish hidden divergence, also overbought on Stochastic RSI.
If we go down without breaking and holding 211$ the price will be rejected from 200EMA and that would be very bearish signs for Tesla.
Weekly chart looks better suggesting we will go back up fast and there shouldn't be much downside left. Putting my buy orders between 100$ to 155$
If we go down without breaking and holding 211$ the price will be rejected from 200EMA and that would be very bearish signs for Tesla.
Weekly chart looks better suggesting we will go back up fast and there shouldn't be much downside left. Putting my buy orders between 100$ to 155$

Declinazione di responsabilità
Le informazioni e le pubblicazioni non sono intese come, e non costituiscono, consulenza o raccomandazioni finanziarie, di investimento, di trading o di altro tipo fornite o approvate da TradingView. Per ulteriori informazioni, consultare i Termini di utilizzo.
Declinazione di responsabilità
Le informazioni e le pubblicazioni non sono intese come, e non costituiscono, consulenza o raccomandazioni finanziarie, di investimento, di trading o di altro tipo fornite o approvate da TradingView. Per ulteriori informazioni, consultare i Termini di utilizzo.