
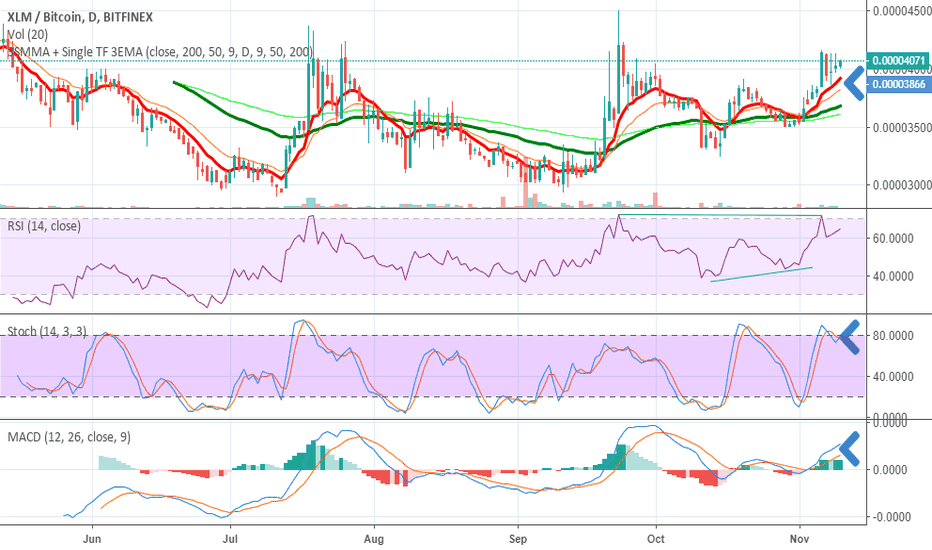
Yesterday after this post:
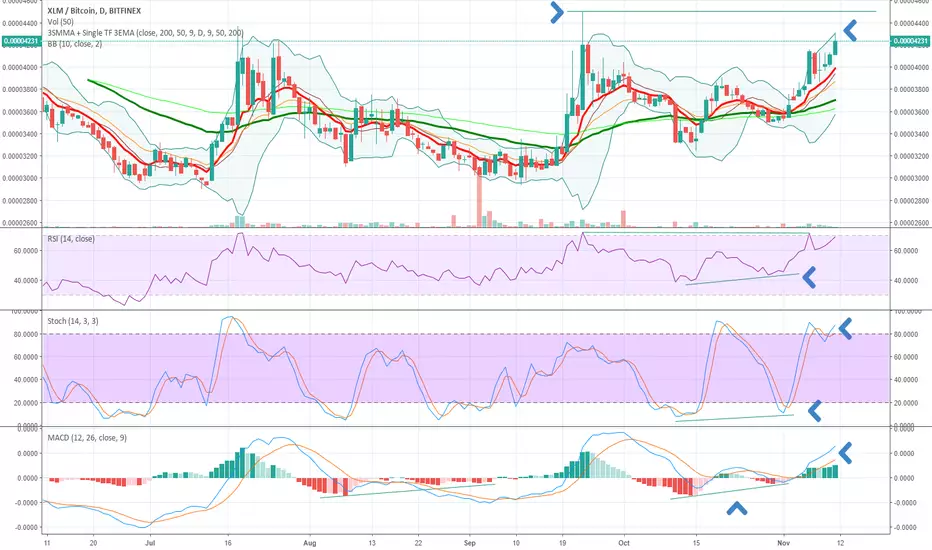
The price of XLM increases abit
From 0.00004071 (at the time of the post), to 0.00004231 (now)
Reasons to hodl?:
1. Stochastic still K>>D
2. Bullish divergence at all indicators as shown (RSI, stochastic, MACD)
When to sell? (when it does not reach last highest price):
1. Not being able to get through the last highest price (around 0.000045) and goes back
2. And then from the RSI / Stochastic / MACD it shows bearish divergence
3. And the stochastic indicator reversed (i.e. K<D)
And if it breaks 0.000045 we will have to analyse again.
The price of XLM increases abit
From 0.00004071 (at the time of the post), to 0.00004231 (now)
Reasons to hodl?:
1. Stochastic still K>>D
2. Bullish divergence at all indicators as shown (RSI, stochastic, MACD)
When to sell? (when it does not reach last highest price):
1. Not being able to get through the last highest price (around 0.000045) and goes back
2. And then from the RSI / Stochastic / MACD it shows bearish divergence
3. And the stochastic indicator reversed (i.e. K<D)
And if it breaks 0.000045 we will have to analyse again.

Pubblicazioni correlate
Declinazione di responsabilità
Le informazioni e le pubblicazioni non sono intese come, e non costituiscono, consulenza o raccomandazioni finanziarie, di investimento, di trading o di altro tipo fornite o approvate da TradingView. Per ulteriori informazioni, consultare i Termini di utilizzo.
Pubblicazioni correlate
Declinazione di responsabilità
Le informazioni e le pubblicazioni non sono intese come, e non costituiscono, consulenza o raccomandazioni finanziarie, di investimento, di trading o di altro tipo fornite o approvate da TradingView. Per ulteriori informazioni, consultare i Termini di utilizzo.