$BTC Daily Update – Imbalance Holding, Still Expecting LowerDaily view remains unchanged.
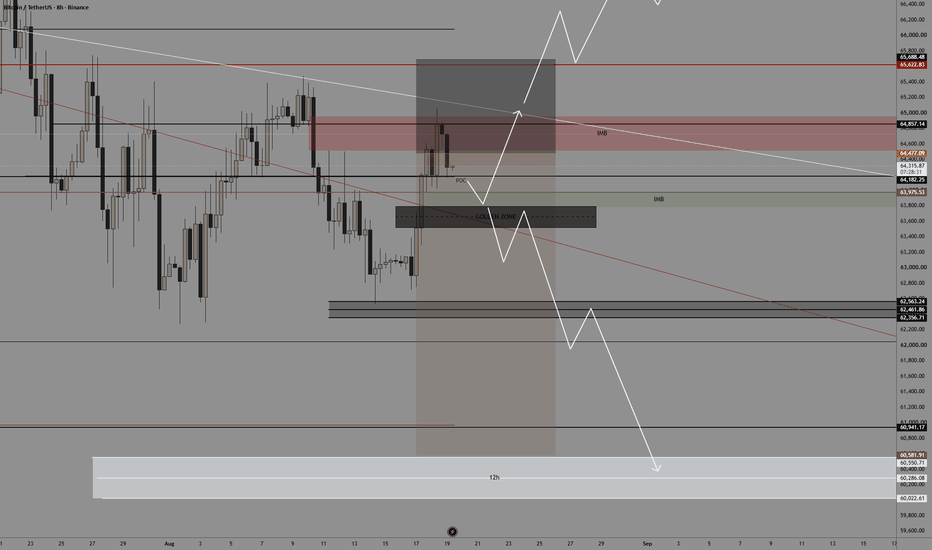
The imbalance has not been broken and price has failed to make a new high, so the bias stays to the downside.
However, Bitcoin is currently stuck in a tight range.
Even though the local structure is bearish, a single strong positive catalyst could push price toward the $70k zone.
Key level for downside continuation:
A clean break below $63,500 would open the path lower.
Until then, we remain in a wait-and-see mode inside the range.
What’s your current bias on CRYPTOCAP:BTC ?
Bearish Patterns
GBP/CHF BEARS ARE GAINING STRENGTH|SHORT
Hello, Friends!
Previous week’s green candle means that for us the GBP/CHF pair is in the uptrend. And the current movement leg was also up but the resistance line will be hit soon and upper BB band proximity will signal an overbought condition so we will go for a counter-trend short trade with the target being at 1.092.
Disclosure: I am part of Trade Nation's Influencer program and receive a monthly fee for using their TradingView charts in my analysis.
✅LIKE AND COMMENT MY IDEAS✅
AUD/USD SENDS CLEAR BEARISH SIGNALS|SHORT
Hello, Friends!
The BB upper band is nearby so AUD-USD is in the overbought territory. Thus, despite the uptrend on the 1W timeframe I think that we will see a bearish reaction from the resistance line above and a move down towards the target at around 0.708.
Disclosure: I am part of Trade Nation's Influencer program and receive a monthly fee for using their TradingView charts in my analysis.
✅LIKE AND COMMENT MY IDEAS✅
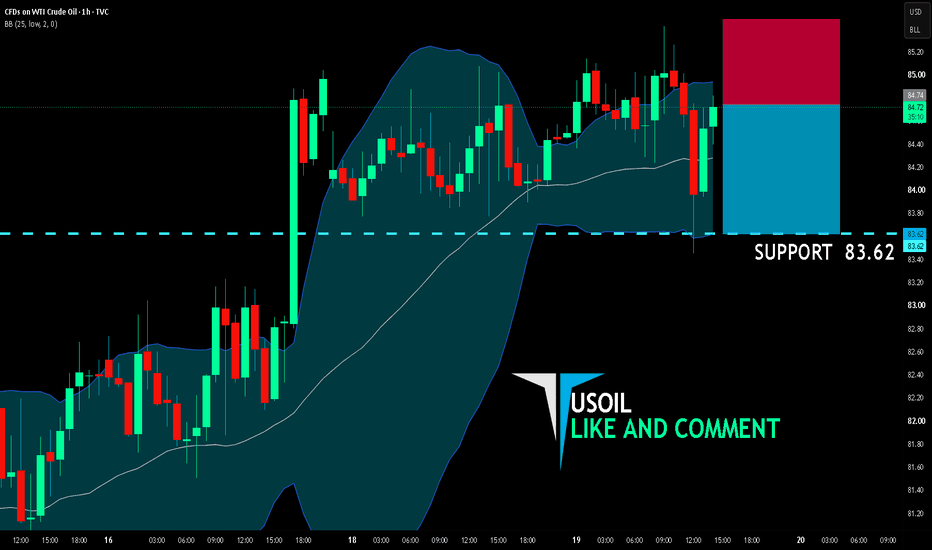
USOIL BEARS ARE GAINING STRENGTH|SHORT
USOIL SIGNAL
Trade Direction: short
Entry Level: 84.74
Target Level: 83.62
Stop Loss: 85.48
RISK PROFILE
Risk level: medium
Suggested risk: 1%
Timeframe: 1h
Disclosure: I am part of Trade Nation's Influencer program and receive a monthly fee for using their TradingView charts in my analysis.
✅LIKE AND COMMENT MY IDEAS✅
CHF/JPY BEARISH BIAS RIGHT NOW| SHORT
Hello, Friends!
Previous week’s green candle means that for us the CHF/JPY pair is in the uptrend. And the current movement leg was also up but the resistance line will be hit soon and upper BB band proximity will signal an overbought condition so we will go for a counter-trend short trade with the target being at 195.391.
Disclosure: I am part of Trade Nation's Influencer program and receive a monthly fee for using their TradingView charts in my analysis.
✅LIKE AND COMMENT MY IDEAS✅
AUD/JPY BEARS ARE STRONG HERE|SHORT
Hello, Friends!
AUD-JPY uptrend evident from the last 1W green candle makes short trades more risky, but the current set-up targeting 111.935 area still presents a good opportunity for us to sell the pair because the resistance line is nearby and the BB upper band is close which indicates the overbought state of the AUD/JPY pair.
Disclosure: I am part of Trade Nation's Influencer program and receive a monthly fee for using their TradingView charts in my analysis.
✅LIKE AND COMMENT MY IDEAS✅
GBPUSD Potential Downsides!Hey Traders, in today's trading session we are monitoring GBPUSD for a selling opportunity around 1.35400 zone, GBPUSD is trading in a downtrend and currently is in a correction phase in which it is approaching the trend at 1.35400 support and resistance area.
Trade safe, Joe.
EUR/NZD BEARS WILL DOMINATE THE MARKET|SHORT
Hello, Friends!
EUR/NZD pair is in the uptrend because previous week’s candle is green, while the price is obviously rising on the 4H timeframe. And after the retest of the resistance line above I believe we will see a move down towards the target below at 1.964 because the pair overbought due to its proximity to the upper BB band and a bearish correction is likely.
Disclosure: I am part of Trade Nation's Influencer program and receive a monthly fee for using their TradingView charts in my analysis.
✅LIKE AND COMMENT MY IDEAS✅
EUR/CHF SENDS CLEAR BEARISH SIGNALS|SHORT
EUR/CHF SIGNAL
Trade Direction: short
Entry Level: 0.938
Target Level: 0.937
Stop Loss: 0.939
RISK PROFILE
Risk level: medium
Suggested risk: 1%
Timeframe: 1h
Disclosure: I am part of Trade Nation's Influencer program and receive a monthly fee for using their TradingView charts in my analysis.
✅LIKE AND COMMENT MY IDEAS✅
EUR/GBP BEARS ARE GAINING STRENGTH|SHORT
Hello, Friends!
EUR/GBP pair is trading in a local downtrend which know by looking at the previous 1W candle which is red. On the 4H timeframe the pair is going up. The pair is overbought because the price is close to the upper band of the BB indicator. So we are looking to sell the pair with the upper BB line acting as resistance. The next target is 0.853 area.
Disclosure: I am part of Trade Nation's Influencer program and receive a monthly fee for using their TradingView charts in my analysis.
✅LIKE AND COMMENT MY IDEAS✅
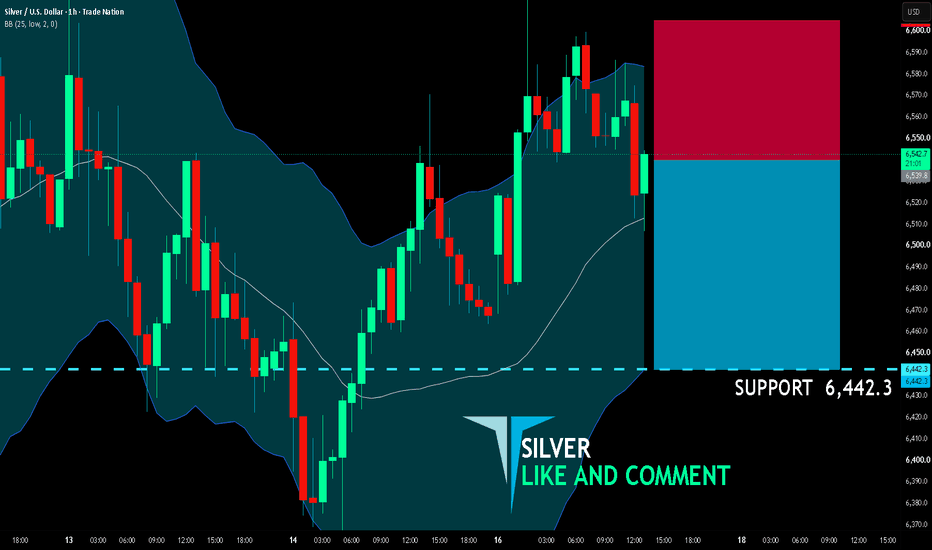
SILVER SELLERS WILL DOMINATE THE MARKET|SHORT
SILVER SIGNAL
Trade Direction: short
Entry Level: 6,539.8
Target Level: 6,442.3
Stop Loss: 6,604.9
RISK PROFILE
Risk level: medium
Suggested risk: 1%
Timeframe: 1h
Disclosure: I am part of Trade Nation's Influencer program and receive a monthly fee for using their TradingView charts in my analysis.
✅LIKE AND COMMENT MY IDEAS✅
17/08/26 Weekly OutlookLast weeks high: $65,393.94
Last weeks low: $62,539.20
Midpoint: $63,966.57
Last week faded from the $65,393 high down to the $62,539 weekly low on an in-line-CPI sell-the-news event. July CPI landed in-line (3.4% headline), trimming September hike odds to ~38% but offering no breakout fuel.
The low held and BTC is now bouncing, reclaiming the $63,252 (0.25) level and eyeing the $63,966 midpoint.
The low time frame is apathetic and low-volume, perpetual futures activity hit a three-year low so this is chop, not a trend. The bigger picture stays capped at $66,000 as has been the case for BTC since the beginning of June. Without a serious move with conviction above that key level, more of the same is on the horizon.
Bull case: The weekly low held, ETF inflows were the strongest since April ($853M, IBIT-led), whale balances hit a 2026 high, and in-line CPI removed inflation tail risk — enough for a push back toward $65,800 if the midpoint reclaims.
Bear case: Rejection of the Midpoint and a move lower towards weekly low and below. Long-term-holder capitulation, and dead volume favour a fade toward $62,539, then the $57,700 2026 low.
NZD/CAD BEARISH BIAS RIGHT NOW| SHORT
Hello, Friends!
We are targeting the 0.812 level area with our short trade on NZD/CAD which is based on the fact that the pair is overbought on the BB band scale and is also approaching a resistance line above thus going us a good entry option.
Disclosure: I am part of Trade Nation's Influencer program and receive a monthly fee for using their TradingView charts in my analysis.
✅LIKE AND COMMENT MY IDEAS✅
NZD/JPY BEST PLACE TO SELL FROM|SHORT
NZD/JPY SIGNAL
Trade Direction: short
Entry Level: 94.056
Target Level: 93.709
Stop Loss: 94.286
RISK PROFILE
Risk level: medium
Suggested risk: 1%
Timeframe: 1h
Disclosure: I am part of Trade Nation's Influencer program and receive a monthly fee for using their TradingView charts in my analysis.
✅LIKE AND COMMENT MY IDEAS✅
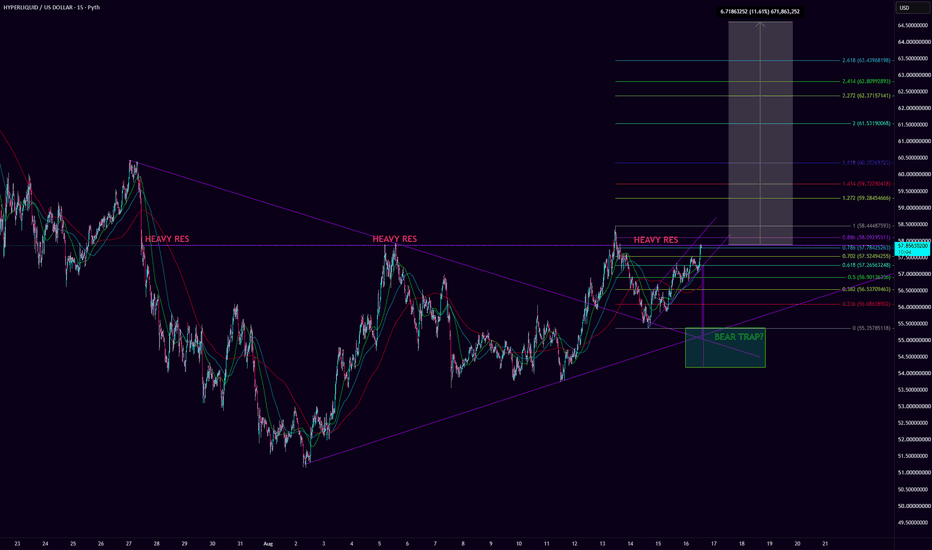
HYPE — Breakout or Savage Shakeout?HYPE is currently testing the 0.786 local Fibonacci retracement, which is a critical level to watch.
Price has already broken out of a large pennant pattern and came back to backtest the breakout cleanly. At the same time, a potentially much larger ascending triangle appears to be forming, giving the structure an interesting bullish setup.
The key question is what happens here.
If HYPE can reclaim and hold above the 0.786, I think the next leg higher could begin quickly, with the higher Fibonacci extensions becoming the next targets.
However, if we get rejected at this level, I wouldn't be surprised by a savage shakeout. A deeper move could retest the bear-trap box, which lines up with the measured move from the larger bear flag.
So I'm watching two scenarios:
Bullish: Break through resistance → confirm the breakout → continuation higher.
Bearish/shakeout: Rejection at the 0.786 → deeper retracement → potential sweep into the bear-trap zone → reversal.
Either we break out now, or we get one hell of a shakeout first.
The next move should be very telling.
SPY BEARS ARE STRONG HERE|SHORT
SPY SIGNAL
Trade Direction: short
Entry Level: 776.31
Target Level: 751.50
Stop Loss: 792.89
RISK PROFILE
Risk level: medium
Suggested risk: 1%
Timeframe: 9h
Disclosure: I am part of Trade Nation's Influencer program and receive a monthly fee for using their TradingView charts in my analysis.
✅LIKE AND COMMENT MY IDEAS✅
AUD/JPY SHORT FROM RESISTANCE
Hello, Friends!
AUD/JPY is making a bullish rebound on the 9H TF and is nearing the resistance line above while we are generally bearish biased on the pair due to our previous 1W candle analysis, thus making a trend-following short a good option for us with the target being the 111.761 level.
Disclosure: I am part of Trade Nation's Influencer program and receive a monthly fee for using their TradingView charts in my analysis.
✅LIKE AND COMMENT MY IDEAS✅
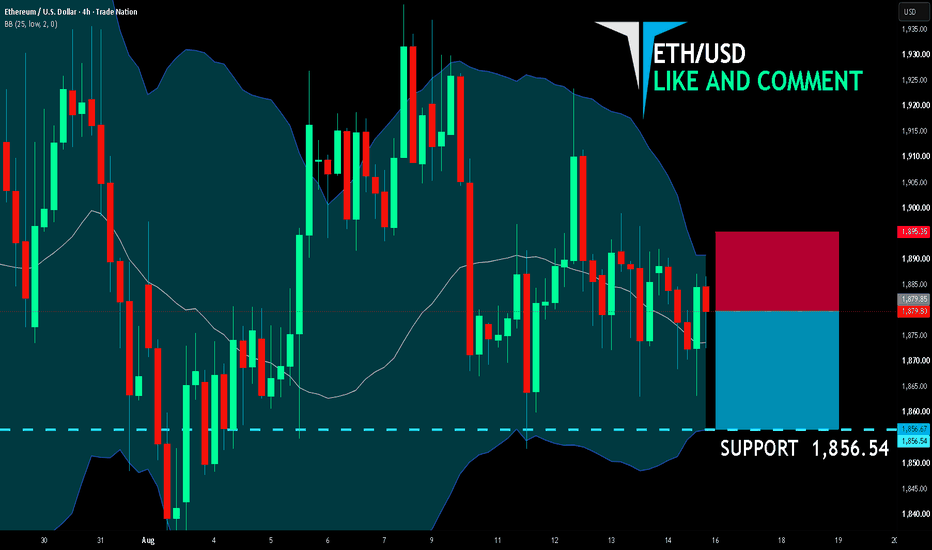
ETH/USD BEARS WILL DOMINATE THE MARKET|SHORT
ETHUSD SIGNAL
Trade Direction: short
Entry Level: 1,879.85
Target Level: 1,856.54
Stop Loss: 1,895.35
RISK PROFILE
Risk level: medium
Suggested risk: 1%
Timeframe: 4h
Disclosure: I am part of Trade Nation's Influencer program and receive a monthly fee for using their TradingView charts in my analysis.
✅LIKE AND COMMENT MY IDEAS✅
US Dollar Index (DXY) Extends Weakness as Bearish Trend ResumesAs expected this week, the US Dollar Index (DXY) continues to weaken as US Treasury bonds recover on growing expectations that the Federal Reserve will keep interest rates unchanged. At the same time, strong gains in global equities are reinforcing a risk-on environment, further reducing demand for the safe-haven US dollar.
From an Elliott Wave perspective, DXY appears to have completed a projected abc irregular flat, or alternatively a more complex wxy correction, in wave "iv". The latest downside move suggests that wave "v" is now underway, signaling the potential for another impulsive leg lower.
As long as the index remains below recent resistance, the bearish outlook remains intact. Wave "v" could continue to extend into next week, keeping pressure on the US dollar while supporting risk assets, precious metals, and commodity-linked currencies.
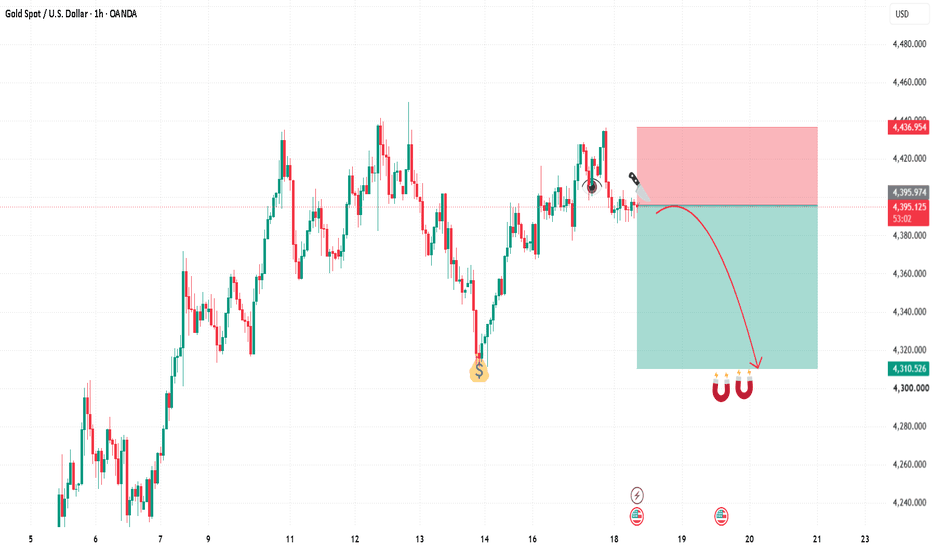
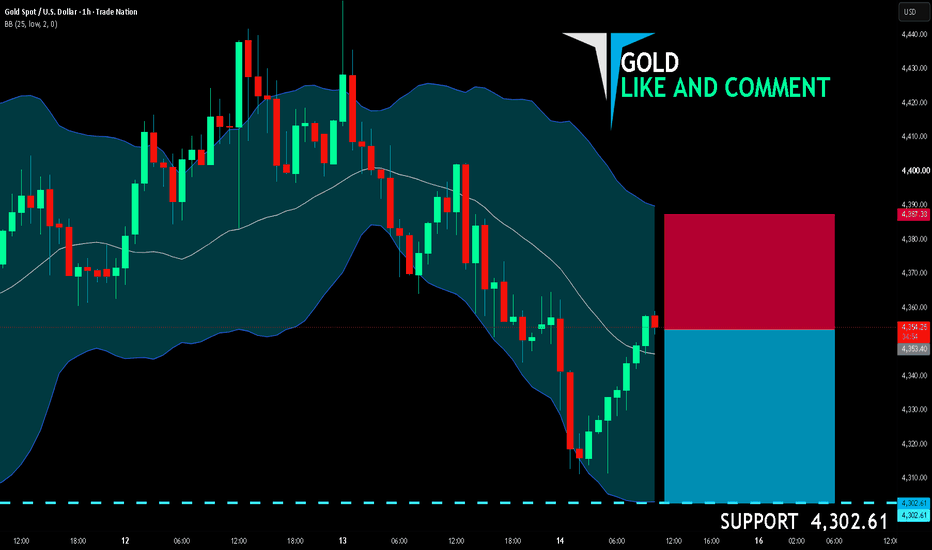
GOLD BEARISH BIAS RIGHT NOW| SHORT
GOLD SIGNAL
Trade Direction: short
Entry Level: 4,353.40
Target Level: 4,302.61
Stop Loss: 4,387.33
RISK PROFILE
Risk level: medium
Suggested risk: 1%
Timeframe: 1h
Disclosure: I am part of Trade Nation's Influencer program and receive a monthly fee for using their TradingView charts in my analysis.
✅LIKE AND COMMENT MY IDEAS✅
NZD/USD BEST PLACE TO SELL FROM|SHORT
Hello, Friends!
NZD/USD pair is in the uptrend because previous week’s candle is green, while the price is obviously rising on the 4H timeframe. And after the retest of the resistance line above I believe we will see a move down towards the target below at 0.582 because the pair overbought due to its proximity to the upper BB band and a bearish correction is likely.
Disclosure: I am part of Trade Nation's Influencer program and receive a monthly fee for using their TradingView charts in my analysis.
✅LIKE AND COMMENT MY IDEAS✅
EUR/USD BEARS ARE STRONG HERE|SHORT
EUR/USD SIGNAL
Trade Direction: short
Entry Level: 1.154
Target Level: 1.152
Stop Loss: 1.155
RISK PROFILE
Risk level: medium
Suggested risk: 1%
Timeframe: 1h
Disclosure: I am part of Trade Nation's Influencer program and receive a monthly fee for using their TradingView charts in my analysis.
✅LIKE AND COMMENT MY IDEAS✅