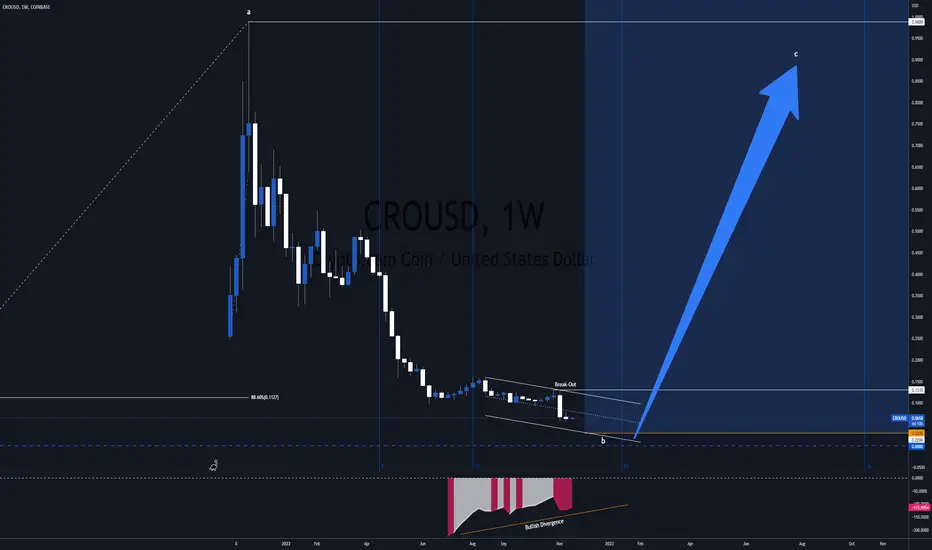
Bullish Divergence
Cronos CRO In Trouble - BUY & HODLCronos can go bust, but even so, it's on Sale.
CROUSD / CROUSDT will go straight bull at one point.
So, I am still buying these poopy coins on each major fall they have.
Yeah, that's what I do.. putting my money into a black hole.
My next good BUY LEVEL: $0.03 .
Who knows, maybe I'll actually get rich.
My Technicals on CRO:
* Elliott Wave A-B-C Pattern
* Fibonacci Retracements
* Fibonacci Time Zones
* Double Bottom
* Cycle Analysis
* Bullish Divergence
Fibonacci Time Zones tell me that t
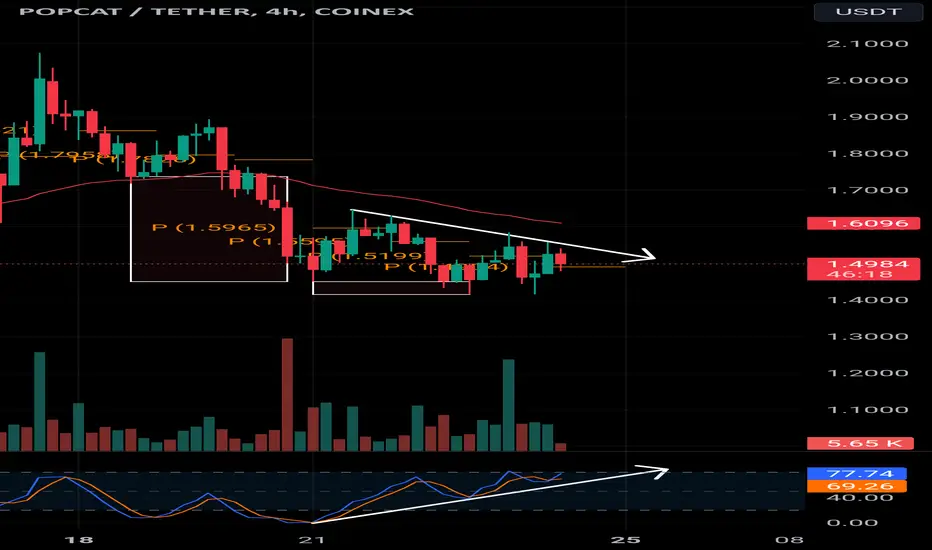
POPcat Bullish divergence When analyzing potential reversals, I typically look for a few key signals and indicators. First, I check for signs of losing momentum. Next, I observe if the price action is above the Daily Pivot while remaining below the 50 MA, as this suggests the reversal isn’t confirmed yet. Additionally, the overall market sentiment is currently extremely bullish, which further indicates that a reversal may be imminent.
ETH to $25K - No Joke - BUY & HODLEthereum is at levels not seen since the Crypto Stone Age.
The Crypto Markets will start BOOMING!
ETH ( ETHUSD , ETHUSDT , ETHEUR ) is getting ready to go Bullish.
When? Early '23.
The Fibonacci Time Zones and Cycles tell me that the 3rd Fibonacci Summation is NOW.
So, I reckon Cryptos are getting ready for something BIG.
I do see a last drop before that though.
From Jan '18 until Dec '18 ETH had a whooping 94% crash.
We're only at 82% from Nov '21 top. So I am waiting with buying interest
Bitcoin BTC to $250K - BUY & HODLBitcoin went to the Moon with Dec '17 top.
Then it corrected 88.6% on the Fibonacci Retracement with Dec '18 bottom.
After that it went to Mars and hit the tops again in Nov '21.
It was a 2000% gain.
What can you tell from this?
Percentage-wise, Correction is lower than the gain.
So, the Dominant Trend for BTCUSD is UP!
OK, back to Earth.
Let's gather fuel and power-up the rocket.
Time to go Interstellar.
Before I go into the technical stuff, allow me to keep things simple for you.
I took t
GBPUSD Trade PlanChart shows a bullish divergence between price and RSI, alongside an inverse head and shoulders pattern, indicating a potential bullish reversal.
The trade setup suggests a buy stop above the neckline at 1.27268, with a stop loss at 1.25861 (below the lower low).
Profit targets are TP1 at 1.28680 (first resistance) and TP2 at 1.30080 (higher resistance).
Ensure confirmation with a strong breakout above the neckline.
Partial profits can be taken at TP1, moving the stop loss to breakeven f
CXW Inverse Head and Shoulder + Bullish Divergence!Hey Folks!
Not a fundamental analysis or financial advice, but trading idea on why it could do well in the coming months and beyond. I have discovered a technical repeat pattern in this one. I first found this stock after Trump made his statement regarding large deportations if elected. So naturally I look up prison stocks lol.
I made a nice trade on it last time it dipped and reversed, and I want to bring it to everyone's attention.
The overall pattern is shaping up nicely for a big move
Educational post BTC bullish divergence.You need to use RSI indicator. That's how I spotted the reversal.
Bullish divergence.
Bullish divergence happens when the price makes lower lows, but an indicator (like RSI or MACD) makes higher lows, suggesting weakening downward momentum and a potential upward reversal.
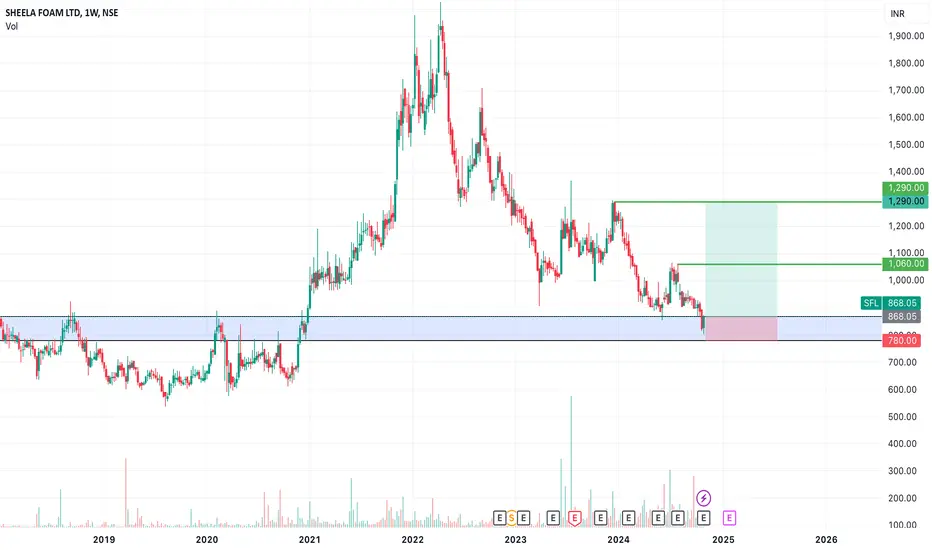
SWING IDEA - SHEELA FOAMSheela Foam , a key player in the Indian mattress and foam market, presents a potential swing trading setup.
Reasons are listed below :
800-850 Support Zone : This strong support level is holding, indicating possible resistance to further downside.
Bullish Hammer Candle on Weekly Timeframe : This pattern suggests a reversal of bearish momentum and renewed buying interest.
Gradual Rise in Volumes : Increasing volumes support the potential for a sustained upward move, reflecting growing inve
BHEL Bears Dominate – TP1 Hit, More Downside Expected!Technical Analysis: BHEL (Bharat Heavy Electricals Ltd) – 1D Timeframe (Short Trade)
We initiated a short trade on BHEL at 288.71 on 2nd September 2024, using the daily timeframe. The first target (TP1) at 259.89 has already been hit, and we are now looking ahead for further bearish momentum.
Key Levels
Entry: 288.71 – The trade was initiated following bearish signals and strong confirmation for a downward move.
Stop-Loss (SL): 312.03 – Positioned above the entry to manage risk and prote
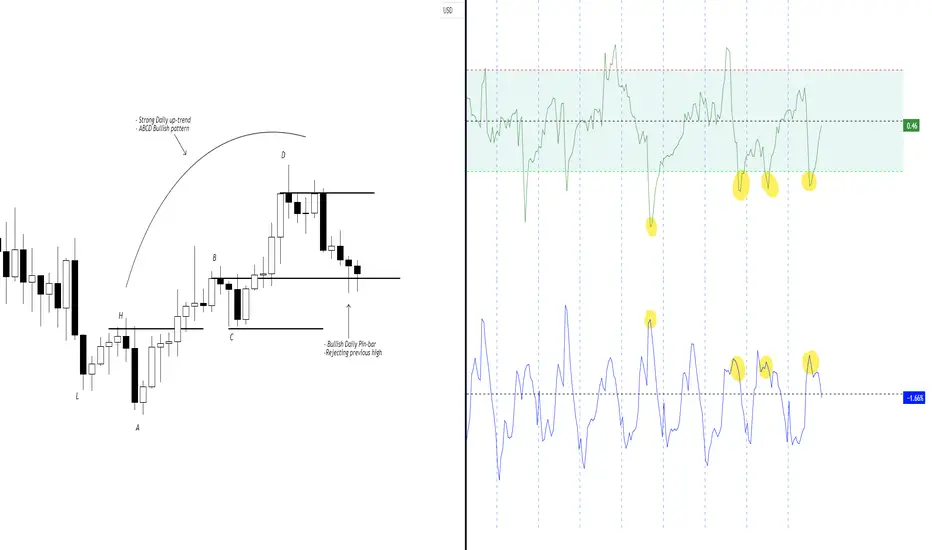
Strong EUR? - A EUR/USD AnalysisEUR/USD has displayed bullish characteristics over the last couple of weeks.
- We have reach a high in the market @ 1.095.
- This high was made after a bullish A,B,C,D pattern aka (Trend).
- In bullish markets, prices tend to find support at the previous high, the previous high in this market (To me) is @ 1.085.
- We currently have made a bullish pin bar rejection candle on 3/19/2024.
- Currently we have untapped orders at 1.098, this is where I believe prices want to go in the next month.
- Br
EUR/USD Builds Bullish Momentum with Strong Support and Pin BarAfter bottoming at 1.0760 exactly one week ago, FX:EURUSD has started to consolidate, forming what appears to be a base.
Since then, dips below 1.08 have been consistently bought up, culminating in a strong bullish Pin Bar candle yesterday.
To further support this bullish outlook, this base is forming at a key confluence of support levels, reinforcing the potential for an upward move.
With this in mind, I am looking to buy this pair, ideally on a dip, to ensure a positive risk-to-reward ra
Will Three White Soldiers Lead the Way?OANDA:XAUUSD Analysis
4H Chart
Current Price: 2447.215
Analysis Summary
• Three White Soldiers Pattern
• Volume Analysis
• Overbought and Resistance Zone
• Overall Bullish Trend
Three White Soldiers:
The chart shows a clear Three White Soldiers pattern, a strong bullish reversal candlestick formation indicating potential upward momentum. This pattern suggests consistent buying interest, as each candle closes higher than the previous one, signaling sustained demand.
Volume Analys
DIXON Short Setup: Evening Star & Potential HNS with Trendline Weekly Analysis
Pattern Observed: Evening Star on Weekly Timeframe
Additional Insights
- The Evening Star pattern tends to be more reliable on Daily and Weekly timeframes, making this setup particularly noteworthy for swing traders.
Trade Setup
1. Entry: Enter after a decisive break below the low of the third (red) candle in the Evening Star pattern.
- Alternatively, you may enter on the fourth candle if it signals a reversal, with a stop loss set according to your risk tolerance.
SWING IDEA - ANAND RATHI WEALTH LTDAnand Rathi Wealth Ltd , a leading wealth management company in India offering financial advisory services, is presenting a potential swing trading opportunity.
Reasons are listed below:
4300 Zone Breakout : The 4300 level has been tested multiple times, and the stock is now breaking out, suggesting renewed buying interest.
Bullish Engulfing Candle on Daily Timeframe : A bullish engulfing pattern has formed on the daily chart, indicating strong upward momentum.
Breaking Consolidation Zone
Understanding Bullish Engulfing Candlestick PatternThe Bullish Engulfing Candlestick Pattern is a popular price action signal used by traders to identify potential trend reversals in the market. If you're keen on mastering price action trading, understanding this pattern is essential. This guide will take you from the basics of the pattern to advanced insights, with easy-to-understand explanations to help you become more confident in your trading decisions.
What is a Bullish Engulfing Candlestick?
A bullish engulfing candlestick is a two-cand
Goatseus Maximus(GOAT) Ready to FALL!!!(Alert)!!!Today, I want to analyze the Goatseus Maximus(GOAT) memecoin, which has increased almost 😱+1500%😱 in less than 12 days .
What is Goatseus Maximus (GOAT)!?
Goatseus Maximus (GOAT) is a meme coin within the Solana( BINANCE:SOLUSDT ) ecosystem, which has gained significant attention due to its AI-driven features and strong community backing. Its recent surge in price has been driven by multiple factors, including listings on major exchanges.
⚠️Regarding the GOAT memecoin , I must warn
BITCOIN → False Breakout & Bearish Engulfment ↓ BINANCE:BTCUSD entered a strong buying zone (68900) within the rally. BUT, the expected growth did not happen, the bulls could not realize the potential. A bearish engulfment of the last three bars is formed and actually - a false breakdown of the descending resistance...
The growth formed from 59K is partly connected with the election race in the USA, economic revival in China, as well as economic news. But apparently, this energy is not yet enough for the price to easily overcome 68-69K