 Short
ShortDoji
Short
Gold DailyGood short opportunities after a Monday of possible contraction of the asset. The last daily candle rejected by a strong supply indicates bearish continuation; the area between the current low and the 50% retracement appears to be an excellent rangebound area therefore contraction zones could be created before the descent. In the event of a bearish breakout, a retest zone before the short trend is desirable


📈🚀 Seize the Moment: Epic Buying Opportunity on S&P 500! 📈🚀Hey traders, get ready to ride the wave of profits with an exciting setup on the S&P 500! 🌊📊 A golden opportunity has surfaced, and it's time to capitalize on a potential bullish rally. In the 4-hour timeframe, we're witnessing the stars aligning for a buying spree that could lead us straight to the coveted 4570 target. 🎯🦅
The Double Bottom Delight:
Hold tight as the price action unveils a mesmerizing double bottom formation. This pattern is like a green light for bullish momentum, signaling a
 Long
Long
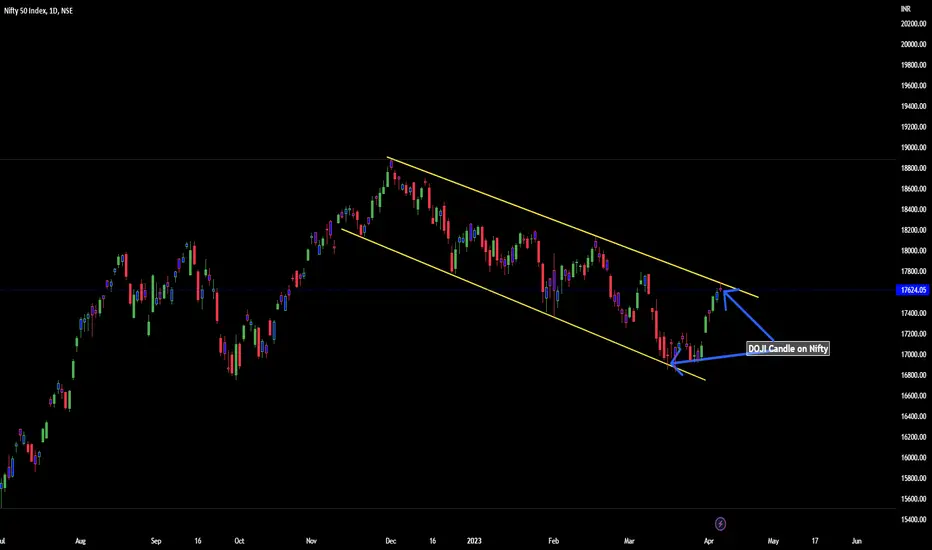
Market is indecisive as it gave a perfect Doji. The market today gave a positive closing above 50 days EMA which was at 19285 which was a good sign but the candle that we saw today was a DOJI candle or a Perfect DOJI candle. This means that the market is indecisive. Only if the support at 19285 is held tomorrow or for the reminder of the week, Nifty can think of a recovery. Supports on the lower side for Market are 19285, 19229, 19145 and 19024. Below 19024 the market can fall upto the levels of 18861 or more. On the upper side the resistance


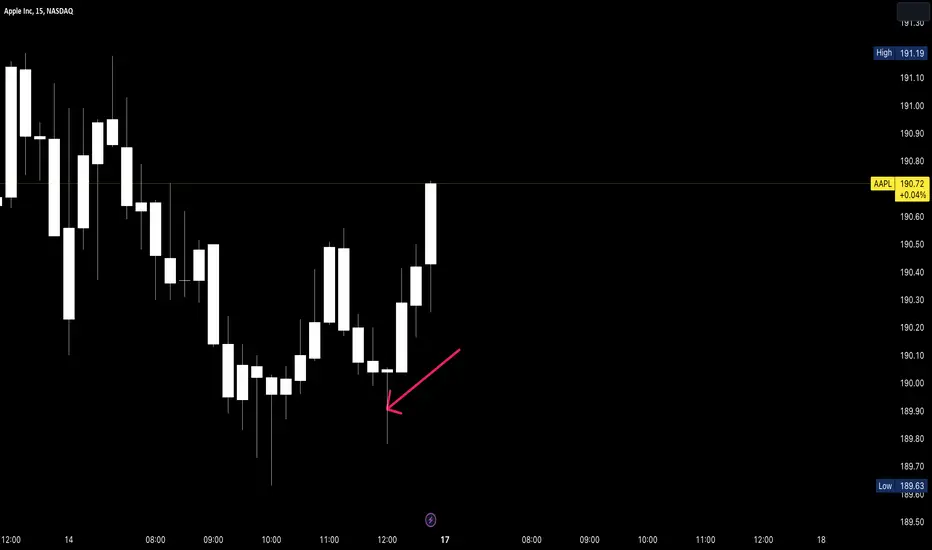
Japanese Candlesticks - Doji CandlesAs traders, if we want to improve our technical analysis knowledge to better develop our price action skills, we owe it to ourselves to grasp candlestick patterns, in this case the Doji candlestick pattern.
This post will go into further detail about this unique candlestick group and will also explain the psychology behind these patterns and how they can affect future price movements in the market.
Before we go into further detail about doji candles, there are times this post will mention the

 Education
FrogAlgo: A Dragonfly Doji A Dragonfly Doji is a candlestick pattern characterized by a long wick or shadow that is significantly longer than its body. It is considered a type of doji, where the opening and closing prices are very close together.
The presence of a large wick indicates a wide trading range during the time period of the candle, while the small body represents minimal difference between the opening and closing prices. This pattern occurs when the open, close, and high prices of the candle are close or even

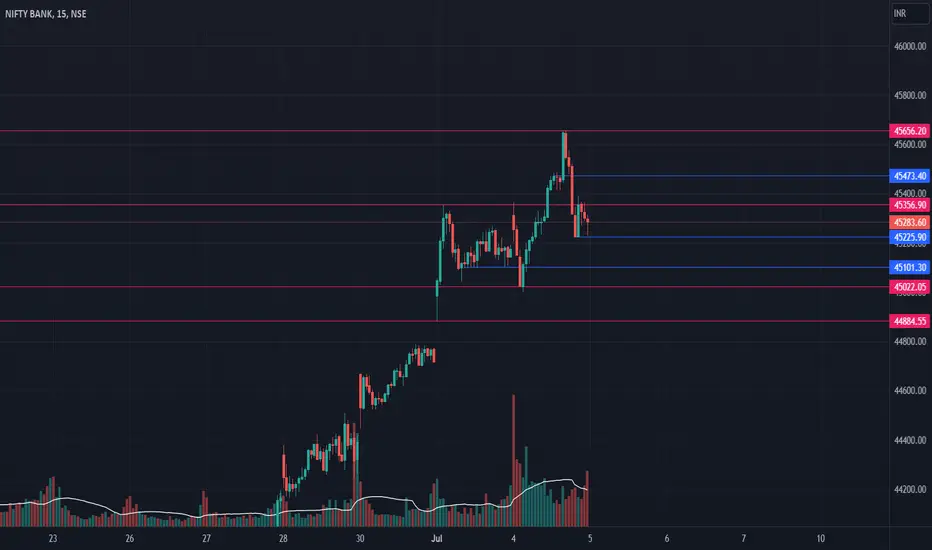
BankNifty Analysis: Indecision with Bulls and Bears in ControlBased on the provided chart analysis, here is a revised summary of the current market situation:
On the daily timeframe, the market formed a perfect Doji candlestick, indicating indecision among market participants. It opened within the previous day's high and fell to 45000, where it found support and staged a recovery in a V-shaped pattern. The market then rallied to 45651 but subsequently fell again in a V-shaped pattern. This double reversal suggests both bears and bulls are strong, seizing

Shree Cement: Ascending Triangle Breakout and RetestShree Cement(stock symbol: SHREECEM) has been forming an ascending triangle pattern since April 2022, but recently it broke the pattern with a gap down. However, it managed to recover and is currently retesting the lower trendline. During this retesting phase, the stock is forming dojis, which could potentially act as a trigger for a further move. To implement a trading strategy, a stop-loss (SL) could be placed above the high of the doji, while the target levels are set at 22,623 as the first t
 Short
Short
usdjpy reversal signal at retest highAfter a 1 hour variation of an evening star during the London session this morning, I was alert during the New York session to see if price would be strong enough to push beyond its latest high; especially after a bullish engulfing. Price merely closed off with some buy exhaustion only to followed by a doji. This set-up looks like a false break of a major resistance level which is why I decided to take advantage of the retest during the best time of the day. Although the dollar yen is still over
 Short
Short
USDJPY ceases to create lower lowsAfter an indecision pullback to retest a 4H bullish engulfing, I took a long position based on the higher high and retest of the 30MIN. I'm taking long positions based on the 23.6 retracement of the daily chart. I expect for price to continue to make higher highs as I believe this uptrend is still strong.
Long
Double top formed near the ATH is breaking downBy March '23 gold did a strong breakout near the 2000 quote.
After that, the prices did not continue to flow and stucked inside a congestion at that level.
At 04 May '23 the prices tried to overpass the previous top but failed.
This failure gave us a doji candle, at the previous top, a very bearish signal, and besides that, it also gave us a double top formation.
The congestion kept going for some more days until a sequence of bearish candles appeared (16 to 18 May '23) breaking down the supp
Short

📊 The Doji Candle Pattern📍What is the Doji Candlestick Pattern?
The Doji Candlestick Pattern refers to a chart pattern consisting of a single candle. This pattern appears when the opening and closing prices of a candle are nearly the same or identical, resulting in a small-bodied candle with upper and lower wicks resembling a "+". Different variations of Doji patterns exist, with unique names like the Long-legged Doji, Gravestone Doji, Dragonfly Doji, and Doji star candlestick pattern. Regardless of the type, all Doji
Education
Doji Candlestick Pattern : Educational1/ The Doji Candlestick pattern is a popular chart pattern in technical analysis. It is formed when the opening and closing price of a financial asset are almost the same, resulting in a candlestick with a very small real body.
2/ The Doji Candlestick pattern is significant because it suggests indecision in the market. It can occur at the end of an uptrend, downtrend, or in a consolidation period. Traders often use it to identify potential trend reversals.
3/ There are different types of Doji
1W BTC Candlestick and Wave AnalysisI continue to be bearish and, by all my logic and knowledge, think that this market has been heavily manipulated since the Genesis bankruptcy.
Just think about it. The moment when the biggest crypto lender needs to liquidate their assets, the price goes up.
Also, if you follow the social metric, you know that creators of the crypto content are struggling to get new views.
And then, we have Elon changing the Twitter logo and pumping the DOGE, and the last time he did it, he pumped and dumped
Short
EURUSD : Bear's Can fight Back from major resistance OANDA:EURUSD
Hi , trader's .. As per technical analysis , it's visible that market is near to major resistance
price can possibly form double top which can lead market to downside
As price reject from this important resistance there is possible chance of Hanging man or doji candle formation
Any reversal shape candle will be helpful for bear's to take there selling position's
❤️Please, support my work with follow ,share and like, thank you!❤️
Short
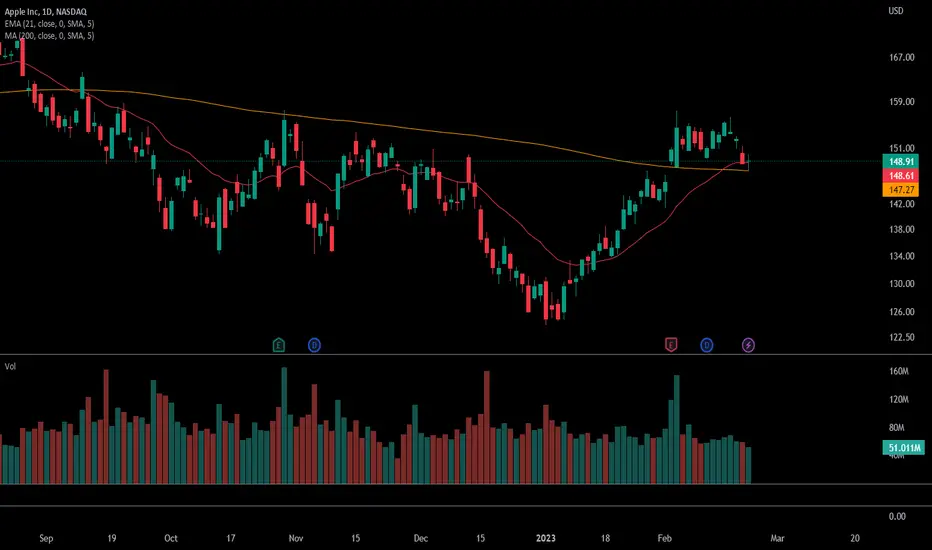
DOJI CANDLE ON THE $AAPL DAILY CHARTYesterday's choppiness & market direction indecision in the tech sector can be summarized by this DOJI candle on the APPLE daily chart formed off the 200 day MA and closed just above the 21 EMA. Possible reversal to retest and break $150: LONG. Level of support of 146.75 area, break below: SHORT
MicroStrategy time to get in for a swing$MSTR is approaching a double bottom and printing a doji candle on the daily time frame. A visit to the trendline is very likely.
NOT A FINANCIAL ADVISE
 Long
Long
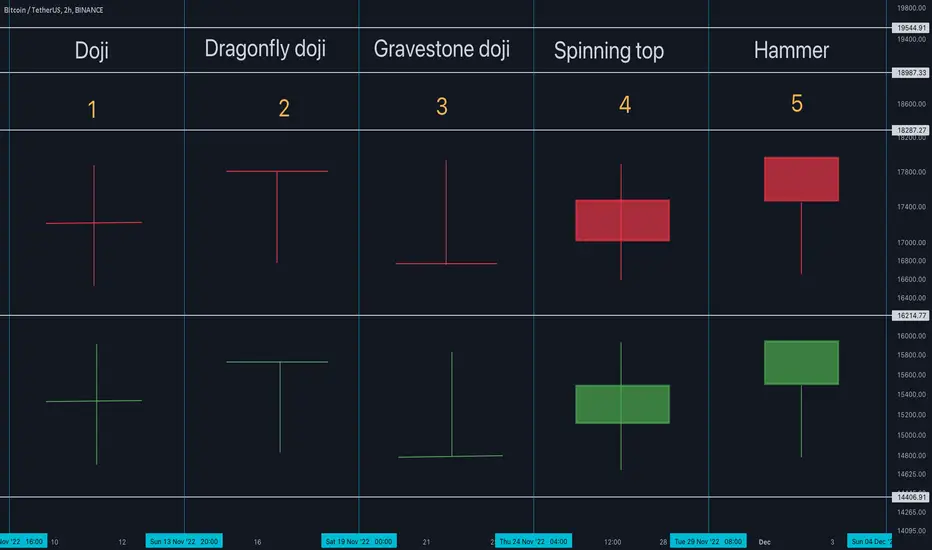
5 Most Powerful Single Candlestick PatternsHello, welcome to this Type of 5 Most Powerful Single Candlestick Patterns
I have tried to bring the best possible outcome to this Candlestick Patterns update
Type of 5 Candlestick Patterns:-
1) Doji:-Considered to be one of the most important single candlestick patterns, the Doji can give you an insight into the market sentiment. Dojis are said to be formed when the opening price and the closing price of a stock are the same. Since the opening price equals the closing price, these candlesti
TQQQ Short Back To $17I think we are over bought! Prices have halted with a spinning top doji having formed and a candle after to confirm a possible pullback. We have room to drop back to the high volume node at $17 where smart money will make the next decision on direction. Not financial advice , DYOR
 Short
Short
XU Sell placed trade once price went below lowest line for dba's. My alert was set and I was happy with the execution of today’s market structure.
scaling down to 5 Min TF, price action gave mea clearer indication that price was indeed dropping.
Short
XAUUSD Short term bearishAs i see in the chart, the was a bullish leg before the triangle breakout and i drew another leg excactly the same height as the last one. because last candle was a doji shaped and latest candle is closing like a pin bar and we are far away from Moving Average, I think there might be a short term bearish trend on Gold , unless today's candle doesn't close as a pin bar. or 1 other think that cancels this scenario is that tommorow's candle closes above high of last 3 candle and form an Engulfing C

INTC daily wave 2 of uptrendINTC daily wave 2 of uptrend probably I'm already in you can move your entry above next day candle if it closes above today's doji and completes morning star reversal.
 Long
Long