NZDCAD Target Price 0.86228 (2H Chart)NZDCAD Entry Price 0.85802 Take Profit Price 0.86228 Longby TradeLive-21
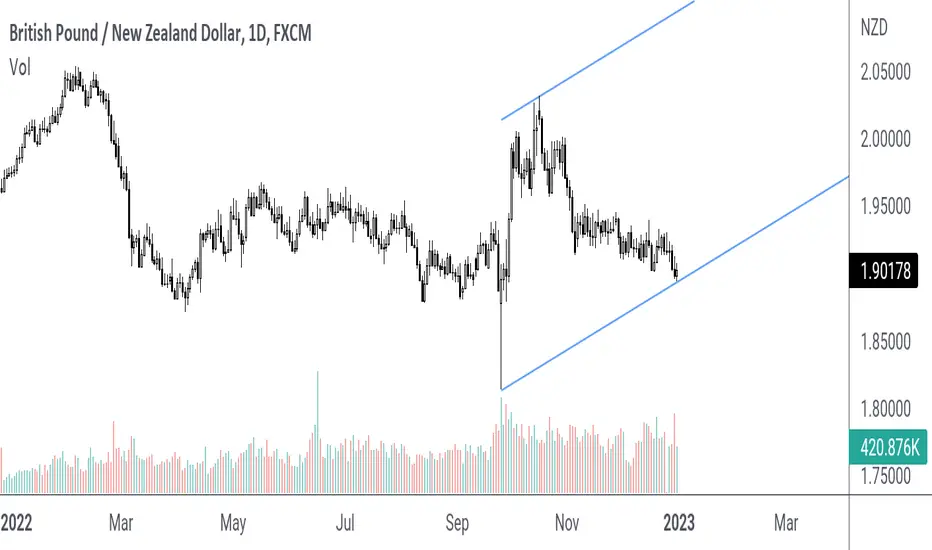
GBPNZD | Parallel Channel | Daily Time Frame GBPNZD Entry Price 1.90178 Take Profit Price 2.03180 Longby TradeLive-11
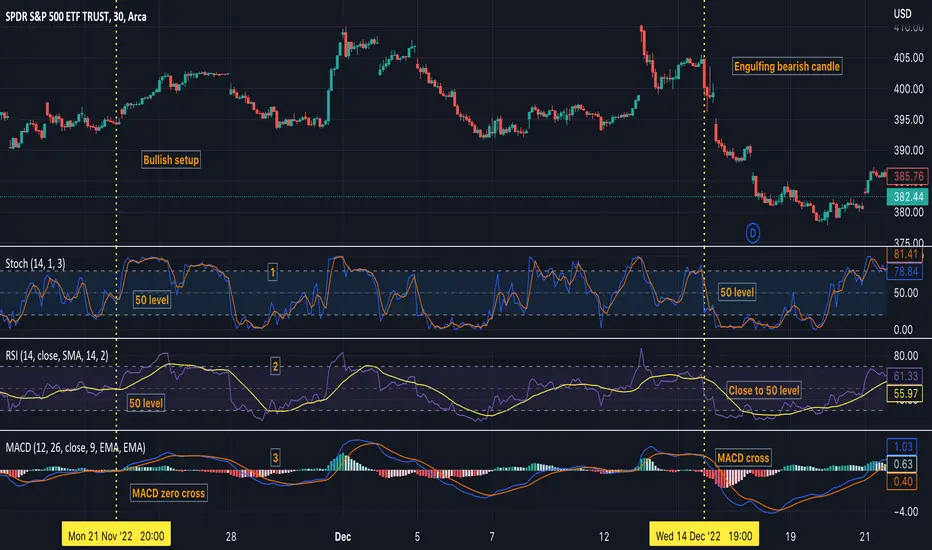
Stochastic + RSI + MACD zero cross strategy from backtest on SPYStrategy 1. Stochastic cross at 50 level 2. RSI cross at 50 level 3. MACD cross at 0 level 4. Engulfing Candlestick? 5. Level 2 Tape sentiment balance (Optional) Technical Analysis It's a simple technical analysis setup strategy for bullish or bearish trading setup in both bullish and bearish sentiment scenarios. All levels in the indicators are at standard default settings. Step One: Look at the Stochastic indicator cross at 50 level and a cross over the signal line. This will be the Educationby ashpat862
Trading Series – The ManagementMost of us will spend about 90% of our time thinking of what to buy and at what price we should get in. In fact, that is only 10% of work done. Focus on this scenario instead - “After getting into a position, how are we going to manage it with either a calculated loss when market go against us or how should we take profits when market perform better than our expectation? As usual we will do a few case studies on how I manage my positions for this year. Today’s content: 1. 90% of us – SpendShort13:16by konhow3
"Biting Point" Signal in Every Turn for 2022Stay-tune for the video version shortly, we will do more in-depth study. Micro E-Mini Nasdaq Futures Minimum fluctuation 0.25 point = $0.5 1 point = $2 10 points = $20 100 points = $200 Disclaimer: • What presented here is not a recommendation, please consult your licensed broker. • Our mission is to create lateral thinking skills for every investor and trader, knowing when to take a calculated risk with market uncertainty and a bolder risk when opportunity arises. CME Real-time Market Data Shortby konhow14
Nice SPY trade todayTook a nice SPY trade today, will be posting another video of all the other trades I took as I made about 5% profit today from my total account balance. Not too bad if you ask me. If you wanna just see why I entered here it is: close above 200 EMA and 50 EMA increasing volume heading into point Also this close was above the 5 min 14 EMA resistance and 14 EMA resistance on 15 min previous candle on 15 min was engulfing with more volume at a key support and bounced off 50 BT cloud flip on 5 min aLong06:32by kaiz3nfx3
GOING SHORT IN XAGUSD BY TRADING STRATEGYBearish Indications 1. Trend is Mature Enough 2. Bearish Engulfing 3. Retest Resistance Level 4. Bearish ABCD Pattern 5. Bearish Divergence Bullish Indications 1. Dow Theory Higher Highs and Lows 2. If it breaks the resistance it will continue its rally 3. According to seasonal data silver remains bullish in December Shortby hassamsaeed2
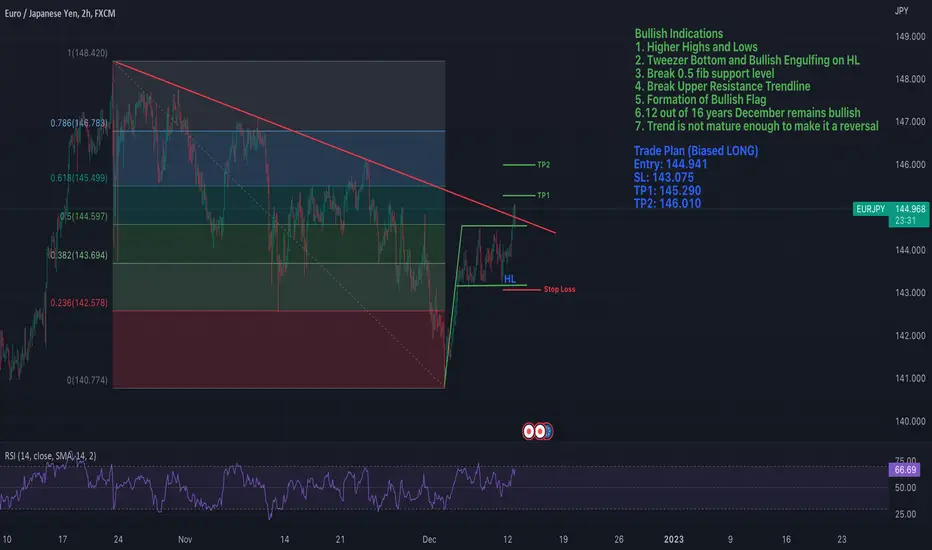
Going LONG EURJPY By Trading StrategyBullish Indications 1. Higher Highs and Lows 2. Tweezer Bottom and Bullish Engulfing on HL 3. Break 0.5 fib support level 4. Break Upper Resistance Trendline 5. Formation of Bullish Flag 6.12 out of 16 years December remains bullish 7. Trend is not mature enough to make it a reversal Seasonal Data for the Past 15-16 Years Dec-06 => Green Dec-07 => Green Dec-08 => Green Dec-09 => Green Dec-10 => Red Dec-11 => Red Dec-12 => Green Dec-13 => Green Dec-14 => Red Dec-15 => Green Dec-16 => Green Dec-1Longby hassamsaeed1
THE ENGULFING CANDLE LIQUIDITY EntrySo let's learn something about engulfing candles entries. An engulfing candle is usually a momentum candle and in most cases signifies reversal and at times trend continuation. Now what you do is plot your fib on the engulfing candle from wick to wick and mark the 40-50% retracement area which becomes a potential supply liquidity zone to sell from a bearish engulfing and a demand liquidity zone to buy from a bullish engulfing. In short 90%+ of the time price will retrace back to these zones befoEducationby JayForexAcademy10
DJI/ SPX - expect near term volatilityWith FOMC uncertainty coming up this week, and the indices hitting into near term trendline resistence, some volatility will not be surprising in the next few days. Among the 3 indices, DJI has been the strongest of late. On the monthly timeframe, we can see a few rather bullish signs: 1. a "tweezer bottoms" 2. bullish engulfing candlestick 3. bullish divergence between price and RSI playing out. However, divergences usually translate into just a short term reversal (lasting 1-3 candlesticksby JuliacUpdated 116
XAUUSD Short term bearishAs i see in the chart, the was a bullish leg before the triangle breakout and i drew another leg excactly the same height as the last one. because last candle was a doji shaped and latest candle is closing like a pin bar and we are far away from Moving Average, I think there might be a short term bearish trend on Gold , unless today's candle doesn't close as a pin bar. or 1 other think that cancels this scenario is that tommorow's candle closes above high of last 3 candle and form an Engulfing Cby hoseinharamiUpdated 1
USDCHF LONG TRADETrade Order: Buy Live Execution at market price. Entry: 0.9440 Stop-Loss: 0.9390 (50pips). Target: Open.Longby LCFXproUpdated 5
UPS daily bearish engulfing hammers wave 5 of wave COrder SELL UPS NYSE Stop 165.76 LMT 165.76 will be automatically canceled at 20230401 01:00:00 EST UPS daily bearish engulfing hammers wave 5 of wave C take profit to MA 200 weekly and that's may be it for UPS correction.Shortby MishaSuvorovUpdated 20
And another indication the BULL market is about to startOctober 2022 is closing with an bullish engulfing candle which it has done several time before! Also MACD is showing positive momentum (histogram). Ready? Set GoLongby Indicator-Jones1010
MSFT- found intermediate supportMSFT gapped down into intermediate support @ 220 today (after another round of "bad" CPI report that spooked the markets) but immediately reversed to form a bullish engulfing candle on the daily chart (and a potential pin bar on weekly chart). Bullish divergence can be seen on both the weekly and daily charts which gave more conviction to this current support @ 220 (medium term resistence turned support) Granted that a bounce from an bullish divergence can be just a short term counter trend (iby JuliacUpdated 2
Bearish Engulfing on EXXA bearish engulfing candle pattern has formed on JSE:EXX . This candle pattern also coincides with the top of a downward channel that it has been trading in for the last month. We can anticipate a move towards the bottom of the channel at around the 182 level.Shortby RossLarter34
EURNZD Daily Bullish Engulfing Daily bullish engulfing pattern formed around the 20EMA of EURNZD. With this candlestick pattern it is more likely that EURNZD will continue it's uptrend.Longby Aperna0
SPX - this rally could have legsDespite that bullish engulfing candle with strong volume on 13 Oct, the market continued to climb a wall of worry for the next 5 days. However last Friday's strong close is a "follow through" day that added to my conviction that this rally could last a fair bit. On the Monthly Chart (not shown here): A potential "bullish piercing candle" (monthly ) will be formed if by the end of this month we have a close above 3762. So let's see! On the weekly chart: 1. SPX had rallied after testing the firby Juliac36
Q's (QQQ) Look Right for a...POP!Q's (QQQ) Look Right for a...POP! I spy a falling wedge and a higher low on the RSI indicator!!! Q's look ripe for a pop! It'll be nice if we open above 275.7 on Monday (Oct. 24, 2022). Also, the 5MA crossed up the 10MA on the daily and is approaching the 20MA. Therefore, my bias on QQQ is bullish. Peace, Love & Abundance, MrALtrades00 Longby MrALtrades003
Bullish Engulfing on ExxaroA bullish engulfing candle pattern has formed on JSE:EXX . This is a bottom reversal signal, so we could see a move up to around the R22 level.Longby RossLarter3
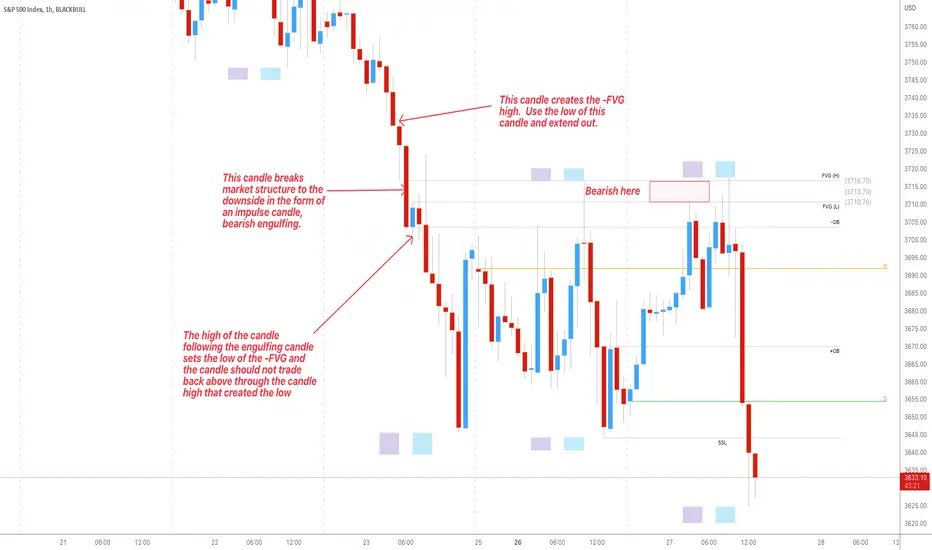
-FVG Example This candle creates the -FVG high. Use the low of this candle and extend out. This candle breaks market structure to the downside in the form of an impulse candle, bearish engulfing. The high of the candle following the engulfing candle sets the low of the -FVG and the candle should not trade back above through the candle high that created the lo. You can look for setups at the -FVG high @3716.70, middle @3713.70 and low @3710.70. Educationby iamCoryjp2
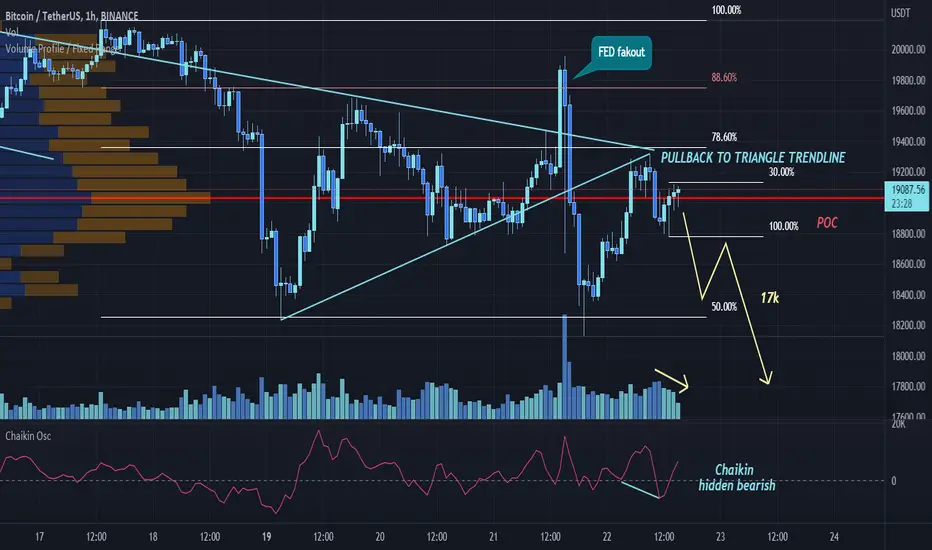
BTCUSDT pullback to triangle trendlineThere's no reason for bullish bias. The price action shows an engulfing bearish after a pullback to triangle upper trendline, healthy 30% retrace and retest. Supports broken. Price below daily volume point of control -rejected from POC. Expecting lower lows aiming 14.6% as seen on chart. 17K is possible in a next swing downward. Plus hidden bearish sign from Chaikin Oscillator. Fibonacci retracement applied w/ 88.6% and 14.6% key levels. Bearish 2-D swing to complete the major Head and ShoulderShortby firmestudioUpdated 68
EURCAD Target Price 1.35148EURCAD Currency Market. Engulfing Candlestick formed on the Daily Time Frame.Longby TradeLive-1

 LongLong
 Long
Long Education
 ShortShortLong
 Short
Short
 Long
Long Education

 Long
Long Short
Short Long
Long
 ShortLong
 LongLong
 LongEducationShortLong